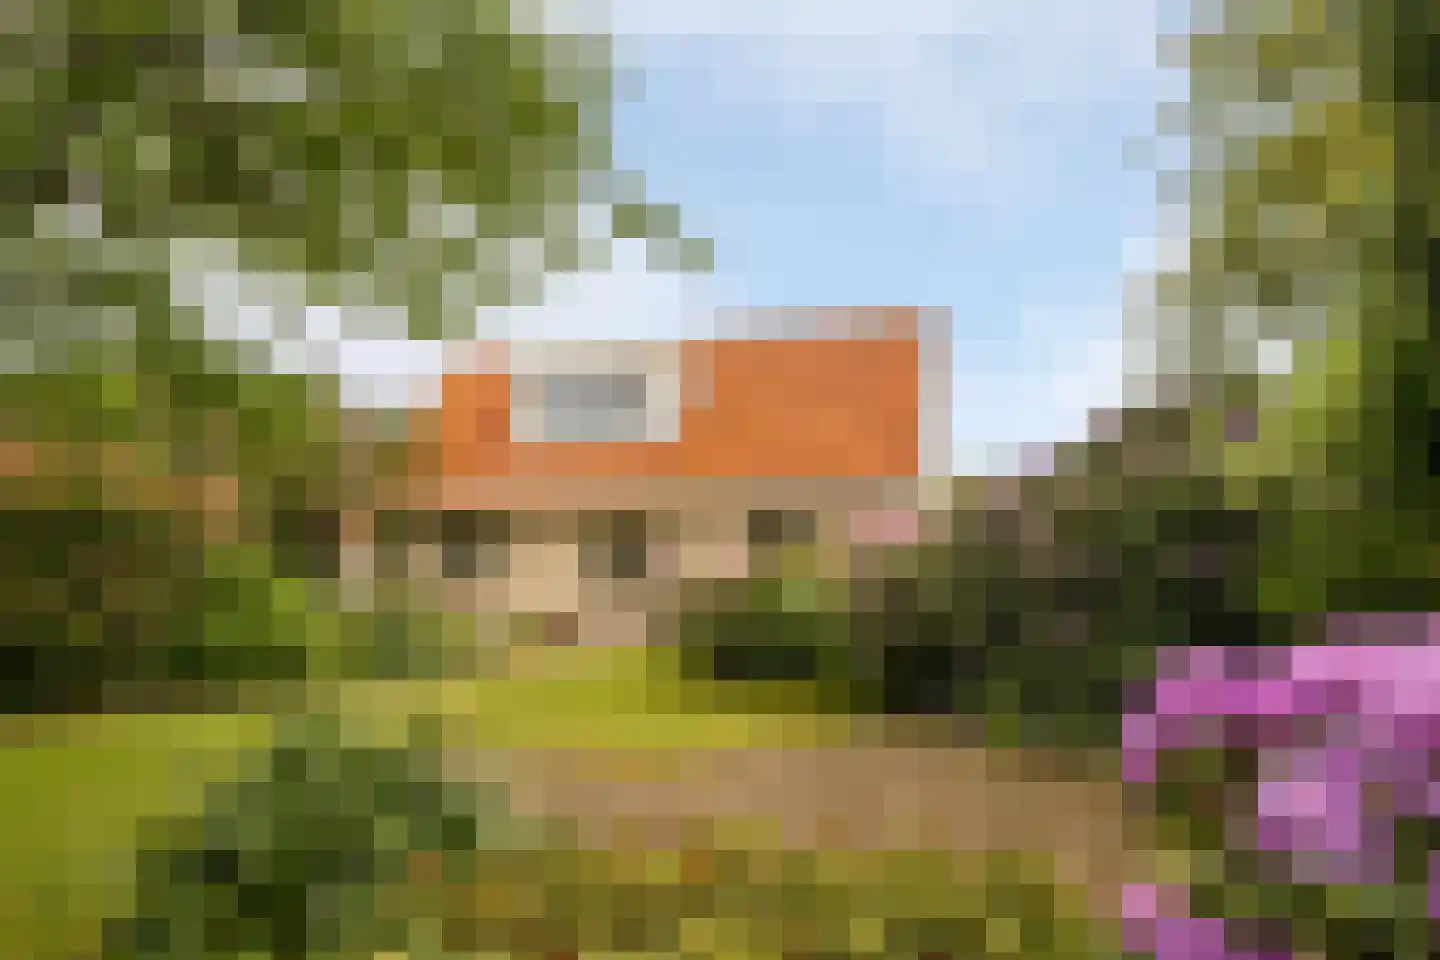
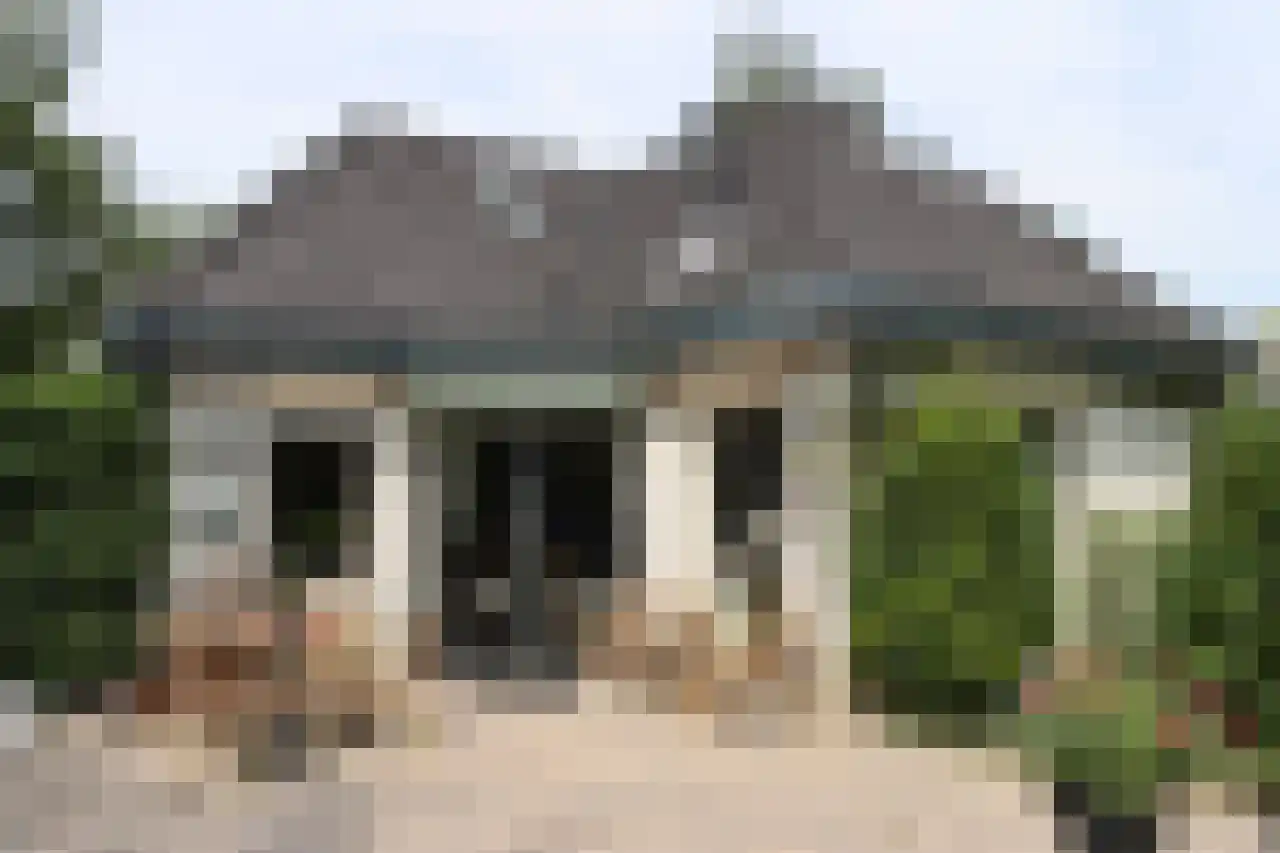
Housing offer in Garderen

Searching in 74 houses in Garderen

Connected to: Vastgoed Nederland NVM Makelaars

View the current housing stock in Garderen and quickly filter by price, living area, rooms and more. There are currently 74 houses in this place within our selection. View also 31 sold houses in Garderen for extra insight into the local housing market.

Selection

Search and filter homes

Set your preferences and discover homes that suit you.

Total supply 242.721
Filters

Set price, area and other characteristics. Adjust a filter or click on Show homes. Location changes directly above.

Reset filters

You search for

  • Place Garderen

Selling a home in Garderen? Compare realtor offers

Get free quotes from real estate agents with local market knowledge. Compare more than 23 real estate agents in Garderen.

Free request a quote

  • Quotes in Garderen
  • Non-binding
  • Personal
  • Compare free rates

Selling a home in Garderen? Compare all real estate agents in Garderen or view the top 10 real estate agents in Garderen for extra context for your choice.

Compare multiple quotes

Real estate agents make sharper offers when they know you're comparing — ask for quotes for sale or purchase.

Frequently asked questions about homes in Garderen

Practical answers about housing supply, sales and comparing real estate agents in Garderen.

Residential and neighborhood statistics in Garderen

View current location data on residents, WOZ development, housing stock, energy consumption, business activity and safety in Garderen. In 2025 were there 2.225 residents. The average WOZ value in 2025 is EUR 613.000.

These figures help to better assess and compare the housing stock in Garderen with recent sold homes. Orient yourself then on suitable top real estate agents in Garderen for sales advice in this region.

Residents

2.225

Last year: 2025

Average WOZ

EUR 613.000

Last year: 2025

Average income per person.

EUR 33.900

Source: AllNumbers

Crimes (current year)

49

Total registered

Demographics and WOZ development

Inhabitants per year

Inhabitants per year in Garderen
Year Residents
2021 2.150
2022 2.155
2023 2.155
2024 2.230
2025 2.225

Annual WOZ value

WOZ value per year in Garderen
Year Average WOZ
2021 EUR 441.000
2022 EUR 485.000
2023 EUR 555.000
2024 EUR 578.000
2025 EUR 613.000

Composition of residents

Age build-up

65+: 560 0-15: 345 15-25: 250 25-45: 430 45-65: 635

Education level

Hoger

420

Praktisch

400

Middelbaar

770

Origin of residents (2025)

Europa

65

Nederland

2.080

Buiten Europa

80

Housing stock and construction periods

Types of homes

Hoekwoningen 107
Appartementen 102
Tussenwoningen 152
Vrijstaande woningen 445
Twee-onder-één-kap woningen 144

Construction period of buildings

Voor 1700 2
1700 tot 1900 25
1900 tot 1925 28
1925 tot 1950 107
1950 tot 1970 295
1970 tot 1980 172
1980 tot 1990 242
1990 tot 2000 279
2000 tot 2010 136
2010 tot 2020 115
2020 en later 288

Energy and sustainability

Energy label distribution

Label C

303

Label A

213

Label B

186

Label F

145

Label D

141

Label G

92

Label E

57

Label A+++

38

Label A++

30

Label A++++

18

Label A+

16

Label A+++++

0

Average energy consumption per year

Average energy consumption per year in Garderen
Year Gas (m3) Electricity (kWh)
2020 1.710 3.630
2021 1.950 3.760
2022 1.500 3.570
2023 1.200 3.440
2024 1.130 3.440

Consumption per house type

Hoekwoning

Gas: 990 • Electricity: 2.380

Huurwoning

Gas: 990 • Electricity: 2.500

Koopwoning

Gas: 1.270 • Electricity: 3.770

Appartement

Gas: 790 • Electricity: 2.600

Tussenwoning

Gas: 840 • Electricity: 2.370

Vrijstaande woning

Gas: 1.500 • Electricity: 4.250

Twee-onder-één-kap woning

Gas: 1.130 • Electricity: 3.540

Business activity in Garderen (2025)

Handel en HORECA 95
Nijverheid en energie 95
Zakelijke dienstverlening 110
Overheid, onderwijs en zorg 40
Landbouw, bosbouw en visserij 15
Vervoer, informatie en communicatie 15
Financiele diensten en onroerendgoed 45
Cultuur, recreatie en overige diensten 20

Total number of company establishments: 440

Recent crime statistics

Recent crime statistics in Garderen
Period Crimes
jan 2025 5
jan 2026 7
jul 2025 5
jun 2025 4
mei 2025 7
mrt 2025 3
nov 2024 3
nov 2025 7
okt 2024 5
okt 2025 5
sep 2024 7
sep 2025 2

These figures give an indicative picture of safety trends in the living environment of Garderen.

Frequently asked questions about living in Garderen

Short answers based on current local statistics, handy for a quick comparison of the living environment.

Hoeveel inwoners heeft Garderen?

Garderen telt in 2025 ongeveer 2.225 inwoners.

Wat is de gemiddelde WOZ-waarde in Garderen?

De gemiddelde WOZ-waarde in Garderen is in 2025 circa € 613.000.

Wat is het gemiddelde inkomen per inwoner in Garderen?

Het gemiddelde inkomen per inwoner in Garderen ligt rond € 33.900 per jaar.

Hoe veilig is wonen in Garderen?

Voor het huidige jaar gaat het om ongeveer 49 geregistreerde misdrijven. Gebruik deze cijfers als indicatie en vergelijk trends per periode.

Welke woningtypen komen het meest voor in Garderen?

In Garderen komt vooral "Vrijstaande woningen" veel voor, met ongeveer 445 woningen.

Receive free, non-binding quotes

Compare multiple real estate agents and choose the best match.