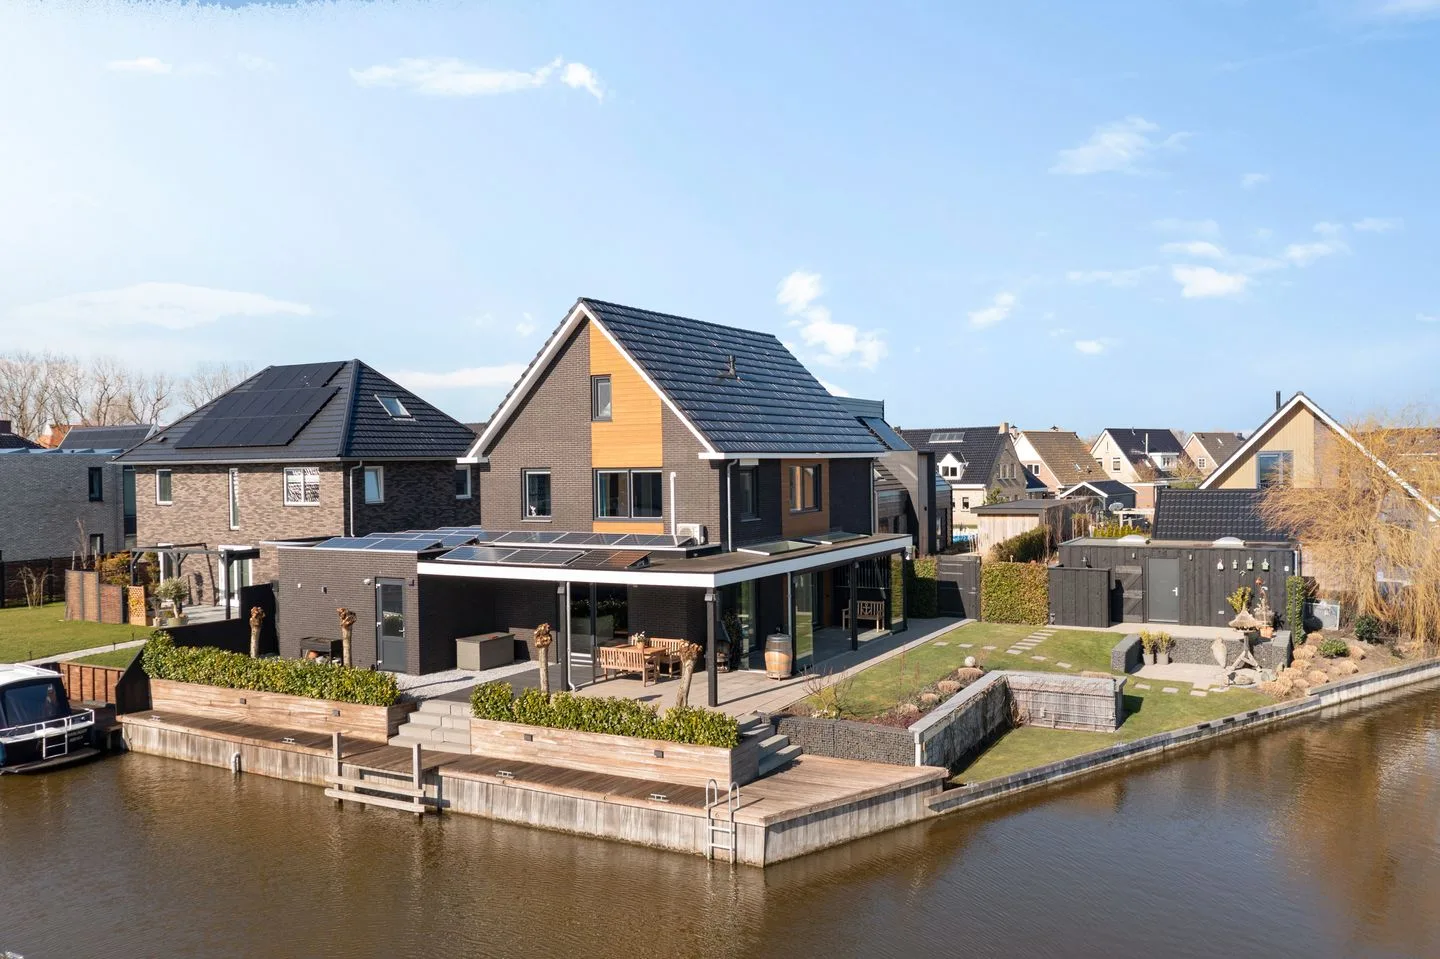
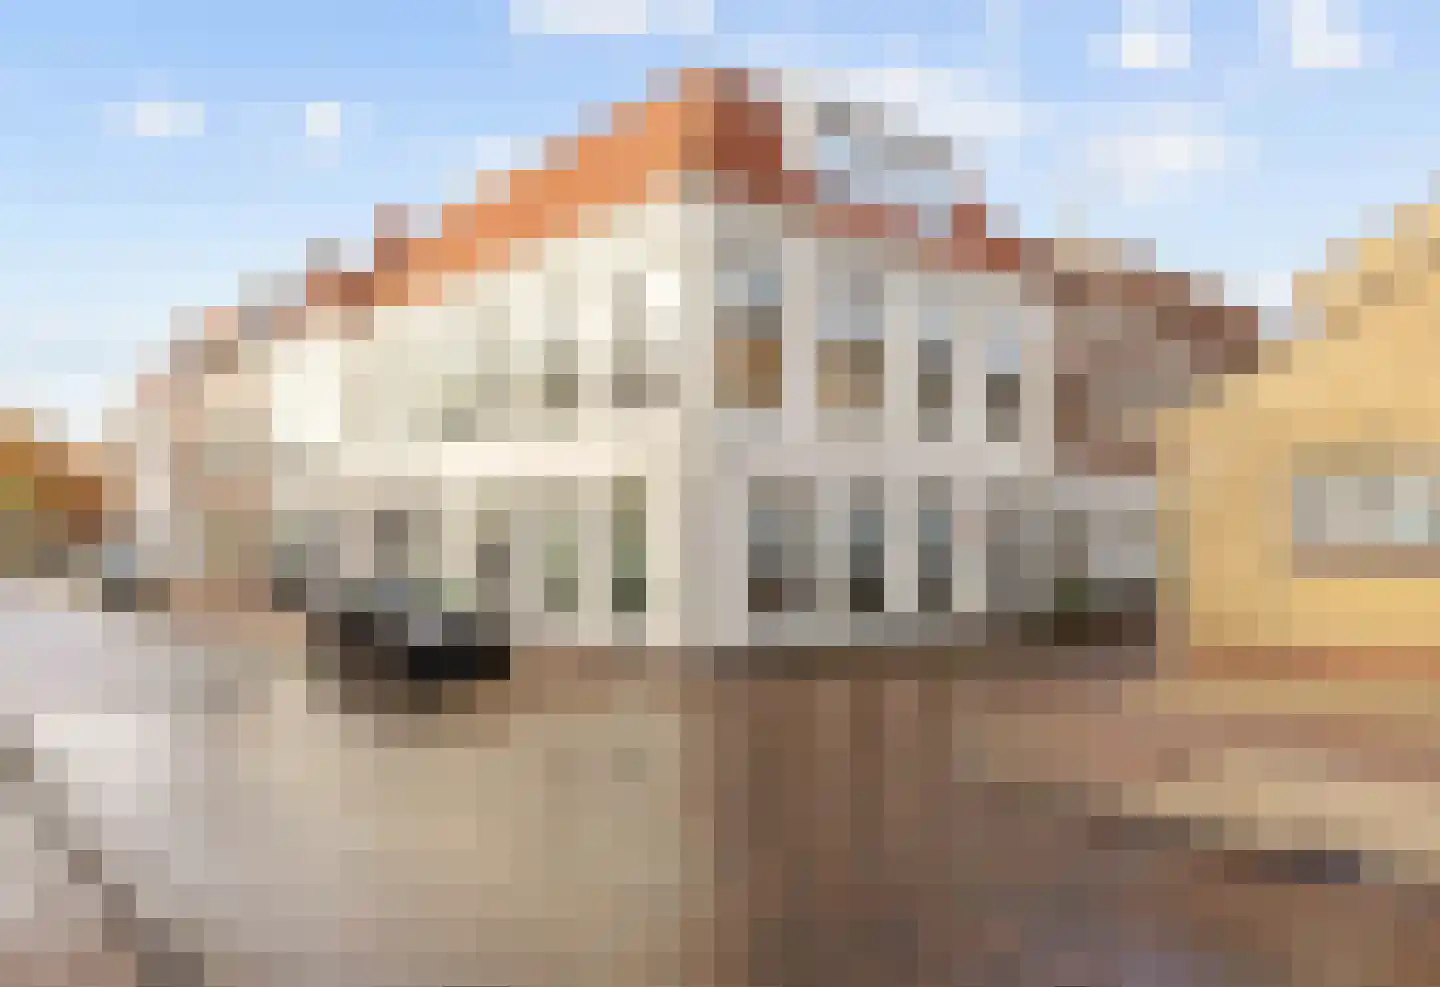
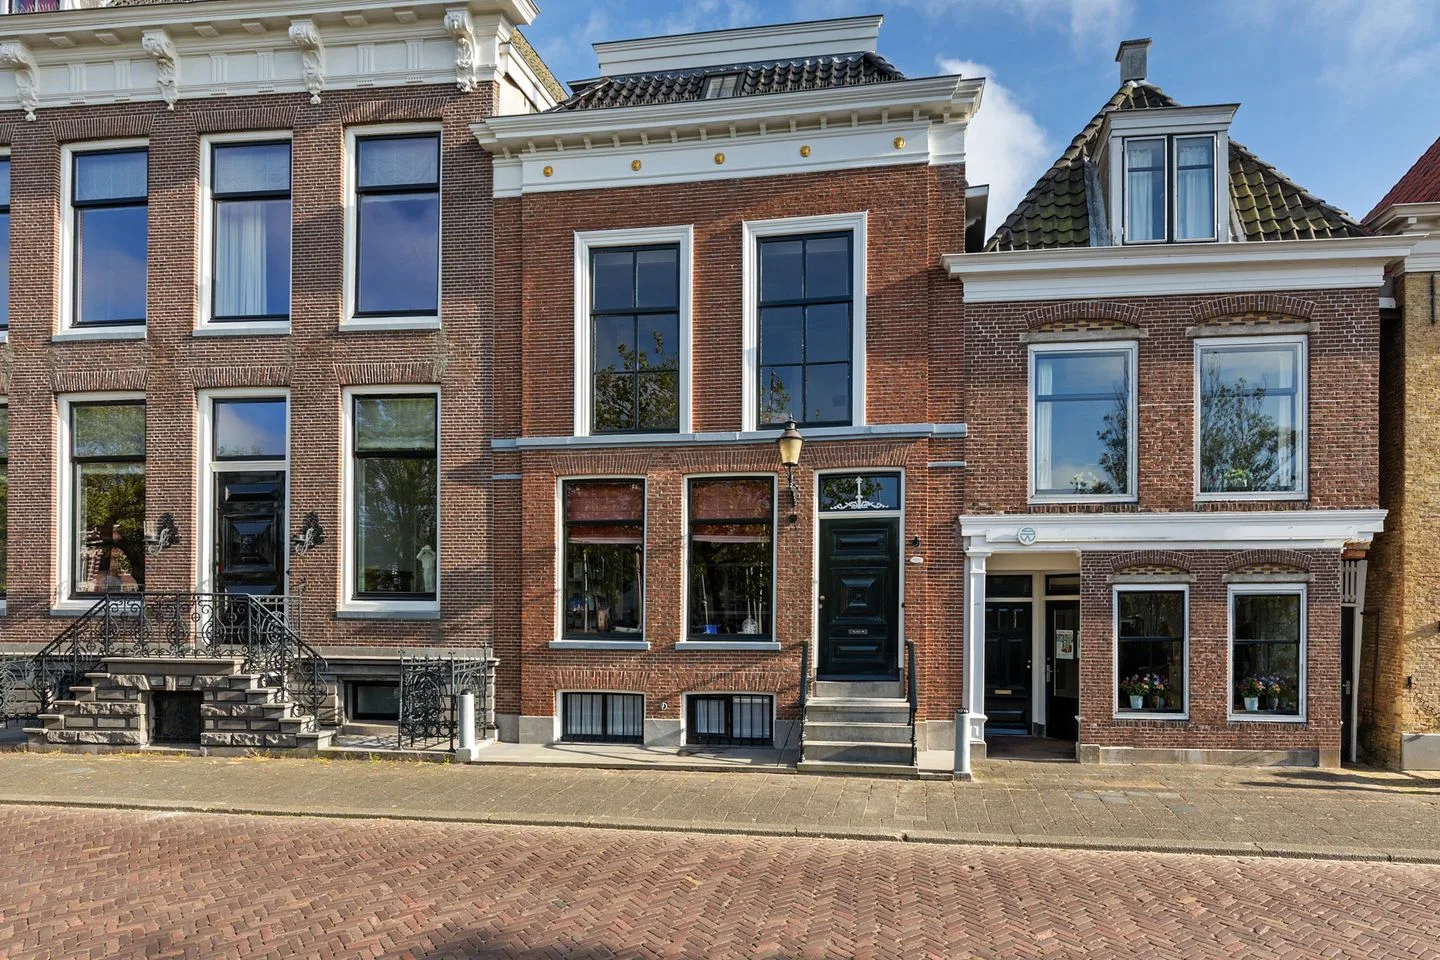
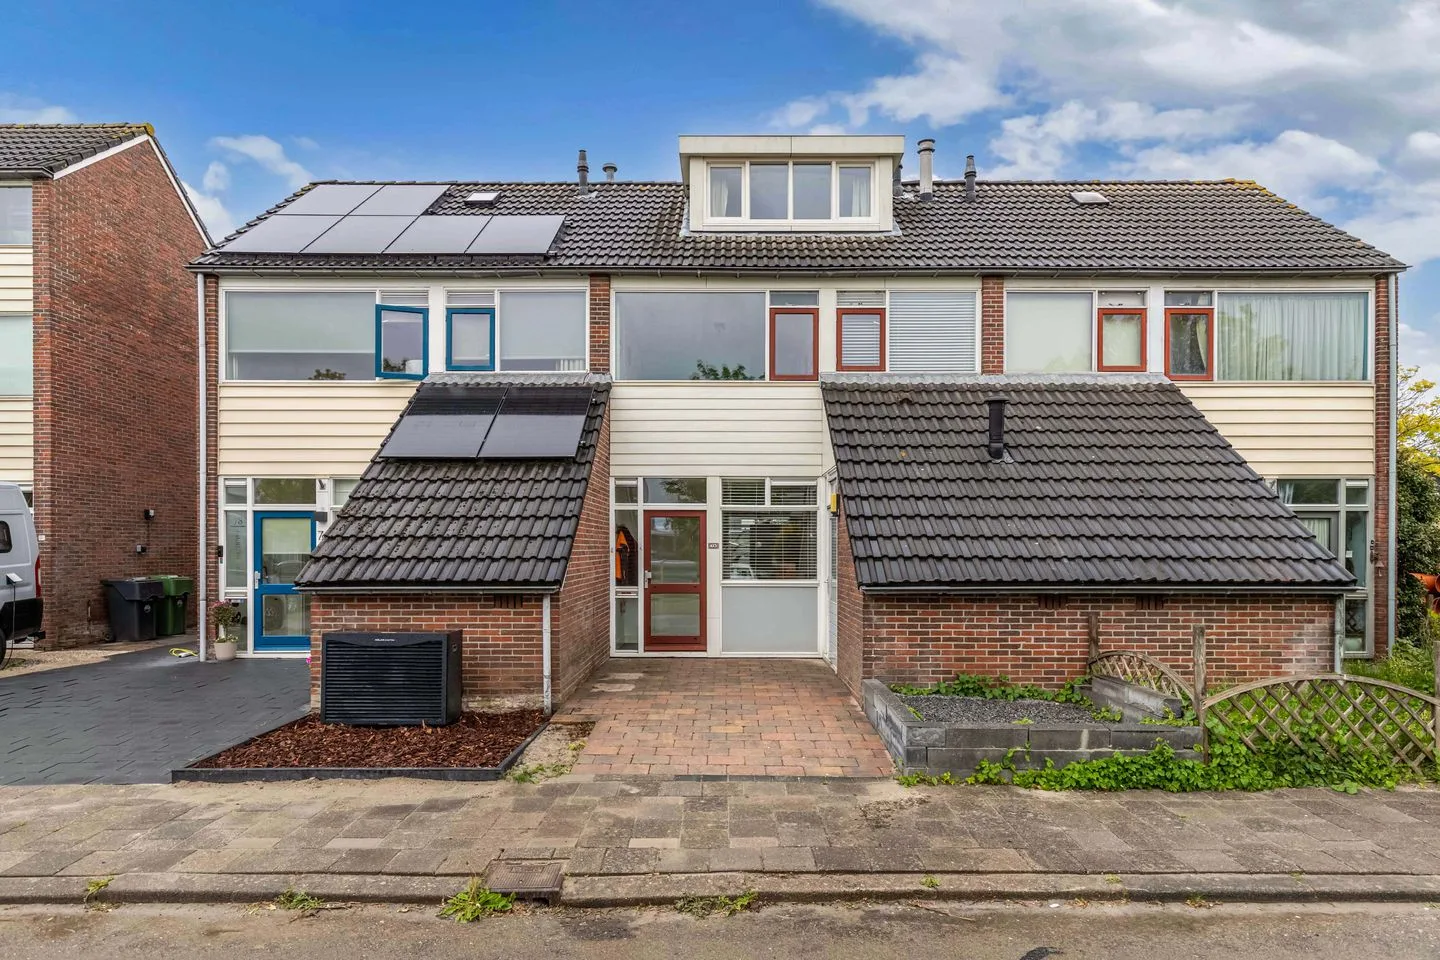
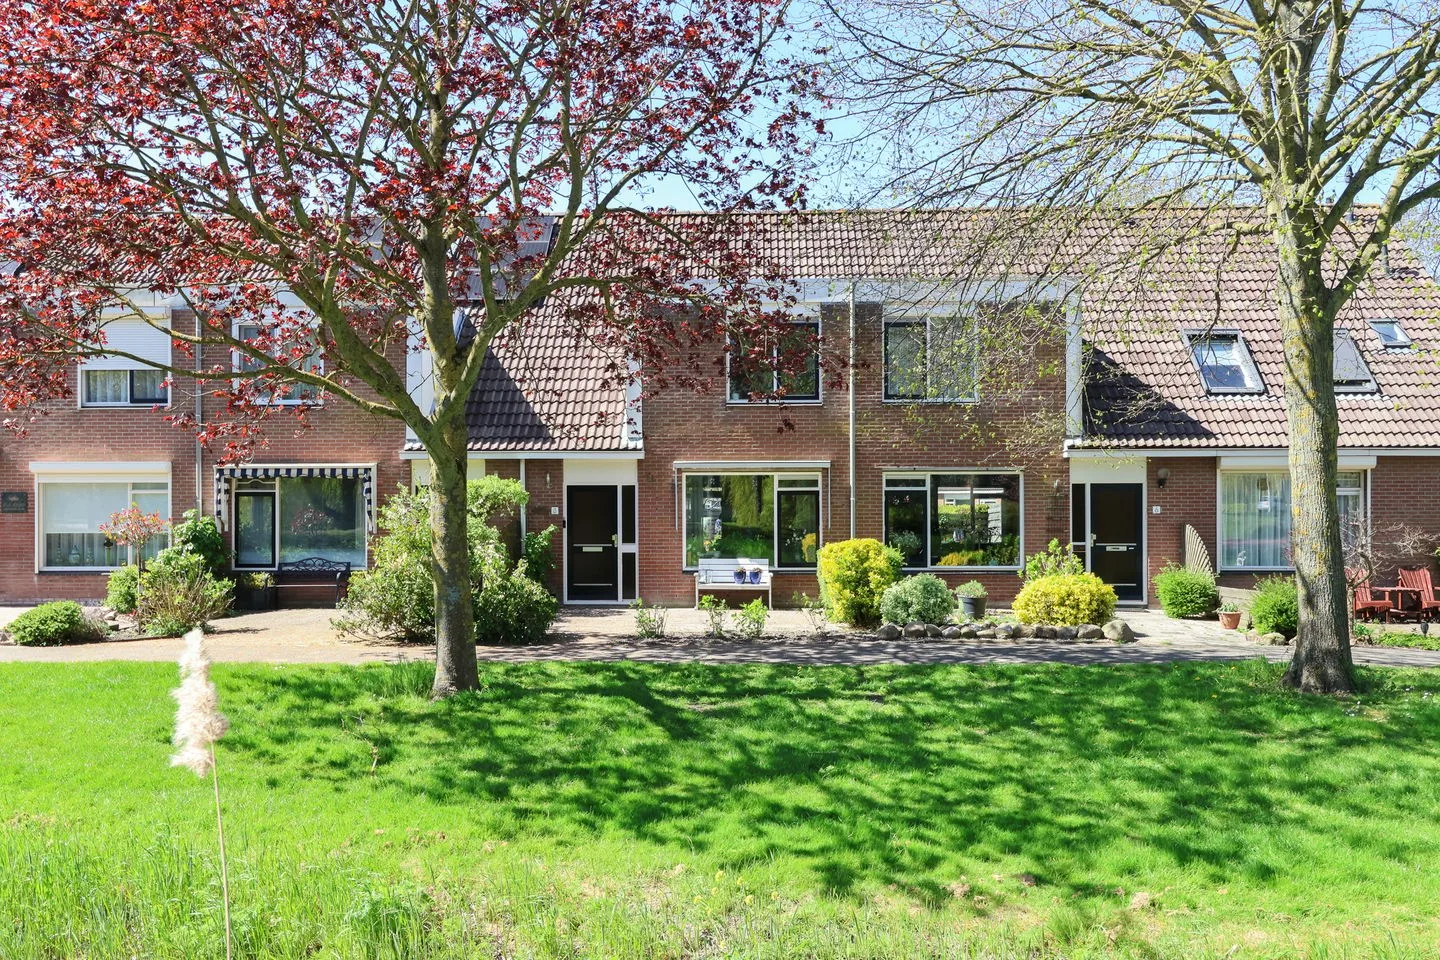
Housing offer in Harlingen

Searching in 187 houses in Harlingen

Connected to: Vastgoed Nederland NVM Makelaars

View the current housing stock in Harlingen and quickly filter by price, living area, rooms and more. There are currently 187 houses in this place within our selection. View also 114 sold houses in Harlingen for extra insight into the local housing market.

Selection

Search and filter homes

Set your preferences and discover homes that suit you.

Total supply 242.654
Filters

Set price, area and other characteristics. Adjust a filter or click on Show homes. Location changes directly above.

Reset filters

You search for

  • Place Harlingen

Selling a home in Harlingen? Compare realtor offers

Get free quotes from real estate agents with local market knowledge. Compare more than 16 real estate agents in Harlingen.

Free request a quote

  • Quotes in Harlingen
  • Non-binding
  • Personal
  • Compare free rates

Selling a home in Harlingen? View the sales-oriented guide sell a house in Harlingen, compare all real estate agents in Harlingen or view the top 10 real estate agents in Harlingen for extra context to your choice.

Compare multiple quotes

Real estate agents make sharper offers when they know you're comparing — ask for quotes for sale or purchase.

Frequently asked questions about homes in Harlingen

Practical answers about housing supply, sales and comparing real estate agents in Harlingen.

Residential and neighborhood statistics in Harlingen

View current location data on residents, WOZ development, housing stock, energy consumption, business activity and safety in Harlingen. In 2026 were there 15.151 residents. The average WOZ value in 2025 is EUR 261.000.

These figures help to better assess and compare the housing stock in Harlingen with recent sold homes. Orient yourself then on suitable top real estate agents in Harlingen for sales advice in this region.

Residents

15.151

Last year: 2026

Average WOZ

EUR 261.000

Last year: 2025

Average income per person.

EUR 29.900

Source: AllNumbers

Crimes (current year)

437

Total registered

Demographics and WOZ development

Inhabitants per year

Inhabitants per year in Harlingen
Year Residents
2021 14.715
2022 14.810
2023 15.095
2024 15.140
2025 15.105
2026 15.151

Annual WOZ value

WOZ value per year in Harlingen
Year Average WOZ
2021 EUR 189.000
2022 EUR 206.000
2023 EUR 236.000
2024 EUR 246.000
2025 EUR 261.000

Composition of residents

Age build-up

65+: 4.310 0-15: 2.015 15-25: 1.660 25-45: 3.075 45-65: 4.100

Education level

Hoger

2.560

Praktisch

3.280

Middelbaar

5.110

Origin of residents (2025)

Europa

1.025

Nederland

12.770

Buiten Europa

1.310

Housing stock and construction periods

Types of homes

Hoekwoningen 1.428
Appartementen 1.929
Tussenwoningen 2.897
Vrijstaande woningen 761
Twee-onder-één-kap woningen 780

Construction period of buildings

Voor 1700 51
1700 tot 1900 1.022
1900 tot 1925 288
1925 tot 1950 457
1950 tot 1970 1.213
1970 tot 1980 1.512
1980 tot 1990 678
1990 tot 2000 465
2000 tot 2010 681
2010 tot 2020 375
2020 en later 241

Energy and sustainability

Energy label distribution

Label A

3.049

Label C

1.533

Label B

1.046

Label G

839

Label D

468

Label F

448

Label A+++

331

Label A+

176

Label E

161

Label A++

43

Label A++++

9

Label A+++++

2

Average energy consumption per year

Average energy consumption per year in Harlingen
Year Gas (m3) Electricity (kWh)
2020 1.190 2.360
2021 1.320 2.410
2022 1.020 2.250
2023 860 2.180
2024 830 2.260

Consumption per house type

Hoekwoning

Gas: 930 • Electricity: 2.190

Huurwoning

Gas: 730 • Electricity: 1.620

Koopwoning

Gas: 970 • Electricity: 2.650

Appartement

Gas: 620 • Electricity: 1.740

Tussenwoning

Gas: 880 • Electricity: 2.010

Vrijstaande woning

Gas: 1.170 • Electricity: 3.530

Twee-onder-één-kap woning

Gas: 940 • Electricity: 2.670

Business activity in Harlingen (2025)

Handel en HORECA 350
Nijverheid en energie 335
Zakelijke dienstverlening 375
Overheid, onderwijs en zorg 265
Landbouw, bosbouw en visserij 55
Vervoer, informatie en communicatie 175
Financiele diensten en onroerendgoed 70
Cultuur, recreatie en overige diensten 200

Total number of company establishments: 1.820

Recent crime statistics

Recent crime statistics in Harlingen
Period Crimes
jan 2026 46
jul 2025 32
jun 2025 40
mei 2025 32
mrt 2025 27
mrt 2026 61
nov 2024 30
nov 2025 60
okt 2024 30
okt 2025 41
sep 2024 39
sep 2025 43

These figures give an indicative picture of safety trends in the living environment of Harlingen.

Frequently asked questions about living in Harlingen

Short answers based on current local statistics, handy for a quick comparison of the living environment.

Hoeveel inwoners heeft Harlingen?

Harlingen telt in 2026 ongeveer 15.151 inwoners.

Wat is de gemiddelde WOZ-waarde in Harlingen?

De gemiddelde WOZ-waarde in Harlingen is in 2025 circa € 261.000.

Wat is het gemiddelde inkomen per inwoner in Harlingen?

Het gemiddelde inkomen per inwoner in Harlingen ligt rond € 29.900 per jaar.

Hoe veilig is wonen in Harlingen?

Voor het huidige jaar gaat het om ongeveer 437 geregistreerde misdrijven. Gebruik deze cijfers als indicatie en vergelijk trends per periode.

Welke woningtypen komen het meest voor in Harlingen?

In Harlingen komt vooral "Tussenwoningen" veel voor, met ongeveer 2.897 woningen.

Receive free, non-binding quotes

Compare multiple real estate agents and choose the best match.