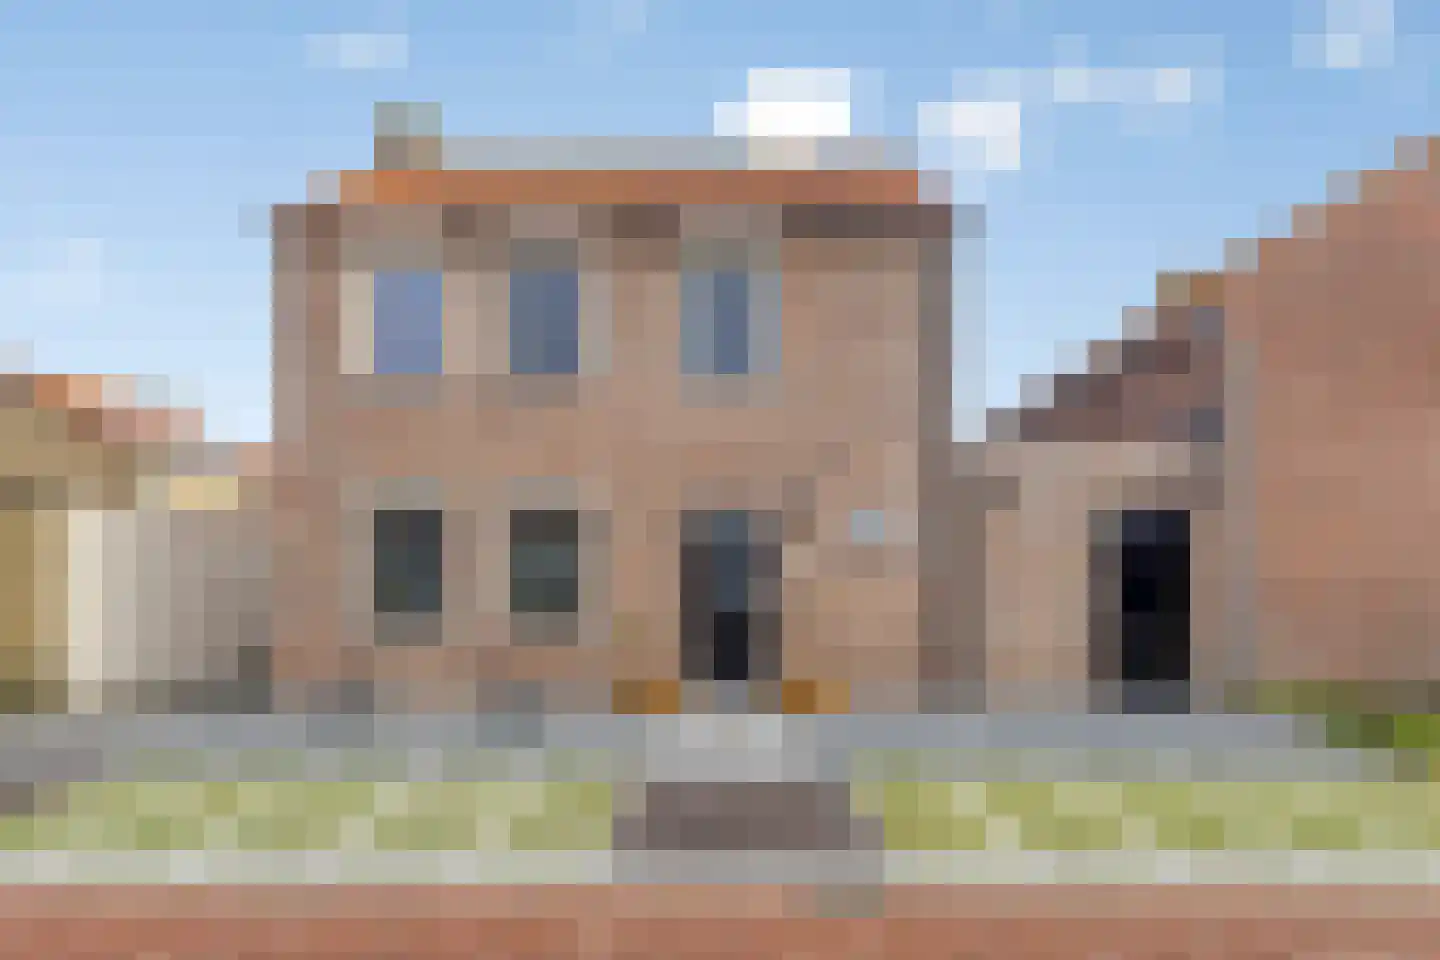
Houses sold in Hoofdplaat

View 9 sold houses in Hoofdplaat

Connected to: Vastgoed Nederland NVM Makelaars

On this page you will find recently sold homes in Hoofdplaat. Use this overview to better estimate selling prices, popular neighborhoods, and the local housing supply before you choose a real estate agent. Also view the current housing supply with 25 houses in Hoofdplaat.

Selection

Search and filter homes

Set your preferences and discover homes that suit you.

Total supply 242.722
Filters

Set price, area and other characteristics. Adjust a filter or click on Show homes. Location changes directly above.

Reset filters

You search for

  • Place Hoofdplaat
  • Status Sold

Huis verkopen in Hoofdplaat? Vergelijk verkoopmakelaars

Bekijk recente verkopen en ontvang gratis offertes van lokale makelaars. Vergelijk meer dan 19 makelaars in Hoofdplaat.

Free request a quote

  • Quotes in Hoofdplaat
  • Non-binding
  • Personal
  • Gratis tarieven vergelijken

Zelf je woning verkopen in Hoofdplaat? Vergelijk verkoopmakelaars in Hoofdplaat of bekijk de beste verkoopmakelaars in Hoofdplaat als referentie bij jouw keuze.

Vergelijk meerdere offertes

Makelaars maken scherpere voorstellen als ze weten dat je vergelijkt — vraag offertes aan voor verkoop of aankoop.

Frequently asked questions about sold homes in Hoofdplaat

Short answers about housing prices, sold homes and comparing real estate agents in Hoofdplaat.

Residential and neighborhood statistics in Hoofdplaat

View current location data on residents, WOZ development, housing stock, energy consumption, business activity and safety in Hoofdplaat. In 2025 were there 702 residents. The average WOZ value in 2025 is EUR 274.647.

These figures help to better assess and compare the housing stock in Hoofdplaat with recent sold homes. Orient yourself then on suitable top real estate agents in Hoofdplaat for sales advice in this region.

Residents

702

Last year: 2025

Average WOZ

EUR 274.647

Last year: 2025

Average income per person.

EUR 31.439

Source: AllNumbers

Crimes (current year)

11

Total registered

Demographics and WOZ development

Inhabitants per year

Inhabitants per year in Hoofdplaat
Year Residents
2021 710
2022 711
2023 712
2024 703
2025 702

Annual WOZ value

WOZ value per year in Hoofdplaat
Year Average WOZ
2021 EUR 199.746
2022 EUR 222.884
2023 EUR 251.251
2024 EUR 266.009
2025 EUR 274.647

Composition of residents

Age build-up

65+: 215 0-15: 70 15-25: 51 25-45: 133 45-65: 240

Education level

Hoger

60

Praktisch

90

Middelbaar

266

Origin of residents (2025)

Europa

151

Nederland

530

Buiten Europa

23

Housing stock and construction periods

Types of homes

Hoekwoningen 62
Appartementen 16
Tussenwoningen 113
Vrijstaande woningen 182
Twee-onder-één-kap woningen 96

Construction period of buildings

Voor 1700 0
1700 tot 1900 38
1900 tot 1925 93
1925 tot 1950 145
1950 tot 1970 97
1970 tot 1980 53
1980 tot 1990 22
1990 tot 2000 106
2000 tot 2010 71
2010 tot 2020 6
2020 en later 6

Energy and sustainability

Energy label distribution

Label G

117

Label F

92

Label C

91

Label B

83

Label E

51

Label D

46

Label A

41

Label A+

2

Label A+++

2

Label A++

0

Label A++++

0

Label A+++++

0

Average energy consumption per year

Average energy consumption per year in Hoofdplaat
Year Gas (m3) Electricity (kWh)
2020 1.297 2.442
2021 1.527 2.623
2022 1.137 2.493
2023 985 2.355
2024 966 2.430

Consumption per house type

Hoekwoning

Gas: 721 • Electricity: 1.469

Huurwoning

Gas: 782 • Electricity: 1.349

Koopwoning

Gas: 1.046 • Electricity: 2.619

Appartement

Gas: 535 • Electricity: 1.589

Tussenwoning

Gas: 577 • Electricity: 1.197

Vrijstaande woning

Gas: 1.193 • Electricity: 3.018

Twee-onder-één-kap woning

Gas: 854 • Electricity: 1.891

Business activity in Hoofdplaat (2025)

Handel en HORECA 14
Nijverheid en energie 19
Zakelijke dienstverlening 20
Overheid, onderwijs en zorg 9
Landbouw, bosbouw en visserij 16
Vervoer, informatie en communicatie 5
Financiele diensten en onroerendgoed 0
Cultuur, recreatie en overige diensten 9

Total number of company establishments: 109

Recent crime statistics

Recent crime statistics in Hoofdplaat
Period Crimes
jan 2026 1
jul 2025 0
jun 2025 2
mei 2025 0
mrt 2025 0
mrt 2026 0
nov 2024 0
nov 2025 0
okt 2024 0
okt 2025 2
sep 2024 0
sep 2025 3

These figures give an indicative picture of safety trends in the living environment of Hoofdplaat.

Frequently asked questions about living in Hoofdplaat

Short answers based on current local statistics, handy for a quick comparison of the living environment.

Hoeveel inwoners heeft Hoofdplaat?

Hoofdplaat telt in 2025 ongeveer 702 inwoners.

Wat is de gemiddelde WOZ-waarde in Hoofdplaat?

De gemiddelde WOZ-waarde in Hoofdplaat is in 2025 circa € 274.647.

Wat is het gemiddelde inkomen per inwoner in Hoofdplaat?

Het gemiddelde inkomen per inwoner in Hoofdplaat ligt rond € 31.439 per jaar.

Hoe veilig is wonen in Hoofdplaat?

Voor het huidige jaar gaat het om ongeveer 11 geregistreerde misdrijven. Gebruik deze cijfers als indicatie en vergelijk trends per periode.

Welke woningtypen komen het meest voor in Hoofdplaat?

In Hoofdplaat komt vooral "Vrijstaande woningen" veel voor, met ongeveer 182 woningen.

Receive free, non-binding quotes

Compare multiple real estate agents and choose the best match.