- Available
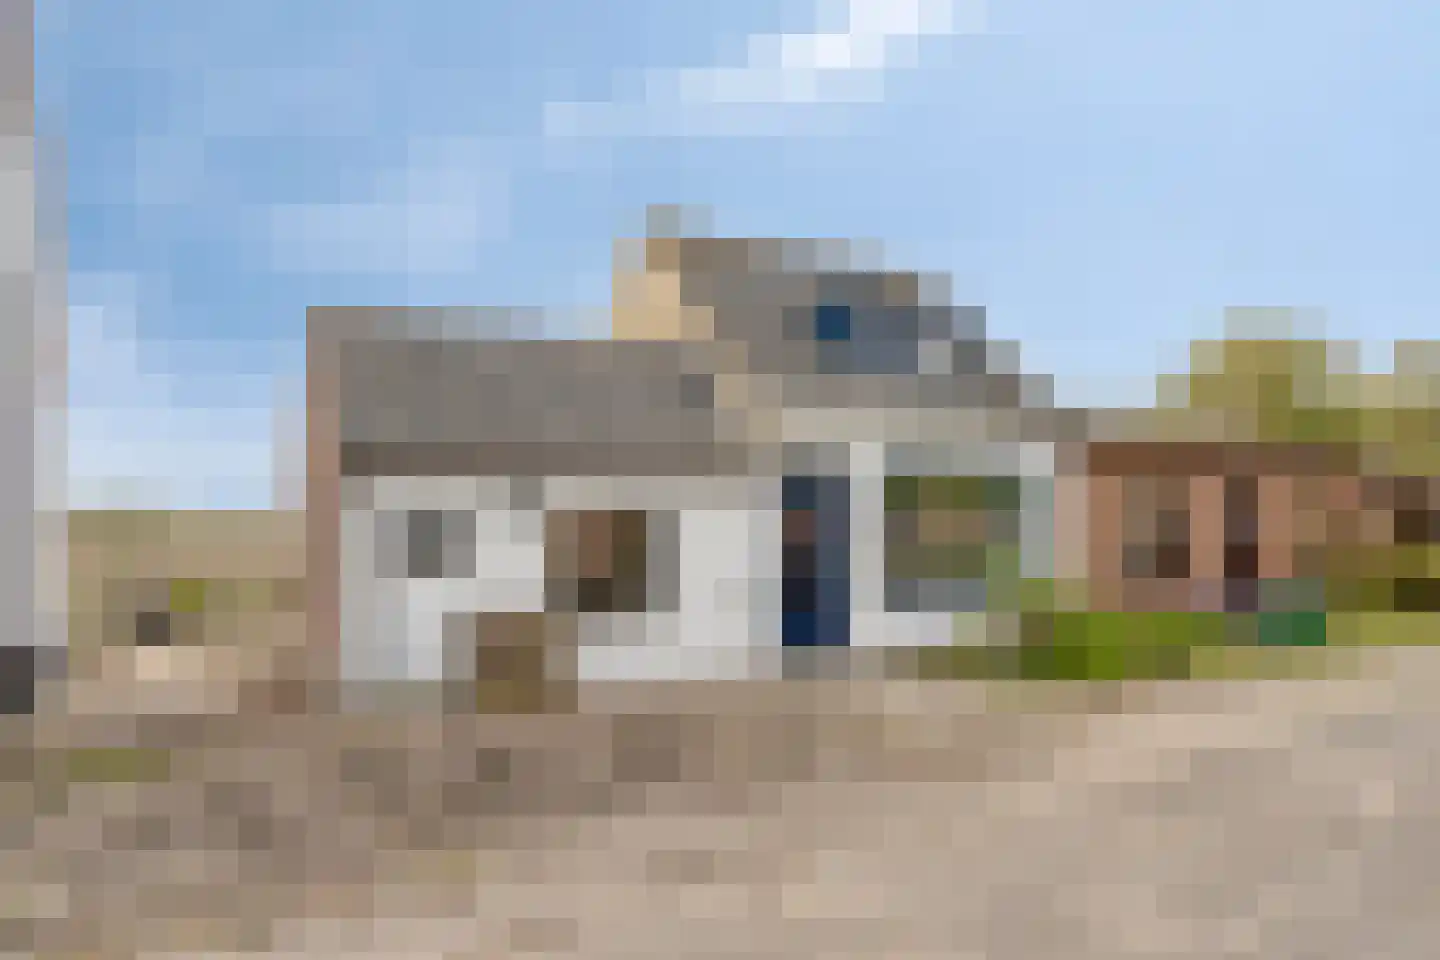
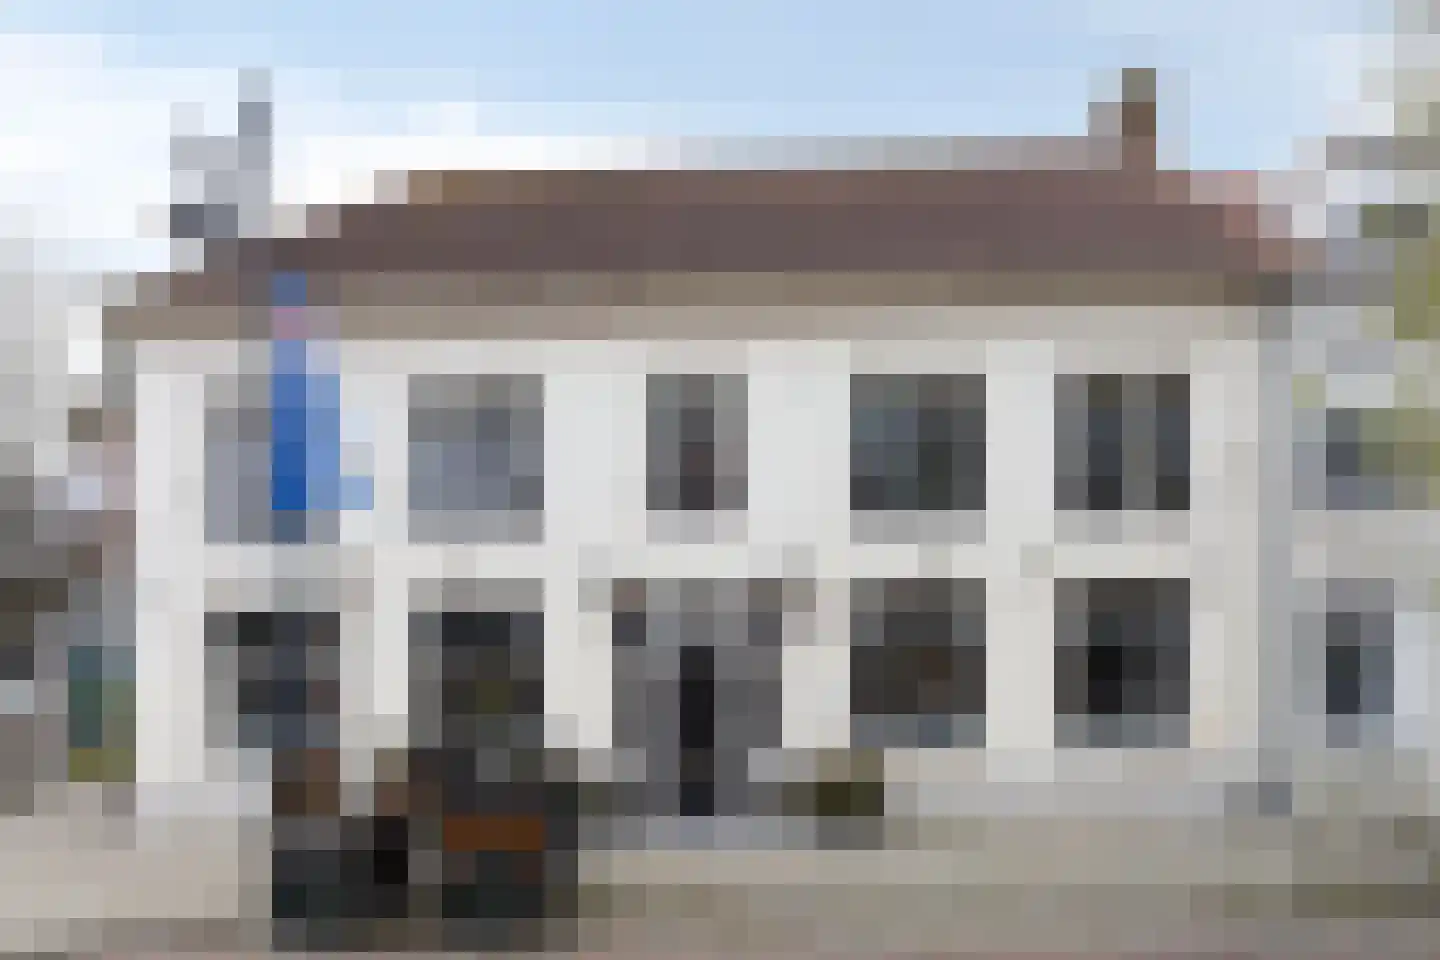
Koningin Julianastraat 14
4513AZ Hoofdplaat
€ 259.000 k.k.
- Living area
- 91 m²
- Land area
- 243 m²
- Bedrooms
- 3
Searching in 24 houses in Hoofdplaat
Type to search. Use arrow down and arrow up to navigate through results and press Enter to open.
Hidden search suggestions.
View current properties in Hoofdplaat or search targeted on street, postal code and property characteristics.
View the current housing stock in Hoofdplaat and quickly filter by price, living area, rooms and more. There are currently 24 houses in this place within our selection. View also 12 sold houses in Hoofdplaat for extra insight into the local housing market.
4513AZ Hoofdplaat
€ 259.000 k.k.
4513AZ Hoofdplaat
€ 225.000 k.k.
4513AN Hoofdplaat
€ 185.000 k.k.
€ 2.534/m²
4513KA Hoofdplaat
€ 179.000 k.k.
€ 2.754/m²
4513KN Hoofdplaat
€ 389.000 k.k.
€ 4.576/m²
4513KM Hoofdplaat
€ 299.000 k.k.
4513AM Hoofdplaat
€ 445.000 k.k.
€ 1.382/m²
4513AZ Hoofdplaat
€ 210.000 k.k.
€ 2.258/m²
4513AR Hoofdplaat
€ 590.000 k.k.
€ 1.344/m²
4513KM Hoofdplaat
€ 297.500 k.k.
€ 3.459/m²
4513KM Hoofdplaat
€ 335.000 k.k.
4513AV Hoofdplaat
€ 499.000 k.k.
€ 2.918/m²
4513AT Hoofdplaat
€ 349.000 k.k.
€ 3.009/m²
4513AZ Hoofdplaat
€ 255.000 k.k.
€ 2.576/m²
4513KS Hoofdplaat
€ 299.000 k.k.
€ 2.693/m²
4513AW Hoofdplaat
€ 225.000 k.k.
€ 2.445/m²
4513KM Hoofdplaat
€ 149.000 k.k.
€ 1.000/m²
4513AE Hoofdplaat
€ 449.000 k.k.
€ 2.954/m²
4513KR Hoofdplaat
€ 280.000 k.k.
€ 3.333/m²
4513KM Hoofdplaat
€ 235.000 k.k.
€ 2.862/m²
4513AZ Hoofdplaat
€ 189.000 k.k.
€ 2.392/m²
4513AJ Hoofdplaat
€ 179.500 k.k.
€ 2.063/m²
4513AK Hoofdplaat
€ 259.000 k.k.
€ 0/m²
4513KN Hoofdplaat
€ 425.000 k.k.
€ 4.009/m²
Get free quotes from real estate agents with local market knowledge. Compare more than 21 real estate agents in Hoofdplaat.
Selling a home in Hoofdplaat? Compare all real estate agents in Hoofdplaat or view the top 10 real estate agents in Hoofdplaat for extra context for your choice.
Real estate agents make sharper offers when they know you're comparing — ask for quotes for sale or purchase.
Practical answers about housing supply, sales and comparing real estate agents in Hoofdplaat.
The costs of a real estate agent in Hoofdplaat depend on commission, setup costs, property presentation and the chosen service. Compare the 21 real estate agents in Hoofdplaat via the real estate agent page and request multiple quotes to compare rates and approach well.
Within our selection, we are currently showing 24 houses in Hoofdplaat. View also the sold houses in Hoofdplaat to compare the current offering with recent transactions.
Take into account not only price and living area but also maintenance, energy label, location, outdoor space and sales status. This way you compare houses in Hoofdplaat on more than just the asking price.
A local real estate agent knows the neighborhoods, recent transactions and demand in Hoofdplaat. By comparing 21 real estate agents in the region you get a better insight into prices, sales strategy and expected yield; the top 10 in Hoofdplaat provides a useful starting point.
Yes, when making a sales plan, a valuation in Hoofdplaat is wise. You gain insight into a realistic asking price and can then compare offers from real estate agents specifically.
View current location data on residents, WOZ development, housing stock, energy consumption, business activity and safety in Hoofdplaat. In 2025 were there 702 residents. The average WOZ value in 2025 is EUR 274.647.
These figures help to better assess and compare the housing stock in Hoofdplaat with recent sold homes. Orient yourself then on suitable top real estate agents in Hoofdplaat for sales advice in this region.
Residents
702
Last year: 2025
Average WOZ
EUR 274.647
Last year: 2025
Average income per person.
EUR 31.439
Source: AllNumbers
Crimes (current year)
11
Total registered
| Year | Residents |
|---|---|
| 2021 | 710 |
| 2022 | 711 |
| 2023 | 712 |
| 2024 | 703 |
| 2025 | 702 |
| Year | Average WOZ |
|---|---|
| 2021 | EUR 199.746 |
| 2022 | EUR 222.884 |
| 2023 | EUR 251.251 |
| 2024 | EUR 266.009 |
| 2025 | EUR 274.647 |
Hoger
60
Praktisch
90
Middelbaar
266
Europa
151
Nederland
530
Buiten Europa
23
Label G
117
Label F
92
Label C
91
Label B
83
Label E
51
Label D
46
Label A
41
Label A+
2
Label A+++
2
Label A++
0
Label A++++
0
Label A+++++
0
| Year | Gas (m3) | Electricity (kWh) |
|---|---|---|
| 2020 | 1.297 | 2.442 |
| 2021 | 1.527 | 2.623 |
| 2022 | 1.137 | 2.493 |
| 2023 | 985 | 2.355 |
| 2024 | 966 | 2.430 |
Hoekwoning
Gas: 721 • Electricity: 1.469
Huurwoning
Gas: 782 • Electricity: 1.349
Koopwoning
Gas: 1.046 • Electricity: 2.619
Appartement
Gas: 535 • Electricity: 1.589
Tussenwoning
Gas: 577 • Electricity: 1.197
Vrijstaande woning
Gas: 1.193 • Electricity: 3.018
Twee-onder-één-kap woning
Gas: 854 • Electricity: 1.891
Total number of company establishments: 109
| Period | Crimes |
|---|---|
| jan 2026 | 1 |
| jul 2025 | 0 |
| jun 2025 | 2 |
| mei 2025 | 0 |
| mrt 2025 | 0 |
| mrt 2026 | 0 |
| nov 2024 | 0 |
| nov 2025 | 0 |
| okt 2024 | 0 |
| okt 2025 | 2 |
| sep 2024 | 0 |
| sep 2025 | 3 |
These figures give an indicative picture of safety trends in the living environment of Hoofdplaat.
Short answers based on current local statistics, handy for a quick comparison of the living environment.
Hoofdplaat telt in 2025 ongeveer 702 inwoners.
De gemiddelde WOZ-waarde in Hoofdplaat is in 2025 circa € 274.647.
Het gemiddelde inkomen per inwoner in Hoofdplaat ligt rond € 31.439 per jaar.
Voor het huidige jaar gaat het om ongeveer 11 geregistreerde misdrijven. Gebruik deze cijfers als indicatie en vergelijk trends per periode.
In Hoofdplaat komt vooral "Vrijstaande woningen" veel voor, met ongeveer 182 woningen.