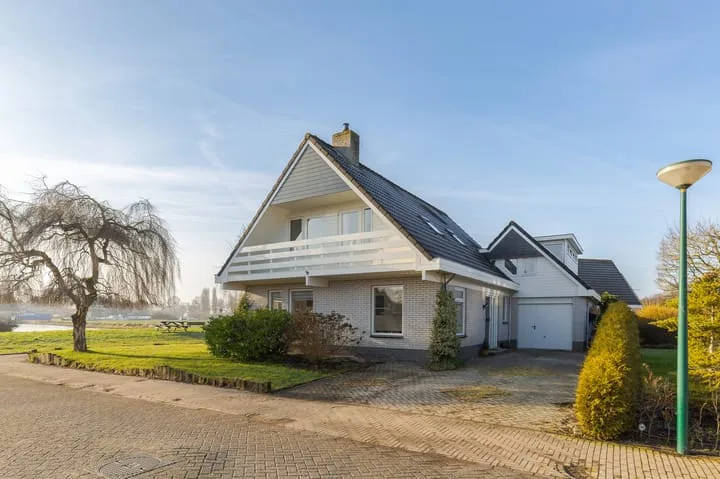
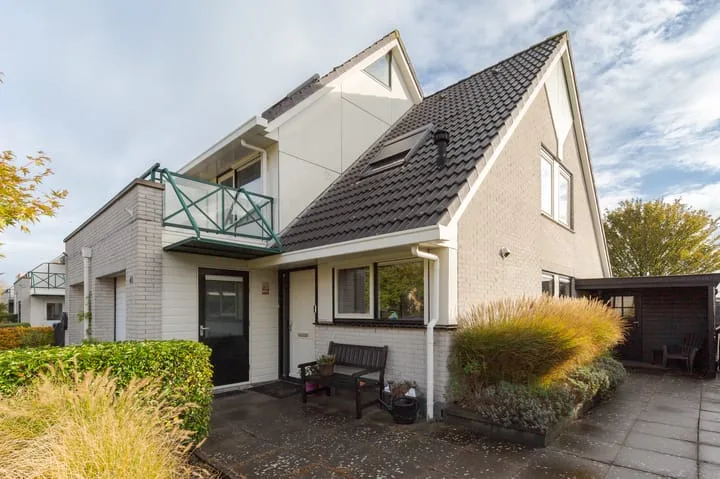
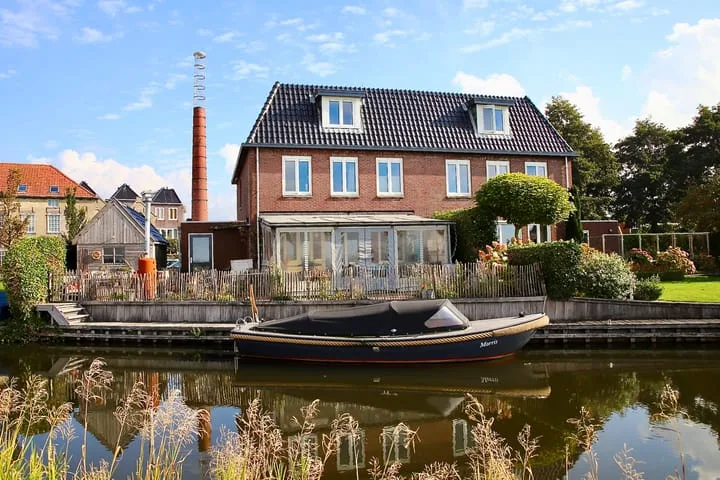
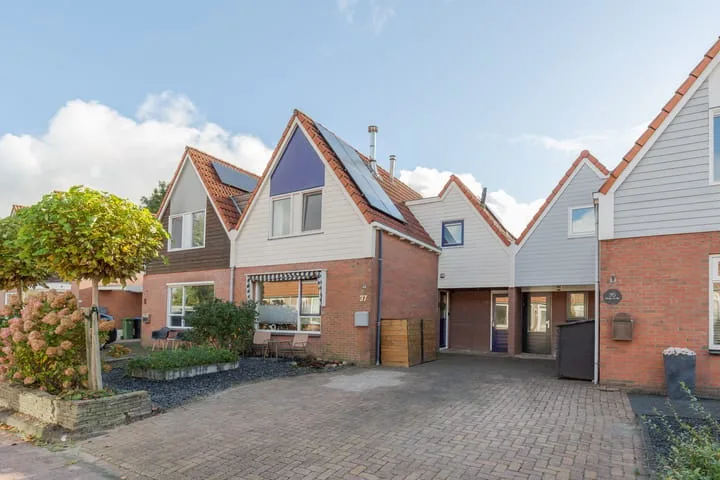
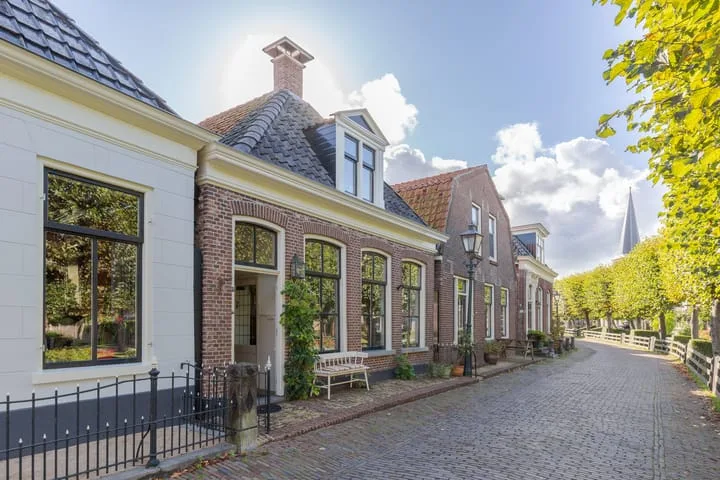
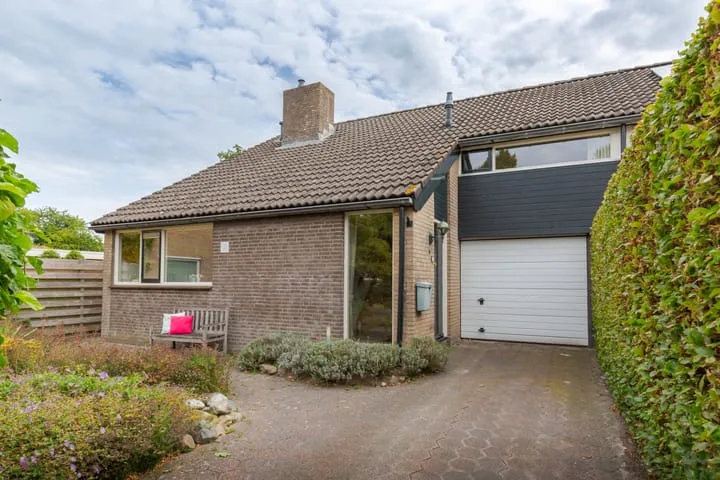
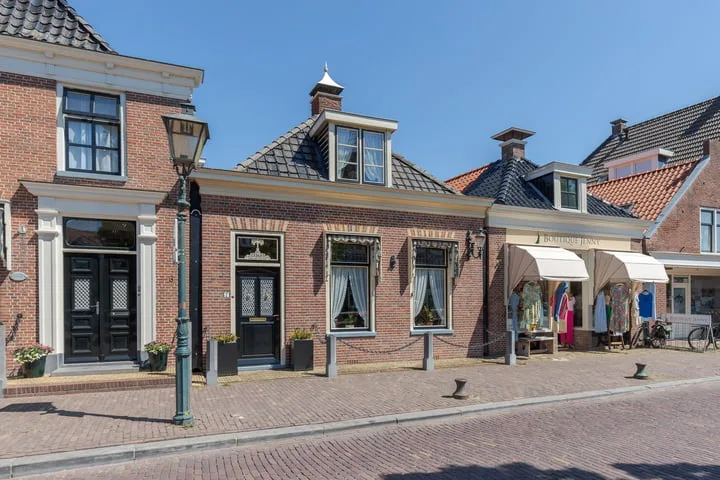
- Sold
De Fjûrslach 10
8651CE IJlst
€ 529.000 k.k.
€ 3.225/m²
- Living area
- 164 m²
- Land area
- 599 m²
- Bedrooms
- 4
View 24 sold houses in IJlst
Type to search. Use arrow down and arrow up to navigate through results and press Enter to open.
Hidden search suggestions.
Compare sold homes in IJlst or view the current offering in this location directly.
On this page you will find recently sold homes in IJlst. Use this overview to better estimate selling prices, popular neighborhoods, and the local housing supply before you choose a real estate agent. Also view the current housing supply with 39 houses in IJlst.
8651CE IJlst
€ 529.000 k.k.
€ 3.225/m²
8651CX IJlst
€ 650.000 k.k.
€ 3.915/m²
8651CL IJlst
€ 325.000 k.k.
€ 2.500/m²
8651EL IJlst
€ 219.000 k.k.
€ 4.055/m²
8651ES IJlst
€ 550.000 k.k.
€ 3.741/m²
8651AV IJlst
€ 335.000 k.k.
€ 2.576/m²
8651BM IJlst
€ 289.000 k.k.
€ 3.360/m²
8651CS IJlst
€ 775.000 k.k.
€ 3.538/m²
8651HG IJlst
€ 375.000 k.k.
€ 2.777/m²
8651HB IJlst
€ 489.000 k.k.
€ 3.912/m²
8651EG IJlst
€ 675.000 k.k.
€ 3.590/m²
8651HB IJlst
€ 825.000 k.k.
€ 4.508/m²
8651DA IJlst
€ 365.000 k.k.
€ 3.016/m²
8651EC IJlst
€ 495.000 k.k.
€ 3.837/m²
8651AV IJlst
€ 439.500 k.k.
€ 3.304/m²
8651AE IJlst
€ 565.000 k.k.
€ 4.154/m²
8651CH IJlst
€ 425.000 k.k.
€ 3.320/m²
8651HA IJlst
€ 450.000 k.k.
€ 0/m²
8651HD IJlst
€ 370.000 k.k.
€ 2.824/m²
8651CN IJlst
€ 325.000 k.k.
€ 2.731/m²
8651EK IJlst
€ 435.000 k.k.
€ 3.425/m²
8651BL IJlst
€ 226.000 k.k.
€ 3.054/m²
8651DD IJlst
€ 775.000 k.k.
€ 4.078/m²
8651EB IJlst
€ 295.000 k.k.
€ 2.565/m²
Get free quotes from realtors with local market knowledge in IJlst.
Selling a home in IJlst? Compare real estate agents who know the local housing market. Also check out all real estate agents in IJlst or the top 10 real estate agents in IJlst for extra context for your choice.
By comparing brokers and requesting quotes
Short answers about housing prices, sold homes and comparing real estate agents in IJlst.
The costs of a real estate agent in IJlst vary per office, property type and sales approach. Therefore, compare multiple quotes and also look at the real estate agents in IJlst to better compare rates, presentation and local experience.
On this page we currently show 24 sold houses in IJlst from our selection. This helps you to better assess recent transactions and the local housing market.
Verkochte woningen in IJlst geven inzicht in vraagprijzen, woningtypes en buurten waar recent transacties hebben plaatsgevonden. Vergelijk dit ook met het actuele woningaanbod in IJlst om de markt beter te duiden.
Je kunt verkochte woningen gebruiken als eerste marktindicatie, maar een lokale makelaar kan beter rekening houden met afwerking, ligging, onderhoud en actuele vraag in IJlst.
Vergelijk makelaars in IJlst op lokale verkoopervaring, reviews, verwachte opbrengst, courtage en marketingaanpak. De top 10 makelaars in IJlst helpt om snel sterke kantoren te ontdekken.
View current location data on residents, WOZ development, housing stock, energy consumption, business activity and safety in IJlst. In 2025 were there 2.905 residents. The average WOZ value in 2025 is EUR 341.000.
These figures help to better assess and compare the housing stock in IJlst with recent sold homes. Orient yourself then on suitable top real estate agents in IJlst for sales advice in this region.
Residents
2.905
Last year: 2025
Average WOZ
EUR 341.000
Last year: 2025
Average income per person.
EUR 31.700
Source: AllNumbers
Crimes (current year)
66
Total registered
| Year | Residents |
|---|---|
| 2021 | 3.010 |
| 2022 | 2.995 |
| 2023 | 3.050 |
| 2024 | 3.020 |
| 2025 | 2.905 |
| Year | Average WOZ |
|---|---|
| 2021 | EUR 245.000 |
| 2022 | EUR 267.000 |
| 2023 | EUR 305.000 |
| 2024 | EUR 318.000 |
| 2025 | EUR 341.000 |
Hoger
680
Praktisch
440
Middelbaar
1.000
Europa
100
Nederland
2.685
Buiten Europa
120
Label C
379
Label B
297
Label A
241
Label D
165
Label G
145
Label E
67
Label F
67
Label A++
15
Label A+
9
Label A+++
3
Label A++++
1
Label A+++++
0
| Year | Gas (m3) | Electricity (kWh) |
|---|---|---|
| 2020 | 1.340 | 2.670 |
| 2021 | 1.510 | 2.740 |
| 2022 | 1.160 | 2.560 |
| 2023 | 970 | 2.460 |
| 2024 | 950 | 2.560 |
Hoekwoning
Gas: 950 • Electricity: 2.240
Huurwoning
Gas: 780 • Electricity: 1.910
Koopwoning
Gas: 1.050 • Electricity: 2.690
Appartement
Gas: 670 • Electricity: 2.250
Tussenwoning
Gas: 850 • Electricity: 2.030
Vrijstaande woning
Gas: 1.220 • Electricity: 3.330
Twee-onder-één-kap woning
Gas: 1.010 • Electricity: 2.460
Total number of company establishments: 375
| Period | Crimes |
|---|---|
| jan 2025 | 12 |
| jan 2026 | 5 |
| jul 2025 | 3 |
| jun 2025 | 3 |
| mei 2025 | 7 |
| mrt 2025 | 5 |
| nov 2024 | 5 |
| nov 2025 | 5 |
| okt 2024 | 7 |
| okt 2025 | 4 |
| sep 2024 | 3 |
| sep 2025 | 3 |
These figures give an indicative picture of safety trends in the living environment of IJlst.
Short answers based on current local statistics, handy for a quick comparison of the living environment.
IJlst telt in 2025 ongeveer 2.905 inwoners.
De gemiddelde WOZ-waarde in IJlst is in 2025 circa € 341.000.
Het gemiddelde inkomen per inwoner in IJlst ligt rond € 31.700 per jaar.
Voor het huidige jaar gaat het om ongeveer 66 geregistreerde misdrijven. Gebruik deze cijfers als indicatie en vergelijk trends per periode.
In IJlst komt vooral "Tussenwoningen" veel voor, met ongeveer 467 woningen.