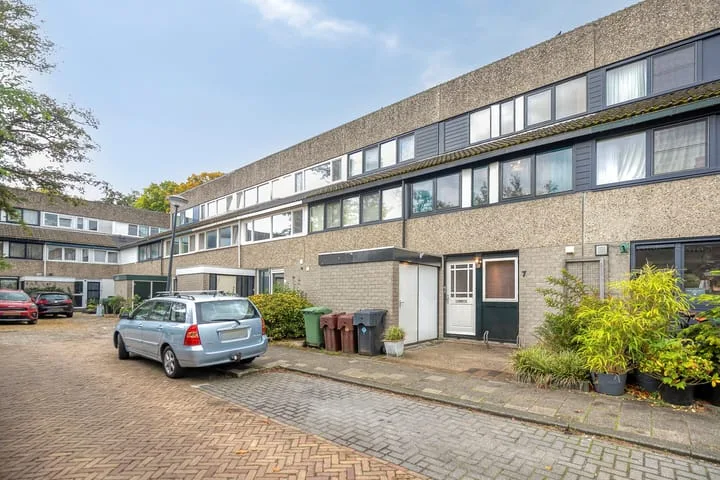
- Sold
Evenementenlaan 27
2316LC Leiden
€ 775.000 k.k.
€ 5.065/m²
- Living area
- 153 m²
- Land area
- 101 m²
- Bedrooms
- 4
View 1.353 sold houses in Leiden
Type to search. Use arrow down and arrow up to navigate through results and press Enter to open.
Hidden search suggestions.
Compare sold homes in Leiden or view the current offering in this location directly.
On this page you will find recently sold homes in Leiden. Use this overview to better estimate selling prices, popular neighborhoods, and the local housing supply before you choose a real estate agent. Also view the current housing supply with 1.842 houses in Leiden.
2316LC Leiden
€ 775.000 k.k.
€ 5.065/m²
2316NN Leiden
€ 400.000 k.k.
€ 5.633/m²
2312TL Leiden
€ 495.000 k.k.
€ 5.963/m²
2311SL Leiden
€ 315.000 k.k.
€ 6.562/m²
2312XJ Leiden
€ 215.000 k.k.
€ 7.413/m²
2332BL Leiden
€ 365.000 k.k.
€ 6.186/m²
2311SL Leiden
€ 395.000 k.k.
€ 6.475/m²
2321XA Leiden
€ 550.000 k.k.
€ 5.851/m²
2311SL Leiden
€ 325.000 k.k.
€ 6.770/m²
2317EH Leiden
Price upon request
2312PZ Leiden
€ 535.000 k.k.
€ 7.133/m²
2316AW Leiden
€ 299.000 k.k.
€ 6.795/m²
2313GT Leiden
€ 475.000 k.k.
€ 4.059/m²
2313TM Leiden
€ 725.000 k.k.
€ 6.651/m²
2331NL Leiden
€ 500.000 k.k.
€ 4.716/m²
2312RC Leiden
€ 295.000 k.k.
€ 6.555/m²
2312KW Leiden
€ 285.000 k.k.
€ 5.000/m²
2315HJ Leiden
€ 375.000 k.k.
€ 5.952/m²
2315BR Leiden
€ 445.000 k.k.
€ 5.779/m²
2321HZ Leiden
€ 600.000 k.k.
€ 5.714/m²
2312PG Leiden
€ 315.000 k.k.
€ 8.076/m²
2311TK Leiden
€ 325.000 k.k.
€ 5.241/m²
2316NA Leiden
€ 869.000 k.k.
€ 7.828/m²
2312CB Leiden
€ 335.000 k.k.
€ 8.170/m²
2312CB Leiden
€ 299.000 k.k.
€ 7.868/m²
2311CS Leiden
€ 189.000 k.k.
€ 6.750/m²
2313PP Leiden
€ 325.000 k.k.
€ 6.770/m²
2321WW Leiden
€ 939.000 k.k.
€ 6.177/m²
Get free quotes from realtors with local market knowledge in Leiden.
Selling a home in Leiden? Compare real estate agents who know the local housing market. Also check out all real estate agents in Leiden or the top 10 real estate agents in Leiden for extra context for your choice.
By comparing brokers and requesting quotes
Short answers about housing prices, sold homes and comparing real estate agents in Leiden.
The costs of a real estate agent in Leiden vary per office, property type and sales approach. Therefore, compare multiple quotes and also look at the real estate agents in Leiden to better compare rates, presentation and local experience.
On this page we currently show 1.353 sold houses in Leiden from our selection. This helps you to better assess recent transactions and the local housing market.
Houses sold in Leiden give insight into asking prices, house types and neighborhoods where recent transactions have taken place. Compare this also with the current housing stock in Leiden to better understand the market.
You can use sold homes as a first market indication, but a local real estate agent can better take into account finishing, location, maintenance and current demand in Leiden.
Compare realtors in Leiden on local sales experience, reviews, expected yield, commission and marketing approach. The top 10 realtors in Leiden helps to quickly discover strong offices.
View current location data on residents, WOZ development, housing stock, energy consumption, business activity and safety in Leiden. In 2026 were there 130.302 residents. The average WOZ value in 2025 is EUR 409.000.
These figures help to better assess and compare the housing stock in Leiden with recent sold homes. Orient yourself then on suitable top real estate agents in Leiden for sales advice in this region.
Residents
130.302
Last year: 2026
Average WOZ
EUR 409.000
Last year: 2025
Average income per person.
EUR 36.400
Source: AllNumbers
Crimes (current year)
7.466
Total registered
| Year | Residents |
|---|---|
| 2022 | 125.074 |
| 2023 | 127.089 |
| 2024 | 130.108 |
| 2025 | 130.638 |
| 2026 | 130.302 |
| Year | Average WOZ |
|---|---|
| 2021 | EUR 313.000 |
| 2022 | EUR 344.000 |
| 2023 | EUR 389.000 |
| 2024 | EUR 393.000 |
| 2025 | EUR 409.000 |
Hoger
50
Praktisch
18
Middelbaar
32
Europa
17.459
Nederland
81.628
Buiten Europa
31.551
Label A
15.708
Label C
15.071
Label B
7.703
Label F
6.179
Label G
5.944
Label E
5.634
Label D
5.231
Label A+
2.691
Label A+++
2.324
Label A++
1.109
Label A++++
74
Label A+++++
5
| Year | Gas (m3) | Electricity (kWh) |
|---|---|---|
| 2020 | 820 | 2.360 |
| 2021 | 920 | 2.400 |
| 2022 | 710 | 2.220 |
| 2023 | 610 | 2.070 |
| 2024 | 590 | 2.060 |
Hoekwoning
Gas: 920 • Electricity: 2.620
Huurwoning
Gas: 520 • Electricity: 1.820
Koopwoning
Gas: 750 • Electricity: 2.420
Appartement
Gas: 470 • Electricity: 1.780
Tussenwoning
Gas: 770 • Electricity: 2.430
Vrijstaande woning
Gas: 1.640 • Electricity: 4.070
Twee-onder-één-kap woning
Gas: 1.250 • Electricity: 3.110
Total number of company establishments: 17.215
| Period | Crimes |
|---|---|
| jan 2025 | 518 |
| jan 2026 | 579 |
| jul 2025 | 697 |
| jun 2025 | 621 |
| mei 2025 | 702 |
| mrt 2025 | 593 |
| nov 2024 | 585 |
| nov 2025 | 669 |
| okt 2024 | 667 |
| okt 2025 | 679 |
| sep 2024 | 605 |
| sep 2025 | 655 |
These figures give an indicative picture of safety trends in the living environment of Leiden.
Short answers based on current local statistics, handy for a quick comparison of the living environment.
Leiden telt in 2026 ongeveer 130.302 inwoners.
De gemiddelde WOZ-waarde in Leiden is in 2025 circa € 409.000.
Het gemiddelde inkomen per inwoner in Leiden ligt rond € 36.400 per jaar.
Voor het huidige jaar gaat het om ongeveer 7.466 geregistreerde misdrijven. Gebruik deze cijfers als indicatie en vergelijk trends per periode.
In Leiden komt vooral "Appartementen" veel voor, met ongeveer 43.713 woningen.