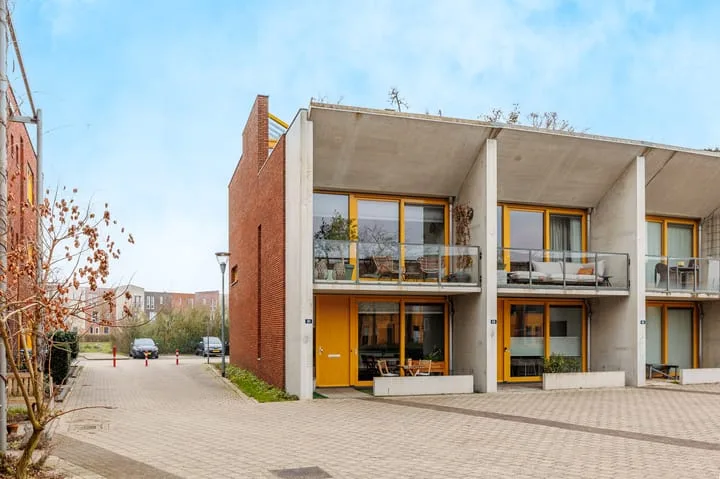
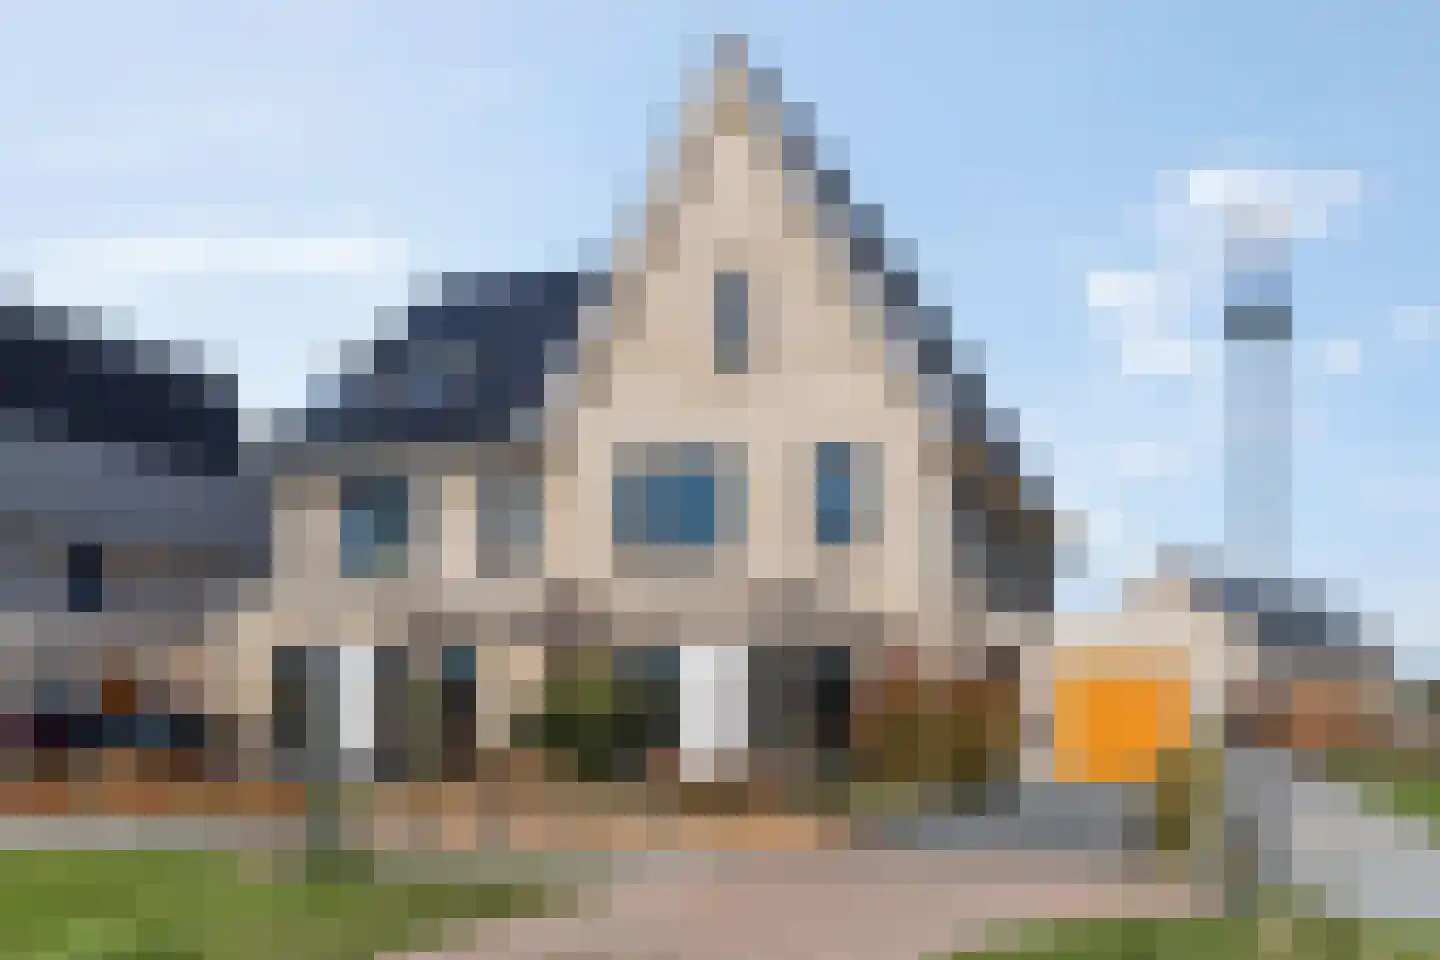
- Sold
Griftdijk Noord 8
6663AB Lent
€ 895.000 k.k.
€ 5.234/m²
- Living area
- 171 m²
- Land area
- 299 m²
- Bedrooms
- 4
View 101 sold houses in Lent
Type to search. Use arrow down and arrow up to navigate through results and press Enter to open.
Hidden search suggestions.
Compare sold homes in Lent or view the current offering in this location directly.
On this page you will find recently sold homes in Lent. Use this overview to better estimate selling prices, popular neighborhoods, and the local housing supply before you choose a real estate agent. Also view the current housing supply with 121 houses in Lent.
6663AB Lent
€ 895.000 k.k.
€ 5.234/m²
6663PJ Lent
€ 695.000 k.k.
€ 4.542/m²
6663NV Lent
€ 575.000 k.k.
€ 4.457/m²
6663MK Lent
€ 635.000 k.k.
€ 4.070/m²
6663PG Lent
€ 669.000 k.k.
€ 4.812/m²
6663NT Lent
€ 600.000 k.k.
€ 4.545/m²
6663ML Lent
€ 565.000 k.k.
€ 5.330/m²
6663NS Lent
€ 610.000 k.k.
€ 4.452/m²
6663CE Lent
€ 845.000 k.k.
€ 4.062/m²
6663PA Lent
€ 539.000 k.k.
€ 4.900/m²
6663PA Lent
€ 519.000 k.k.
€ 4.718/m²
6663GS Lent
€ 469.000 k.k.
€ 5.329/m²
6663RK Lent
€ 365.000 k.k.
€ 6.186/m²
6663GR Lent
€ 550.000 k.k.
€ 3.666/m²
6663GP Lent
€ 559.000 k.k.
€ 4.080/m²
6663NT Lent
€ 629.000 k.k.
€ 5.072/m²
6663PA Lent
Price upon request
6663NA Lent
€ 385.000 k.k.
€ 4.935/m²
6663TC Lent
€ 675.000 k.k.
€ 5.037/m²
6663DS Lent
€ 475.000 k.k.
€ 3.991/m²
6663RK Lent
€ 390.000 k.k.
€ 6.964/m²
6663HT Lent
€ 629.000 k.k.
€ 4.801/m²
6663CZ Lent
Price upon request
6663RS Lent
€ 669.000 k.k.
€ 4.551/m²
6663JC Lent
€ 598.000 k.k.
€ 4.271/m²
6663HN Lent
€ 515.000 k.k.
€ 5.421/m²
6663HW Lent
€ 395.000 k.k.
€ 5.197/m²
6663CM Lent
€ 285.000 k.k.
€ 6.951/m²
Bekijk recente verkopen en ontvang gratis offertes van lokale verkoopmakelaars in Lent.
Recent verkocht in Lent? Lees de verkoopgerichte gids huis verkopen in Lent, vergelijk verkoopmakelaars in Lent of bekijk de beste verkoopmakelaars in Lent voor referentie bij jouw keuze.
Makelaars maken scherpere voorstellen als ze weten dat je vergelijkt — vraag offertes aan voor verkoop of aankoop.
Short answers about housing prices, sold homes and comparing real estate agents in Lent.
The costs of a real estate agent in Lent vary per office, property type and sales approach. Therefore, compare multiple quotes and also look at the real estate agents in Lent to better compare rates, presentation and local experience.
On this page we currently show 101 sold houses in Lent from our selection. This helps you to better assess recent transactions and the local housing market.
Houses sold in Lent give insight into asking prices, house types and neighborhoods where recent transactions have taken place. Compare this also with the current housing stock in Lent to better understand the market.
Je kunt verkochte woningen gebruiken als eerste marktindicatie, maar een lokale makelaar kan beter rekening houden met afwerking, ligging, onderhoud en actuele vraag in Lent. Plan de volgende stap via de gids huis verkopen in Lent.
Vergelijk makelaars in Lent op lokale verkoopervaring, reviews, verwachte opbrengst, courtage en marketingaanpak. Bekijk verkoopmakelaars in Lent of de top 10 makelaars in Lent om snel sterke kantoren te ontdekken.
View current location data on residents, WOZ development, housing stock, energy consumption, business activity and safety in Lent. In 2026 were there 16.782 residents. The average WOZ value in 2025 is EUR 489.000.
These figures help to better assess and compare the housing stock in Lent with recent sold homes. Orient yourself then on suitable top real estate agents in Lent for sales advice in this region.
Residents
16.782
Last year: 2026
Average WOZ
EUR 489.000
Last year: 2025
Average income per person.
EUR 37.000
Source: AllNumbers
Crimes (current year)
531
Total registered
| Year | Residents |
|---|---|
| 2021 | 11.630 |
| 2022 | 12.355 |
| 2023 | 13.400 |
| 2024 | 14.530 |
| 2025 | 15.975 |
| 2026 | 16.782 |
| Year | Average WOZ |
|---|---|
| 2021 | EUR 352.000 |
| 2022 | EUR 395.000 |
| 2023 | EUR 461.000 |
| 2024 | EUR 458.000 |
| 2025 | EUR 489.000 |
Hoger
6.680
Praktisch
1.640
Middelbaar
2.930
Europa
1.040
Nederland
12.410
Buiten Europa
2.520
Label A
3.183
Label A++
1.219
Label A+
909
Label A+++
813
Label B
343
Label C
333
Label G
121
Label F
103
Label D
101
Label E
61
Label A++++
12
Label A+++++
0
| Year | Gas (m3) | Electricity (kWh) |
|---|---|---|
| 2020 | 460 | 2.870 |
| 2021 | 490 | 2.900 |
| 2022 | 360 | 2.680 |
| 2023 | 270 | 2.500 |
| 2024 | 220 | 2.500 |
Hoekwoning
Gas: 220 • Electricity: 2.550
Huurwoning
Gas: 200 • Electricity: 1.900
Koopwoning
Gas: 320 • Electricity: 2.850
Appartement
Gas: 140 • Electricity: 1.690
Tussenwoning
Gas: 130 • Electricity: 2.300
Vrijstaande woning
Gas: 1.000 • Electricity: 4.180
Twee-onder-één-kap woning
Gas: 580 • Electricity: 3.160
Total number of company establishments: 1.965
| Period | Crimes |
|---|---|
| jan 2026 | 33 |
| jul 2025 | 83 |
| jun 2025 | 37 |
| mei 2025 | 37 |
| mrt 2025 | 51 |
| mrt 2026 | 52 |
| nov 2024 | 24 |
| nov 2025 | 37 |
| okt 2024 | 34 |
| okt 2025 | 50 |
| sep 2024 | 38 |
| sep 2025 | 54 |
These figures give an indicative picture of safety trends in the living environment of Lent.
Short answers based on current local statistics, handy for a quick comparison of the living environment.
Lent telt in 2026 ongeveer 16.782 inwoners.
De gemiddelde WOZ-waarde in Lent is in 2025 circa € 489.000.
Het gemiddelde inkomen per inwoner in Lent ligt rond € 37.000 per jaar.
Voor het huidige jaar gaat het om ongeveer 531 geregistreerde misdrijven. Gebruik deze cijfers als indicatie en vergelijk trends per periode.
In Lent komt vooral "Tussenwoningen" veel voor, met ongeveer 2.957 woningen.