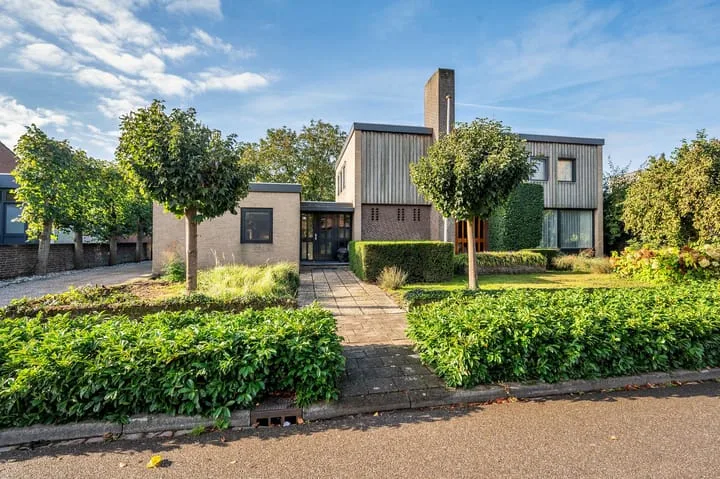
Houses sold in Lottum

View 21 sold houses in Lottum

Connected to: Vastgoed Nederland NVM Makelaars

On this page you will find recently sold homes in Lottum. Use this overview to better estimate selling prices, popular neighborhoods, and the local housing supply before you choose a real estate agent. Also view the current housing supply with 25 houses in Lottum.

Selection

Search and filter homes

Set your preferences and discover homes that suit you.

Total supply 243.325
Filters

Set price, area and other characteristics. Adjust a filter or click on Show homes. Location changes directly above.

Reset filters

You search for

  • Place Lottum
  • Status Sold

Huis verkopen in Lottum? Vergelijk verkoopmakelaars

Bekijk recente verkopen en ontvang gratis offertes van lokale makelaars. Vergelijk meer dan 16 makelaars in Lottum.

Free request a quote

  • Quotes in Lottum
  • Non-binding
  • Personal
  • Compare free rates

Zelf je woning verkopen in Lottum? Vergelijk verkoopmakelaars in Lottum of bekijk de beste verkoopmakelaars in Lottum als referentie bij jouw keuze.

Vergelijk meerdere offertes

Makelaars maken scherpere voorstellen als ze weten dat je vergelijkt — vraag offertes aan voor verkoop of aankoop.

Frequently asked questions about sold homes in Lottum

Short answers about housing prices, sold homes and comparing real estate agents in Lottum.

Residential and neighborhood statistics in Lottum

View current location data on residents, WOZ development, housing stock, energy consumption, business activity and safety in Lottum. In 2025 were there 1.995 residents. The average WOZ value in 2025 is EUR 377.000.

These figures help to better assess and compare the housing stock in Lottum with recent sold homes. Orient yourself then on suitable top real estate agents in Lottum for sales advice in this region.

Residents

1.995

Last year: 2025

Average WOZ

EUR 377.000

Last year: 2025

Average income per person.

EUR 31.700

Source: AllNumbers

Crimes (current year)

32

Total registered

Demographics and WOZ development

Inhabitants per year

Inhabitants per year in Lottum
Year Residents
2021 1.990
2022 2.000
2023 2.010
2024 2.000
2025 1.995

Annual WOZ value

WOZ value per year in Lottum
Year Average WOZ
2021 EUR 287.000
2022 EUR 303.000
2023 EUR 333.000
2024 EUR 350.000
2025 EUR 377.000

Composition of residents

Age build-up

65+: 505 0-15: 285 15-25: 190 25-45: 425 45-65: 595

Education level

Hoger

350

Praktisch

400

Middelbaar

720

Origin of residents (2025)

Europa

195

Nederland

1.760

Buiten Europa

45

Housing stock and construction periods

Types of homes

Hoekwoningen 79
Appartementen 37
Tussenwoningen 100
Vrijstaande woningen 424
Twee-onder-één-kap woningen 282

Construction period of buildings

Voor 1700 4
1700 tot 1900 52
1900 tot 1925 48
1925 tot 1950 102
1950 tot 1970 257
1970 tot 1980 156
1980 tot 1990 83
1990 tot 2000 104
2000 tot 2010 65
2010 tot 2020 23
2020 en later 93

Energy and sustainability

Energy label distribution

Label C

213

Label D

133

Label B

123

Label G

108

Label A

101

Label F

95

Label E

33

Label A++++

27

Label A+++

23

Label A+

6

Label A++

0

Label A+++++

0

Average energy consumption per year

Average energy consumption per year in Lottum
Year Gas (m3) Electricity (kWh)
2020 1.700 3.670
2021 1.910 3.720
2022 1.490 3.520
2023 1.230 3.390
2024 1.190 3.430

Consumption per house type

Hoekwoning

Gas: 1.070 • Electricity: 2.800

Huurwoning

Gas: 1.050 • Electricity: 2.450

Koopwoning

Gas: 1.260 • Electricity: 3.550

Appartement

Gas: 830 • Electricity: 2.000

Tussenwoning

Gas: 1.000 • Electricity: 2.920

Vrijstaande woning

Gas: 1.430 • Electricity: 4.080

Twee-onder-één-kap woning

Gas: 1.080 • Electricity: 2.830

Business activity in Lottum (2025)

Handel en HORECA 45
Nijverheid en energie 40
Zakelijke dienstverlening 65
Overheid, onderwijs en zorg 40
Landbouw, bosbouw en visserij 65
Vervoer, informatie en communicatie 20
Financiele diensten en onroerendgoed 15
Cultuur, recreatie en overige diensten 30

Total number of company establishments: 310

Recent crime statistics

Recent crime statistics in Lottum
Period Crimes
jan 2025 2
jan 2026 1
jul 2025 4
jun 2025 3
mei 2025 2
mrt 2025 5
nov 2024 7
nov 2025 3
okt 2024 8
okt 2025 1
sep 2024 2
sep 2025 1

These figures give an indicative picture of safety trends in the living environment of Lottum.

Frequently asked questions about living in Lottum

Short answers based on current local statistics, handy for a quick comparison of the living environment.

Hoeveel inwoners heeft Lottum?

Lottum telt in 2025 ongeveer 1.995 inwoners.

Wat is de gemiddelde WOZ-waarde in Lottum?

De gemiddelde WOZ-waarde in Lottum is in 2025 circa € 377.000.

Wat is het gemiddelde inkomen per inwoner in Lottum?

Het gemiddelde inkomen per inwoner in Lottum ligt rond € 31.700 per jaar.

Hoe veilig is wonen in Lottum?

Voor het huidige jaar gaat het om ongeveer 32 geregistreerde misdrijven. Gebruik deze cijfers als indicatie en vergelijk trends per periode.

Welke woningtypen komen het meest voor in Lottum?

In Lottum komt vooral "Vrijstaande woningen" veel voor, met ongeveer 424 woningen.

Receive free, non-binding quotes

Compare multiple real estate agents and choose the best match.