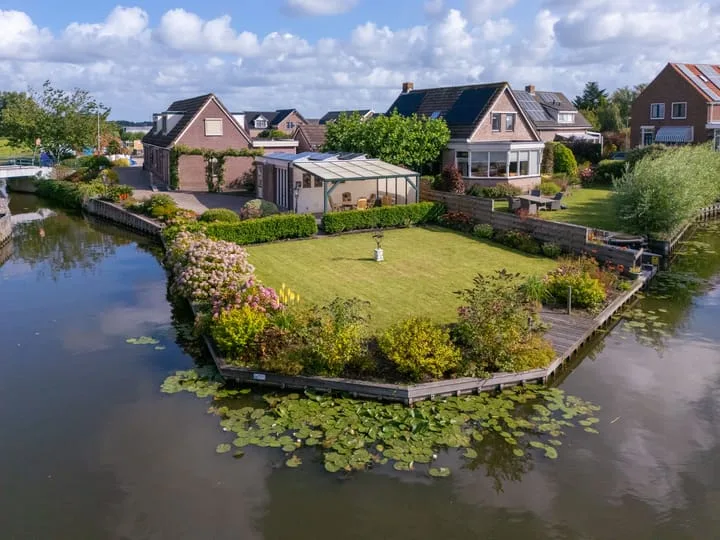
Houses sold in Lutjebroek

View 22 sold houses in Lutjebroek

Connected to: Vastgoed Nederland NVM Makelaars

On this page you will find recently sold homes in Lutjebroek. Use this overview to better estimate selling prices, popular neighborhoods, and the local housing supply before you choose a real estate agent. Also view the current housing supply with 32 houses in Lutjebroek.

Selection

Search and filter homes

Set your preferences and discover homes that suit you.

Total supply 242.379
Filters

Set price, area and other characteristics. Adjust a filter or click on Show homes. Location changes directly above.

Reset filters

You search for

  • Place Lutjebroek
  • Status Sold

Huis verkopen in Lutjebroek? Vergelijk verkoopmakelaars

Bekijk recente verkopen en ontvang gratis offertes van lokale makelaars. Vergelijk meer dan 23 makelaars in Lutjebroek.

Free request a quote

  • Quotes in Lutjebroek
  • Non-binding
  • Personal
  • Compare free rates

Zelf je woning verkopen in Lutjebroek? Vergelijk verkoopmakelaars in Lutjebroek of bekijk de beste verkoopmakelaars in Lutjebroek als referentie bij jouw keuze.

Vergelijk meerdere offertes

Makelaars maken scherpere voorstellen als ze weten dat je vergelijkt — vraag offertes aan voor verkoop of aankoop.

Frequently asked questions about sold homes in Lutjebroek

Short answers about housing prices, sold homes and comparing real estate agents in Lutjebroek.

Residential and neighborhood statistics in Lutjebroek

View current location data on residents, WOZ development, housing stock, energy consumption, business activity and safety in Lutjebroek. In 2025 were there 2.210 residents. The average WOZ value in 2025 is EUR 374.984.

These figures help to better assess and compare the housing stock in Lutjebroek with recent sold homes. Orient yourself then on suitable top real estate agents in Lutjebroek for sales advice in this region.

Residents

2.210

Last year: 2025

Average WOZ

EUR 374.984

Last year: 2025

Average income per person.

EUR 30.520

Source: AllNumbers

Crimes (current year)

30

Total registered

Demographics and WOZ development

Inhabitants per year

Inhabitants per year in Lutjebroek
Year Residents
2021 2.240
2022 2.255
2023 2.270
2024 2.260
2025 2.210

Annual WOZ value

WOZ value per year in Lutjebroek
Year Average WOZ
2021 EUR 267.901
2022 EUR 300.913
2023 EUR 355.450
2024 EUR 367.212
2025 EUR 374.984

Composition of residents

Age build-up

65+: 615 0-15: 330 15-25: 225 25-45: 470 45-65: 560

Education level

Hoger

260

Praktisch

590

Middelbaar

660

Origin of residents (2025)

Europa

135

Nederland

1.995

Buiten Europa

80

Housing stock and construction periods

Types of homes

Hoekwoningen 133
Appartementen 81
Tussenwoningen 207
Vrijstaande woningen 380
Twee-onder-één-kap woningen 129

Construction period of buildings

Voor 1700 0
1700 tot 1900 19
1900 tot 1925 127
1925 tot 1950 83
1950 tot 1970 246
1970 tot 1980 68
1980 tot 1990 141
1990 tot 2000 66
2000 tot 2010 72
2010 tot 2020 35
2020 en later 19

Energy and sustainability

Energy label distribution

Label C

243

Label A

143

Label G

137

Label B

111

Label D

91

Label F

74

Label E

31

Label A+

19

Label A++

17

Label A+++

9

Label A++++

1

Label A+++++

0

Average energy consumption per year

Average energy consumption per year in Lutjebroek
Year Gas (m3) Electricity (kWh)
2020 1.366 3.063
2021 1.598 3.183
2022 1.266 2.956
2023 1.059 2.750
2024 1.013 2.826

Consumption per house type

Hoekwoning

Gas: 923 • Electricity: 2.146

Huurwoning

Gas: 806 • Electricity: 1.874

Koopwoning

Gas: 1.109 • Electricity: 2.969

Appartement

Gas: 583 • Electricity: 1.729

Tussenwoning

Gas: 864 • Electricity: 2.127

Vrijstaande woning

Gas: 1.244 • Electricity: 3.332

Twee-onder-één-kap woning

Gas: 1.010 • Electricity: 2.661

Business activity in Lutjebroek (2025)

Handel en HORECA 30
Nijverheid en energie 75
Zakelijke dienstverlening 45
Overheid, onderwijs en zorg 20
Landbouw, bosbouw en visserij 25
Vervoer, informatie en communicatie 5
Financiele diensten en onroerendgoed 15
Cultuur, recreatie en overige diensten 20

Total number of company establishments: 275

Recent crime statistics

Recent crime statistics in Lutjebroek
Period Crimes
jan 2025 6
jan 2026 1
jul 2025 5
jun 2025 3
mei 2025 4
mrt 2025 1
nov 2024 2
nov 2025 0
okt 2024 5
okt 2025 1
sep 2024 6
sep 2025 3

These figures give an indicative picture of safety trends in the living environment of Lutjebroek.

Frequently asked questions about living in Lutjebroek

Short answers based on current local statistics, handy for a quick comparison of the living environment.

Hoeveel inwoners heeft Lutjebroek?

Lutjebroek telt in 2025 ongeveer 2.210 inwoners.

Wat is de gemiddelde WOZ-waarde in Lutjebroek?

De gemiddelde WOZ-waarde in Lutjebroek is in 2025 circa € 374.984.

Wat is het gemiddelde inkomen per inwoner in Lutjebroek?

Het gemiddelde inkomen per inwoner in Lutjebroek ligt rond € 30.520 per jaar.

Hoe veilig is wonen in Lutjebroek?

Voor het huidige jaar gaat het om ongeveer 30 geregistreerde misdrijven. Gebruik deze cijfers als indicatie en vergelijk trends per periode.

Welke woningtypen komen het meest voor in Lutjebroek?

In Lutjebroek komt vooral "Vrijstaande woningen" veel voor, met ongeveer 380 woningen.

Receive free, non-binding quotes

Compare multiple real estate agents and choose the best match.