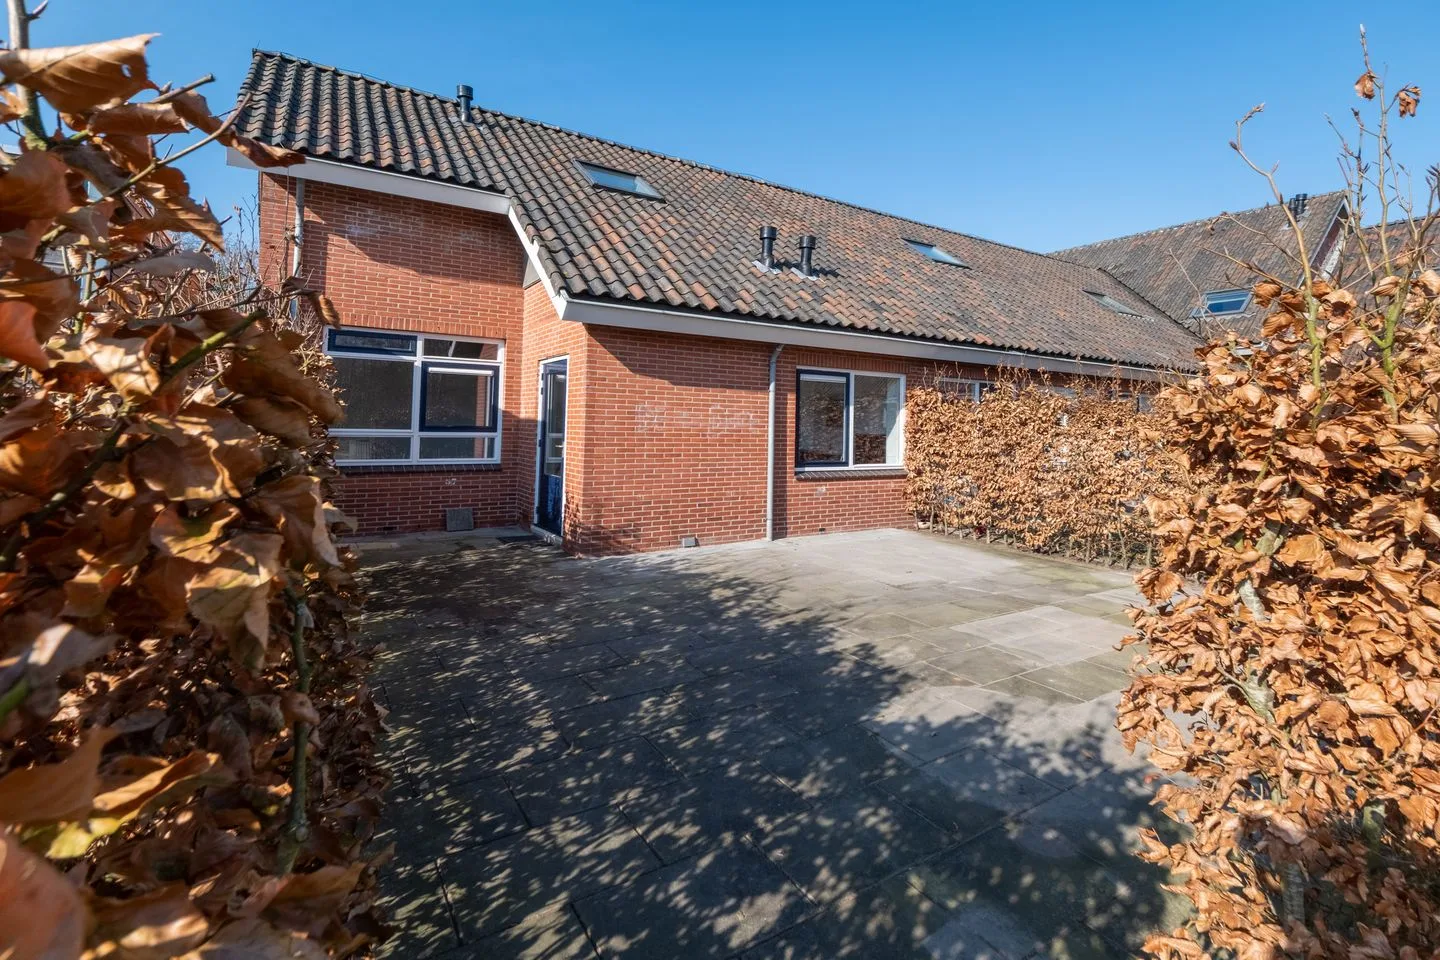
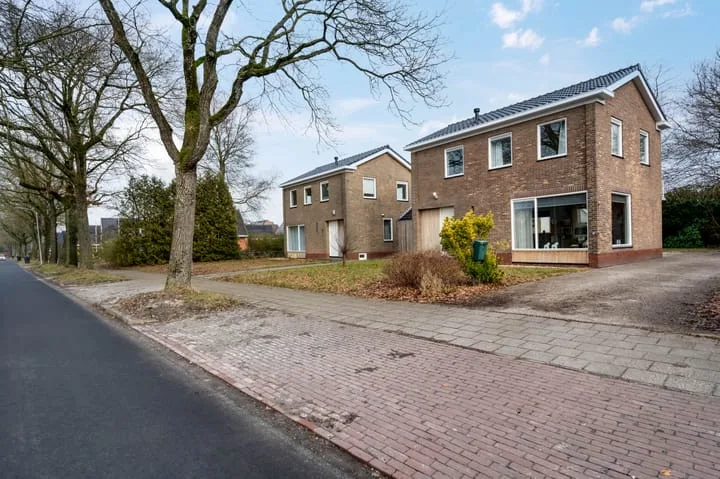
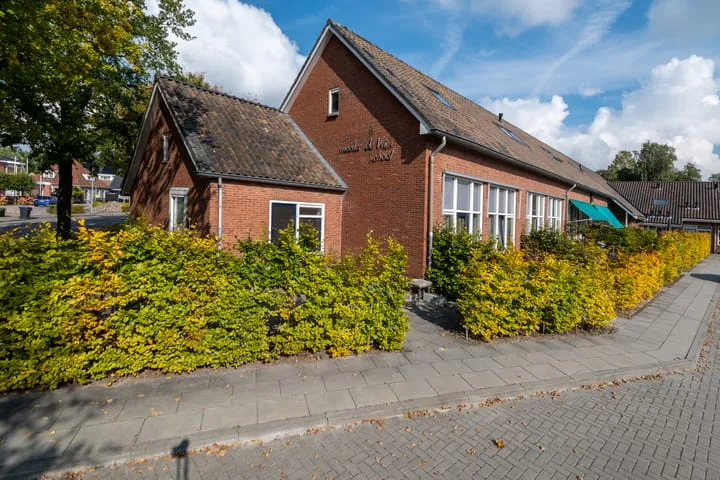
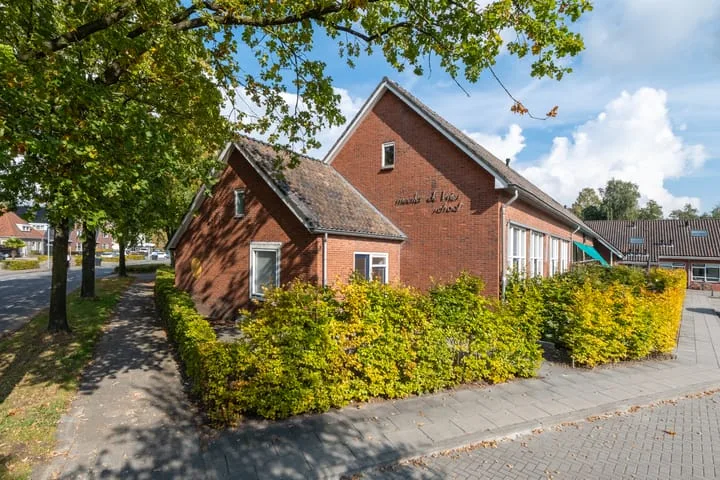
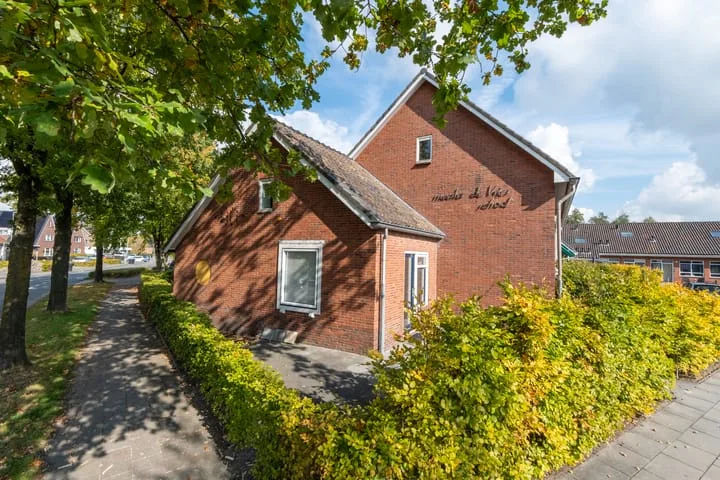
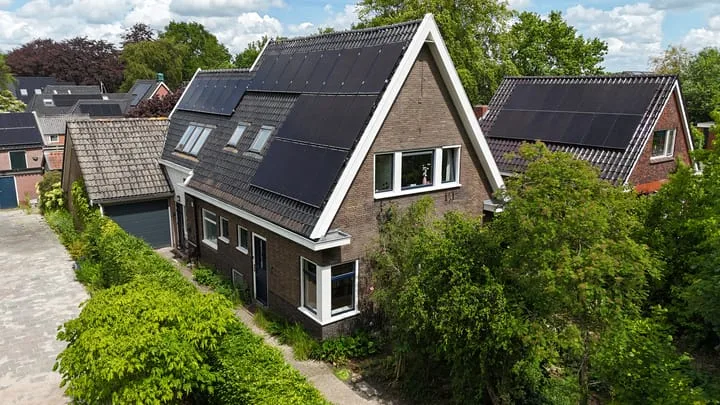
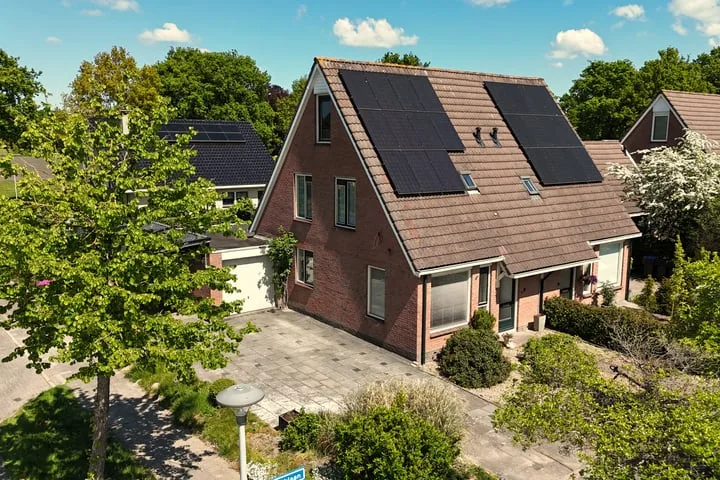
- Sold
Rietveld 18
9311RN Nieuw-Roden
€ 450.000 k.k.
€ 3.782/m²
- Living area
- 119 m²
- Land area
- 235 m²
- Bedrooms
- 3
View 14 sold houses in Nieuw-Roden
Type to search. Use arrow down and arrow up to navigate through results and press Enter to open.
Hidden search suggestions.
Compare sold homes in Nieuw-Roden or view the current offering in this location directly.
On this page you will find recently sold homes in Nieuw-Roden. Use this overview to better estimate selling prices, popular neighborhoods, and the local housing supply before you choose a real estate agent. Also view the current housing supply with 19 houses in Nieuw-Roden.
9311RN Nieuw-Roden
€ 450.000 k.k.
€ 3.782/m²
9311RE Nieuw-Roden
€ 269.000 k.k.
€ 2.862/m²
9311PT Nieuw-Roden
€ 285.000 k.k.
€ 4.453/m²
9311PZ Nieuw-Roden
€ 425.000 k.k.
€ 4.292/m²
9311RE Nieuw-Roden
€ 310.000 k.k.
€ 3.444/m²
9311PT Nieuw-Roden
€ 275.000 k.k.
€ 3.525/m²
9311PT Nieuw-Roden
€ 199.000 k.k.
€ 4.145/m²
9311PT Nieuw-Roden
€ 275.000 k.k.
€ 4.435/m²
9311RD Nieuw-Roden
€ 389.000 k.k.
€ 3.536/m²
9311RL Nieuw-Roden
€ 489.000 k.k.
€ 3.622/m²
9311PV Nieuw-Roden
€ 525.000 k.k.
€ 3.301/m²
9311RH Nieuw-Roden
€ 385.000 k.k.
€ 3.437/m²
9311PP Nieuw-Roden
€ 345.000 k.k.
€ 3.520/m²
9311TA Nieuw-Roden
€ 850.000 k.k.
€ 2.833/m²
View recent sales and receive free quotes from local real estate agents. Compare more than 21 real estate agents in Nieuw-Roden.
Selling your own home in Nieuw-Roden? Compare real estate agents in Nieuw-Roden or view the best real estate agents in Nieuw-Roden as a reference for your choice.
Real estate agents make sharper offers when they know you're comparing — ask for quotes for sale or purchase.
Short answers about housing prices, sold homes and comparing real estate agents in Nieuw-Roden.
The costs of a real estate agent in Nieuw-Roden vary per office, property type and sales approach. In Nieuw-Roden you can compare 21 real estate agents; therefore also look at the real estate agents in Nieuw-Roden to better compare fees, presentation and local experience.
On this page we currently show 14 sold houses in Nieuw-Roden from our selection. This helps you to better assess recent transactions and the local housing market.
Houses sold in Nieuw-Roden give insight into asking prices, house types and neighborhoods where recent transactions have taken place. Compare this also with the current housing stock in Nieuw-Roden to better understand the market.
You can use sold homes as a first market indication, but a local real estate agent can better take into account finishing, location, maintenance and current demand in Nieuw-Roden.
Compare the 21 real estate agents in Nieuw-Roden on local sales experience, reviews, expected yield, commission and marketing approach. View real estate agents in Nieuw-Roden or the top 10 agents in Nieuw-Roden to quickly discover strong offices.
View current location data on residents, WOZ development, housing stock, energy consumption, business activity and safety in Nieuw-Roden. In 2025 were there 1.571 residents. The average WOZ value in 2025 is EUR 402.984.
These figures help to better assess and compare the housing stock in Nieuw-Roden with recent sold homes. Orient yourself then on suitable top real estate agents in Nieuw-Roden for sales advice in this region.
Residents
1.571
Last year: 2025
Average WOZ
EUR 402.984
Last year: 2025
Average income per person.
EUR 718
Source: AllNumbers
Crimes (current year)
32
Total registered
| Year | Residents |
|---|---|
| 2021 | 1.456 |
| 2022 | 1.486 |
| 2023 | 1.525 |
| 2024 | 1.572 |
| 2025 | 1.571 |
| Year | Average WOZ |
|---|---|
| 2021 | EUR 299.242 |
| 2022 | EUR 321.177 |
| 2023 | EUR 366.906 |
| 2024 | EUR 379.908 |
| 2025 | EUR 402.984 |
Hoger
297
Praktisch
277
Middelbaar
544
Europa
57
Nederland
1.432
Buiten Europa
86
Label A
214
Label C
149
Label G
90
Label B
61
Label F
46
Label A++++
44
Label D
37
Label A+++
21
Label E
19
Label A+
5
Label A++
1
Label A+++++
0
| Year | Gas (m3) | Electricity (kWh) |
|---|---|---|
| 2020 | 1.501 | 3.015 |
| 2021 | 1.696 | 3.106 |
| 2022 | 1.250 | 2.794 |
| 2023 | 1.004 | 2.656 |
| 2024 | 943 | 2.792 |
Hoekwoning
Gas: 592 • Electricity: 1.989
Huurwoning
Gas: 743 • Electricity: 2.253
Koopwoning
Gas: 1.125 • Electricity: 2.866
Appartement
Gas: 742 • Electricity: 1.704
Tussenwoning
Gas: 505 • Electricity: 1.662
Vrijstaande woning
Gas: 1.298 • Electricity: 3.245
Twee-onder-één-kap woning
Gas: 900 • Electricity: 2.395
Total number of company establishments: 184
| Period | Crimes |
|---|---|
| jan 2025 | 7 |
| jan 2026 | 2 |
| jul 2025 | 2 |
| jun 2025 | 5 |
| mei 2025 | 1 |
| mrt 2025 | 1 |
| nov 2024 | 2 |
| nov 2025 | 3 |
| okt 2024 | 2 |
| okt 2025 | 2 |
| sep 2024 | 4 |
| sep 2025 | 2 |
These figures give an indicative picture of safety trends in the living environment of Nieuw-Roden.
Short answers based on current local statistics, handy for a quick comparison of the living environment.
Nieuw-Roden telt in 2025 ongeveer 1.571 inwoners.
De gemiddelde WOZ-waarde in Nieuw-Roden is in 2025 circa € 402.984.
Het gemiddelde inkomen per inwoner in Nieuw-Roden ligt rond € 718 per jaar.
Voor het huidige jaar gaat het om ongeveer 32 geregistreerde misdrijven. Gebruik deze cijfers als indicatie en vergelijk trends per periode.
In Nieuw-Roden komt vooral "Vrijstaande woningen" veel voor, met ongeveer 309 woningen.