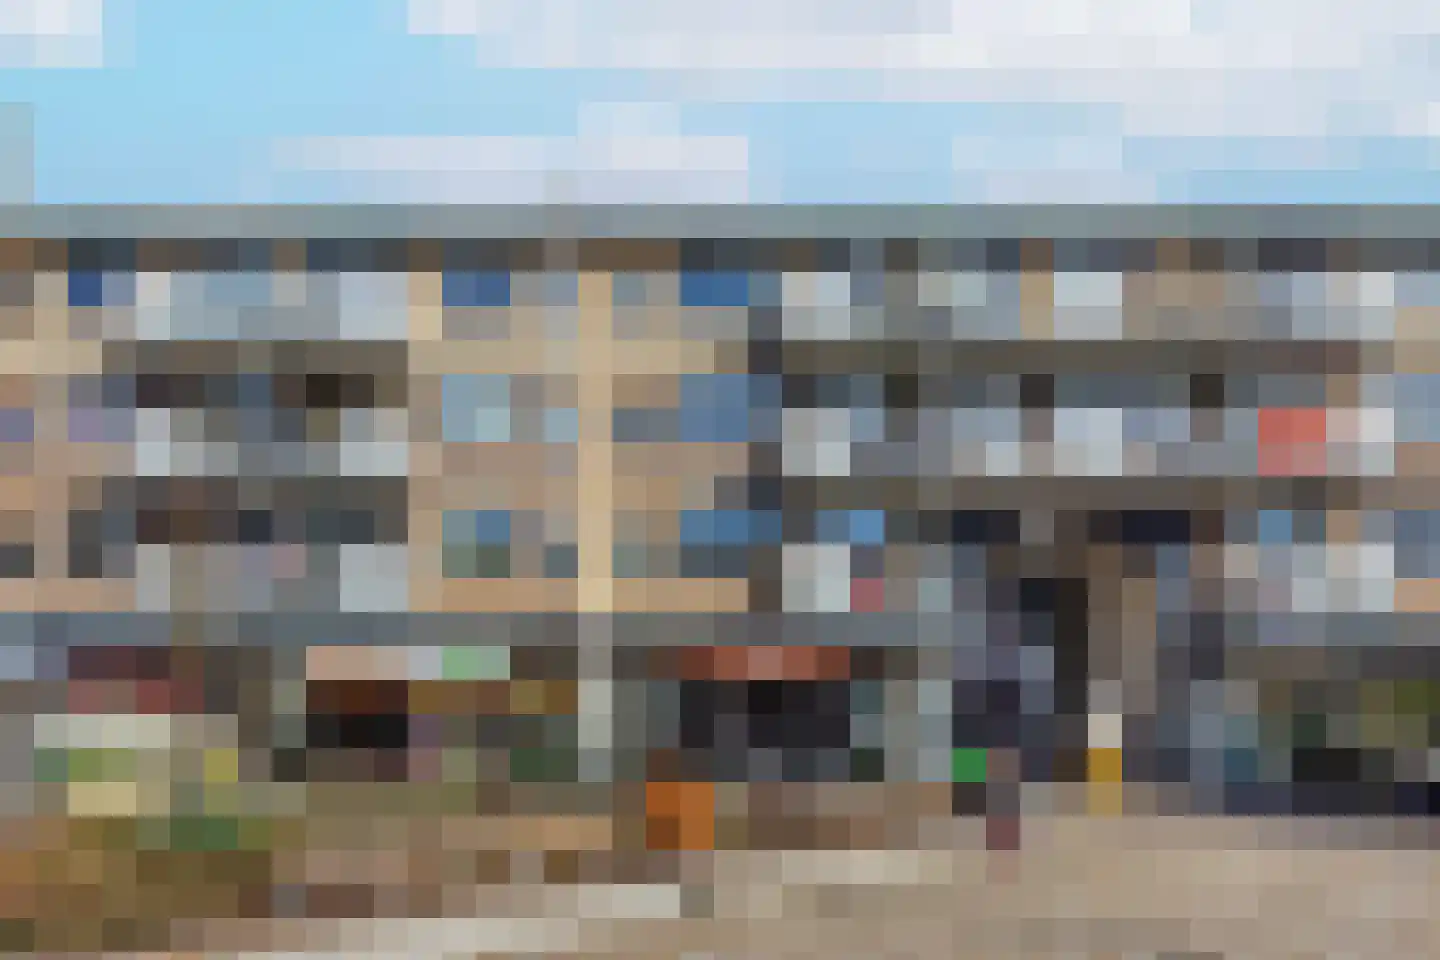
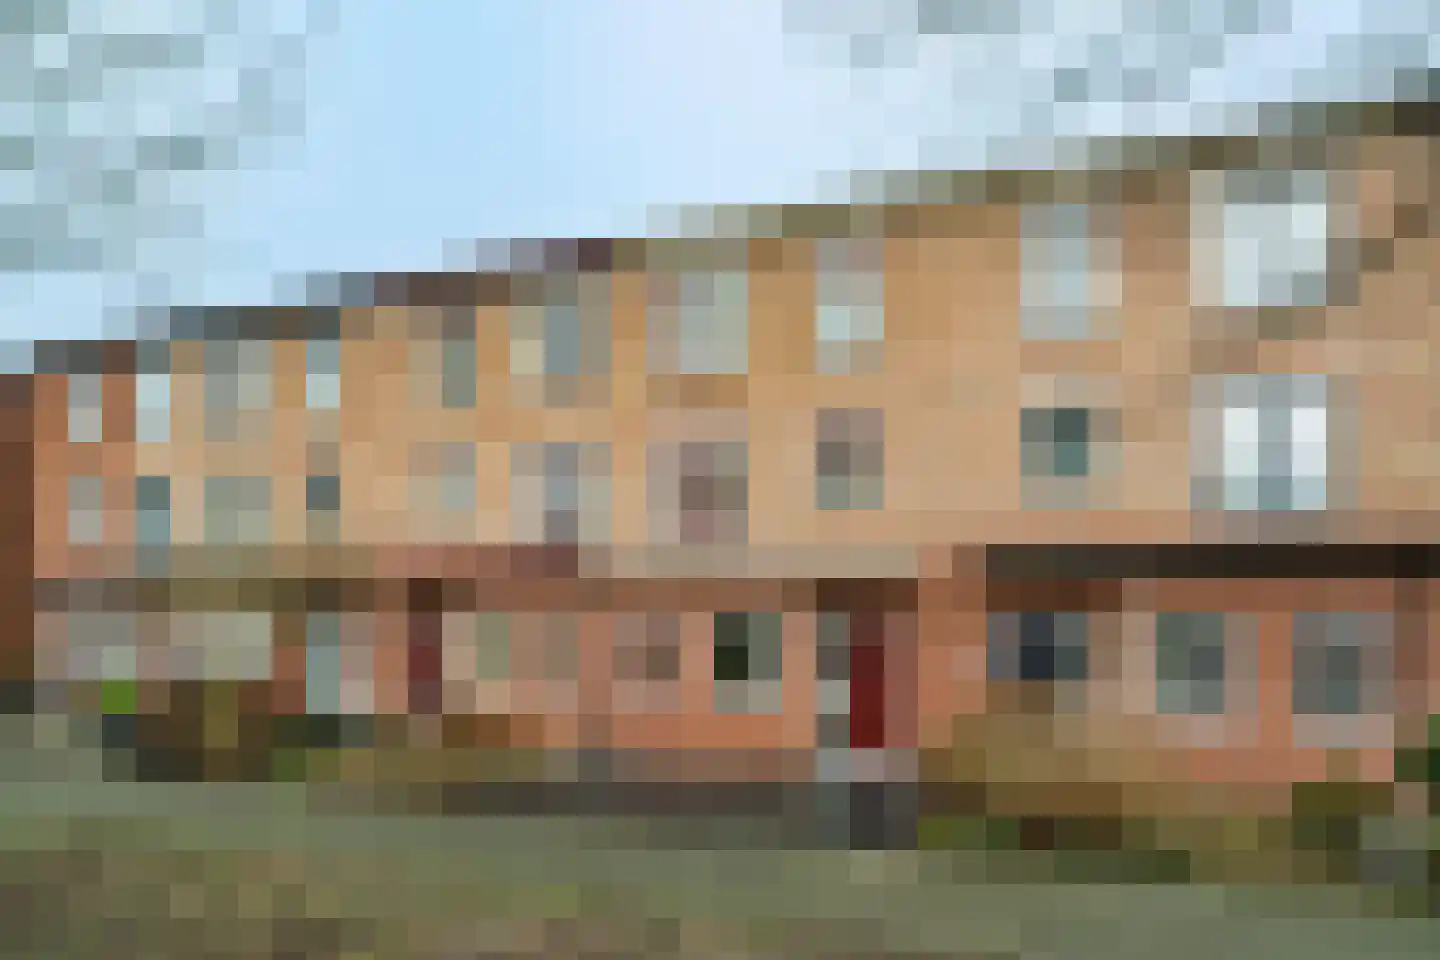
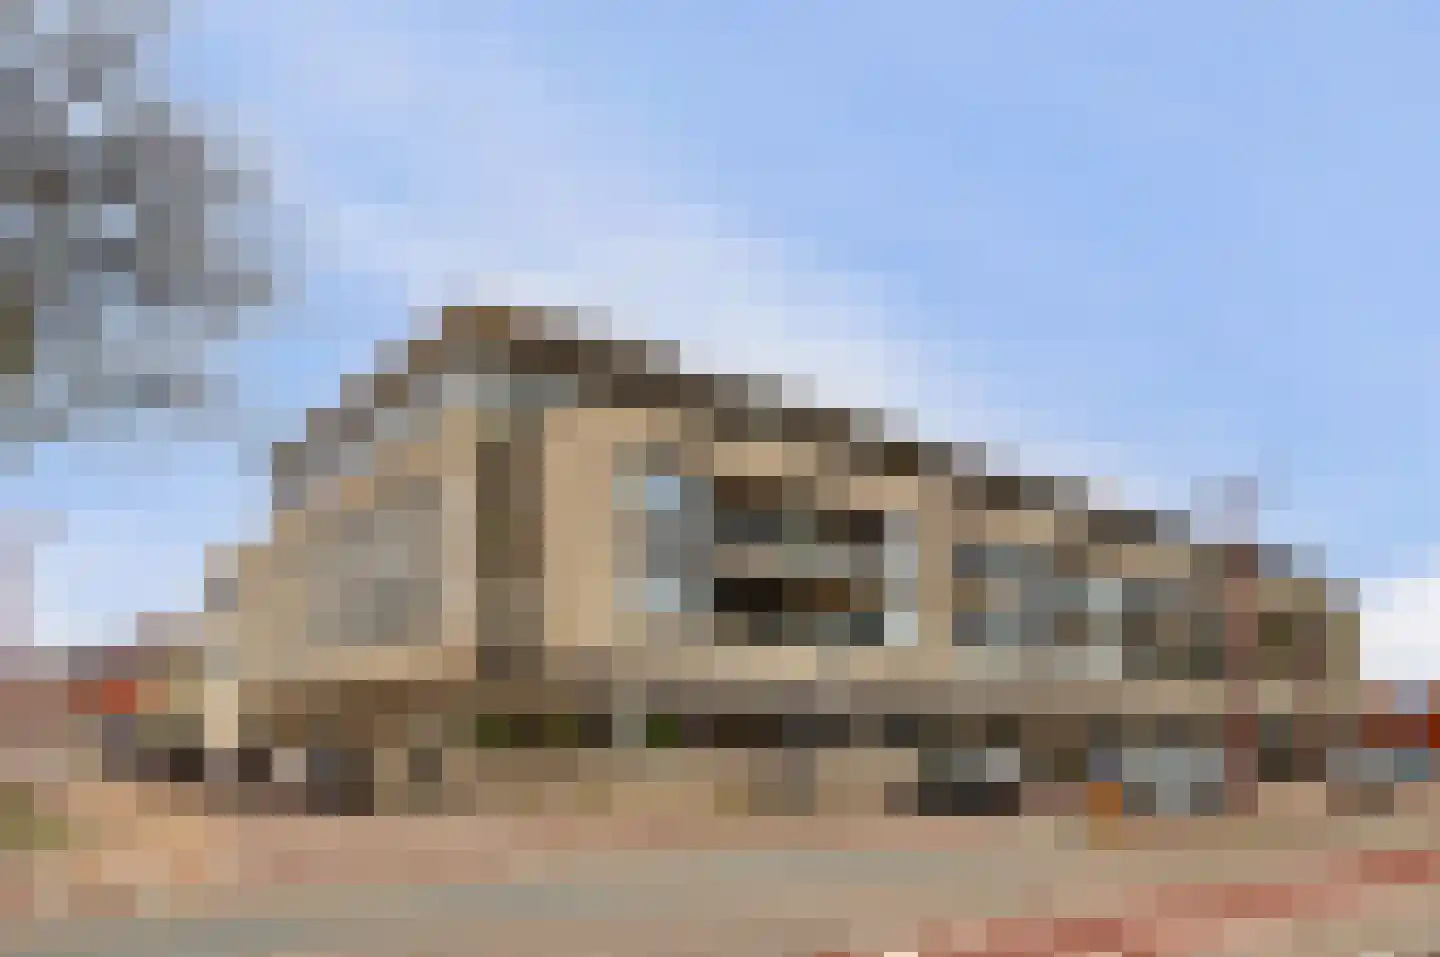
- Sold
Edisonbaan 16 3
3439MN Nieuwegein
€ 695.000 k.k.
€ 4.826/m²
- Living area
- 144 m²
- Land area
- 111 m²
- Bedrooms
- 5
View 767 sold houses in Nieuwegein
Type to search. Use arrow down and arrow up to navigate through results and press Enter to open.
Hidden search suggestions.
Compare sold homes in Nieuwegein or view the current offering in this location directly.
On this page you will find recently sold homes in Nieuwegein. Use this overview to better estimate selling prices, popular neighborhoods, and the local housing supply before you choose a real estate agent. Also view the current housing supply with 996 houses in Nieuwegein.
3439MN Nieuwegein
€ 695.000 k.k.
€ 4.826/m²
3437GZ Nieuwegein
€ 440.000 k.k.
€ 3.964/m²
3439NG Nieuwegein
€ 425.000 k.k.
€ 5.519/m²
3433EC Nieuwegein
€ 345.000 k.k.
€ 5.847/m²
3437JZ Nieuwegein
€ 495.000 k.k.
€ 4.304/m²
3437DC Nieuwegein
€ 550.000 k.k.
€ 4.330/m²
3436GD Nieuwegein
€ 449.000 k.k.
€ 4.081/m²
3435ZB Nieuwegein
€ 295.000 k.k.
€ 4.609/m²
3432GL Nieuwegein
€ 250.000 k.k.
€ 6.756/m²
3431KC Nieuwegein
€ 375.000 k.k.
€ 6.048/m²
3433ES Nieuwegein
€ 500.000 k.k.
€ 4.065/m²
3436BV Nieuwegein
€ 350.000 k.k.
€ 4.666/m²
3437AV Nieuwegein
€ 325.000 k.k.
€ 4.643/m²
3438JH Nieuwegein
€ 525.000 k.k.
€ 4.412/m²
3437JT Nieuwegein
€ 695.000 k.k.
€ 3.159/m²
3432EW Nieuwegein
€ 425.000 k.k.
€ 3.728/m²
3432ZT Nieuwegein
€ 295.000 k.k.
€ 6.145/m²
3431EC Nieuwegein
€ 489.000 k.k.
€ 5.041/m²
3438AB Nieuwegein
€ 500.000 k.k.
€ 4.630/m²
3432ZE Nieuwegein
€ 300.000 k.k.
€ 6.122/m²
3438TW Nieuwegein
€ 465.000 k.k.
€ 4.305/m²
3435VG Nieuwegein
€ 425.000 k.k.
€ 3.571/m²
3431XL Nieuwegein
€ 300.000 k.k.
€ 3.947/m²
3431EV Nieuwegein
€ 500.000 k.k.
€ 3.937/m²
3433EG Nieuwegein
€ 695.000 k.k.
€ 3.696/m²
3432CT Nieuwegein
€ 450.000 k.k.
€ 4.245/m²
3434DA Nieuwegein
€ 775.000 k.k.
€ 4.585/m²
3439ML Nieuwegein
€ 365.000 k.k.
€ 4.932/m²
Bekijk recente verkopen en ontvang gratis offertes van lokale verkoopmakelaars in Nieuwegein.
Recent verkocht in Nieuwegein? Lees de verkoopgerichte gids huis verkopen in Nieuwegein, vergelijk verkoopmakelaars in Nieuwegein of bekijk de beste verkoopmakelaars in Nieuwegein voor referentie bij jouw keuze.
Makelaars maken scherpere voorstellen als ze weten dat je vergelijkt — vraag offertes aan voor verkoop of aankoop.
Short answers about housing prices, sold homes and comparing real estate agents in Nieuwegein.
The costs of a real estate agent in Nieuwegein vary per office, property type and sales approach. Therefore, compare multiple quotes and also look at the real estate agents in Nieuwegein to better compare rates, presentation and local experience.
On this page we currently show 767 sold houses in Nieuwegein from our selection. This helps you to better assess recent transactions and the local housing market.
Houses sold in Nieuwegein give insight into asking prices, house types and neighborhoods where recent transactions have taken place. Compare this also with the current housing stock in Nieuwegein to better understand the market.
Je kunt verkochte woningen gebruiken als eerste marktindicatie, maar een lokale makelaar kan beter rekening houden met afwerking, ligging, onderhoud en actuele vraag in Nieuwegein. Plan de volgende stap via de gids huis verkopen in Nieuwegein.
Vergelijk makelaars in Nieuwegein op lokale verkoopervaring, reviews, verwachte opbrengst, courtage en marketingaanpak. Bekijk verkoopmakelaars in Nieuwegein of de top 10 makelaars in Nieuwegein om snel sterke kantoren te ontdekken.
View current location data on residents, WOZ development, housing stock, energy consumption, business activity and safety in Nieuwegein. In 2026 were there 68.299 residents. The average WOZ value in 2025 is EUR 386.000.
These figures help to better assess and compare the housing stock in Nieuwegein with recent sold homes. Orient yourself then on suitable top real estate agents in Nieuwegein for sales advice in this region.
Residents
68.299
Last year: 2026
Average WOZ
EUR 386.000
Last year: 2025
Average income per person.
EUR 34.700
Source: AllNumbers
Crimes (current year)
3.759
Total registered
| Year | Residents |
|---|---|
| 2022 | 64.554 |
| 2023 | 65.426 |
| 2024 | 65.971 |
| 2025 | 66.788 |
| 2026 | 68.299 |
| Year | Average WOZ |
|---|---|
| 2021 | EUR 269.000 |
| 2022 | EUR 292.000 |
| 2023 | EUR 349.000 |
| 2024 | EUR 352.000 |
| 2025 | EUR 386.000 |
Hoger
32
Praktisch
26
Middelbaar
42
Europa
5.161
Nederland
44.049
Buiten Europa
17.578
Label C
12.189
Label A
7.575
Label B
5.217
Label D
2.936
Label A+++
1.724
Label A+
1.603
Label E
734
Label A++
678
Label G
403
Label F
357
Label A++++
186
Label A+++++
12
| Year | Gas (m3) | Electricity (kWh) |
|---|---|---|
| 2020 | 510 | 2.790 |
| 2021 | 580 | 2.830 |
| 2022 | 440 | 2.620 |
| 2023 | 380 | 2.420 |
| 2024 | 370 | 2.440 |
Hoekwoning
Gas: 610 • Electricity: 2.810
Huurwoning
Gas: 280 • Electricity: 2.050
Koopwoning
Gas: 450 • Electricity: 2.690
Appartement
Gas: 170 • Electricity: 1.930
Tussenwoning
Gas: 450 • Electricity: 2.650
Vrijstaande woning
Gas: 920 • Electricity: 4.060
Twee-onder-één-kap woning
Gas: 950 • Electricity: 3.300
Total number of company establishments: 8.500
| Period | Crimes |
|---|---|
| jan 2025 | 304 |
| jan 2026 | 290 |
| jul 2025 | 363 |
| jun 2025 | 303 |
| mei 2025 | 355 |
| mrt 2025 | 368 |
| nov 2024 | 339 |
| nov 2025 | 274 |
| okt 2024 | 336 |
| okt 2025 | 296 |
| sep 2024 | 290 |
| sep 2025 | 302 |
These figures give an indicative picture of safety trends in the living environment of Nieuwegein.
Short answers based on current local statistics, handy for a quick comparison of the living environment.
Nieuwegein telt in 2026 ongeveer 68.299 inwoners.
De gemiddelde WOZ-waarde in Nieuwegein is in 2025 circa € 386.000.
Het gemiddelde inkomen per inwoner in Nieuwegein ligt rond € 34.700 per jaar.
Voor het huidige jaar gaat het om ongeveer 3.759 geregistreerde misdrijven. Gebruik deze cijfers als indicatie en vergelijk trends per periode.
In Nieuwegein komt vooral "Appartementen" veel voor, met ongeveer 15.005 woningen.