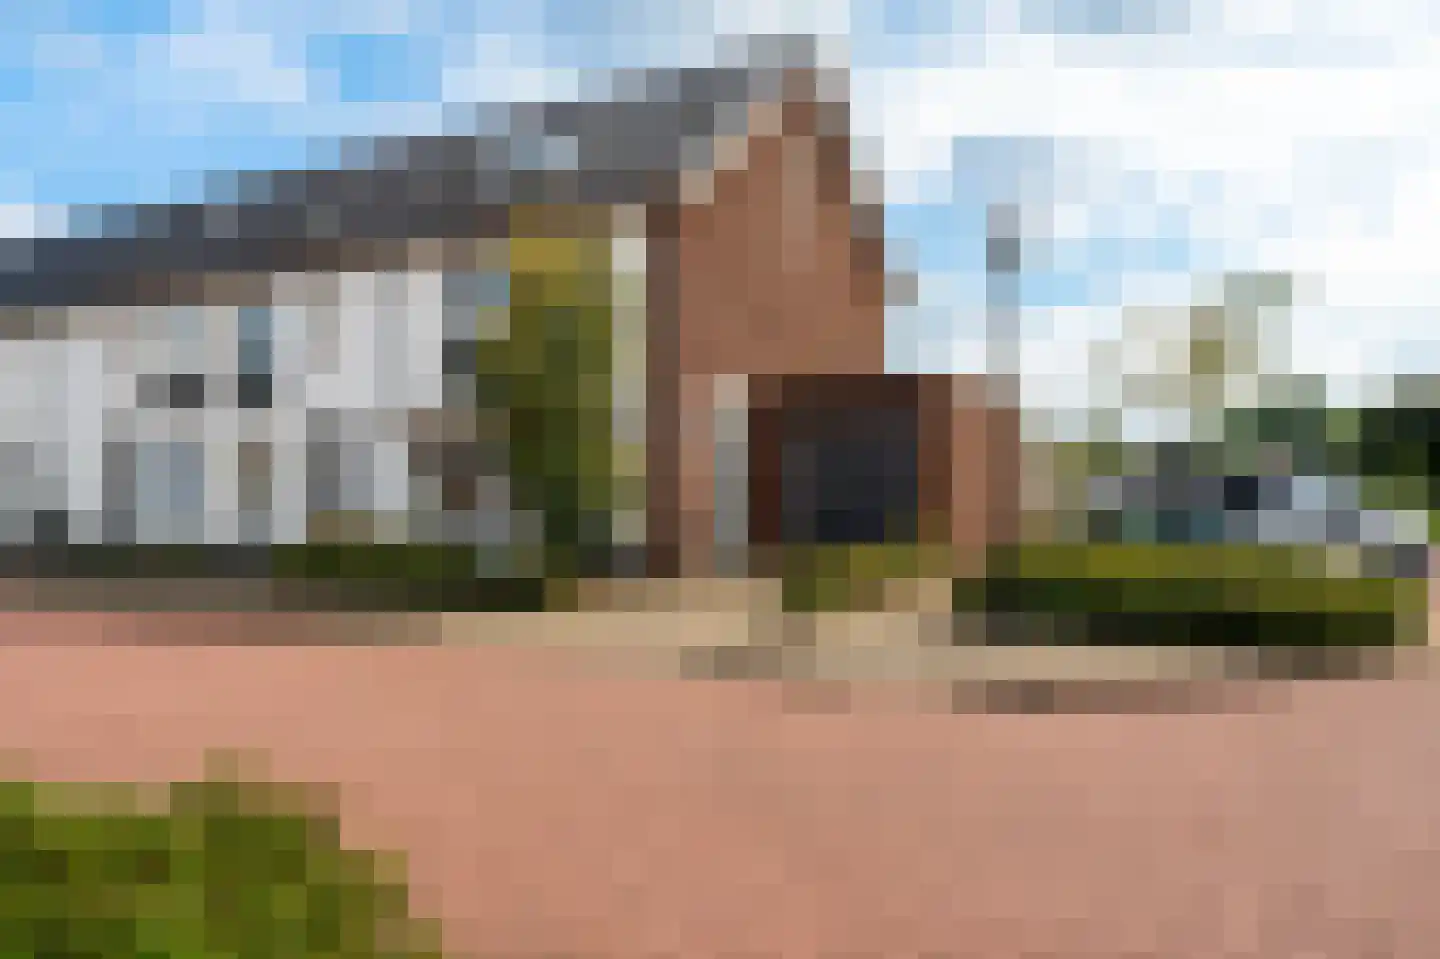
- Sold
Singel 25
4255HC Nieuwendijk
€ 650.000 k.k.
€ 4.140/m²
- Living area
- 157 m²
- Land area
- 332 m²
- Bedrooms
- 4
View 29 sold houses in Nieuwendijk
Type to search. Use arrow down and arrow up to navigate through results and press Enter to open.
Hidden search suggestions.
Compare sold homes in Nieuwendijk or view the current offering in this location directly.
On this page you will find recently sold homes in Nieuwendijk. Use this overview to better estimate selling prices, popular neighborhoods, and the local housing supply before you choose a real estate agent. Also view the current housing supply with 41 houses in Nieuwendijk.
4255HC Nieuwendijk
€ 650.000 k.k.
€ 4.140/m²
4255TB Nieuwendijk
€ 435.000 k.k.
€ 3.625/m²
4255GN Nieuwendijk
€ 475.000 k.k.
€ 3.740/m²
4255VK Nieuwendijk
€ 325.000 k.k.
€ 4.642/m²
4255JJ Nieuwendijk
€ 415.000 k.k.
€ 3.167/m²
4255JS Nieuwendijk
€ 539.000 k.k.
€ 4.312/m²
4255GM Nieuwendijk
€ 325.000 k.k.
€ 3.457/m²
4255GD Nieuwendijk
€ 310.000 k.k.
€ 3.100/m²
4255TB Nieuwendijk
€ 350.000 k.k.
€ 4.375/m²
4255GR Nieuwendijk
€ 459.000 k.k.
€ 4.289/m²
4255JR Nieuwendijk
€ 535.000 k.k.
€ 3.689/m²
4255TA Nieuwendijk
€ 595.000 k.k.
€ 5.042/m²
4255JA Nieuwendijk
€ 675.000 k.k.
€ 3.835/m²
4255JK Nieuwendijk
€ 375.000 k.k.
€ 4.076/m²
4255HG Nieuwendijk
€ 515.000 k.k.
€ 3.029/m²
4255GV Nieuwendijk
€ 685.000 k.k.
€ 5.310/m²
4255HL Nieuwendijk
€ 425.000 k.k.
€ 4.292/m²
4255KC Nieuwendijk
€ 595.000 k.k.
€ 3.966/m²
4255HG Nieuwendijk
€ 469.000 k.k.
€ 4.187/m²
4255SH Nieuwendijk
€ 395.000 k.k.
€ 4.293/m²
4255HB Nieuwendijk
€ 835.000 k.k.
€ 3.394/m²
4255VN Nieuwendijk
€ 340.000 k.k.
€ 0/m²
4255HG Nieuwendijk
€ 489.000 k.k.
€ 0/m²
4255JR Nieuwendijk
€ 439.000 k.k.
€ 3.048/m²
4255JL Nieuwendijk
€ 375.000 k.k.
€ 4.032/m²
4255JM Nieuwendijk
€ 419.000 k.k.
€ 2.992/m²
4255VJ Nieuwendijk
€ 335.000 k.k.
€ 3.602/m²
4255SH Nieuwendijk
€ 335.000 k.k.
€ 4.085/m²
Bekijk recente verkopen en ontvang gratis offertes van lokale makelaars. Vergelijk meer dan 27 makelaars in Nieuwendijk.
Selling your own home in Nieuwendijk? Compare real estate agents in Nieuwendijk or view the best real estate agents in Nieuwendijk as a reference for your choice.
Real estate agents make sharper offers when they know you're comparing — ask for quotes for sale or purchase.
Short answers about housing prices, sold homes and comparing real estate agents in Nieuwendijk.
De kosten van een makelaar in Nieuwendijk verschillen per kantoor, woningtype en verkoopaanpak. In Nieuwendijk kun je 27 real estate agents vergelijken; bekijk daarom ook de makelaars in Nieuwendijk om tarieven, presentatie en lokale ervaring beter naast elkaar te zetten.
On this page we currently show 29 sold houses in Nieuwendijk from our selection. This helps you to better assess recent transactions and the local housing market.
Houses sold in Nieuwendijk give insight into asking prices, house types and neighborhoods where recent transactions have taken place. Compare this also with the current housing stock in Nieuwendijk to better understand the market.
You can use sold homes as a first market indication, but a local real estate agent can better take into account finishing, location, maintenance and current demand in Nieuwendijk.
Vergelijk de 27 real estate agents in Nieuwendijk op lokale verkoopervaring, reviews, verwachte opbrengst, courtage en marketingaanpak. Bekijk verkoopmakelaars in Nieuwendijk of de top 10 makelaars in Nieuwendijk om snel sterke kantoren te ontdekken.
View current location data on residents, WOZ development, housing stock, energy consumption, business activity and safety in Nieuwendijk. In 2025 were there 3.730 residents. The average WOZ value in 2025 is EUR 377.000.
These figures help to better assess and compare the housing stock in Nieuwendijk with recent sold homes. Orient yourself then on suitable top real estate agents in Nieuwendijk for sales advice in this region.
Residents
3.730
Last year: 2025
Average WOZ
EUR 377.000
Last year: 2025
Average income per person.
EUR 33.700
Source: AllNumbers
Crimes (current year)
175
Total registered
| Year | Residents |
|---|---|
| 2021 | 3.660 |
| 2022 | 3.665 |
| 2023 | 3.675 |
| 2024 | 3.735 |
| 2025 | 3.730 |
| Year | Average WOZ |
|---|---|
| 2021 | EUR 270.000 |
| 2022 | EUR 296.000 |
| 2023 | EUR 350.000 |
| 2024 | EUR 371.000 |
| 2025 | EUR 377.000 |
Hoger
640
Praktisch
840
Middelbaar
1.270
Europa
120
Nederland
3.380
Buiten Europa
240
Label A
464
Label C
342
Label B
263
Label G
200
Label D
139
Label F
111
Label E
62
Label A+
23
Label A+++
10
Label A++
5
Label A++++
1
Label A+++++
0
| Year | Gas (m3) | Electricity (kWh) |
|---|---|---|
| 2020 | 1.280 | 2.990 |
| 2021 | 1.430 | 3.040 |
| 2022 | 1.090 | 2.860 |
| 2023 | 910 | 2.700 |
| 2024 | 910 | 2.750 |
Hoekwoning
Gas: 890 • Electricity: 2.440
Huurwoning
Gas: 800 • Electricity: 1.840
Koopwoning
Gas: 980 • Electricity: 3.200
Appartement
Gas: 560 • Electricity: 1.690
Tussenwoning
Gas: 740 • Electricity: 2.080
Vrijstaande woning
Gas: 1.200 • Electricity: 3.640
Twee-onder-één-kap woning
Gas: 920 • Electricity: 2.870
Total number of company establishments: 450
| Period | Crimes |
|---|---|
| jan 2026 | 35 |
| jul 2025 | 9 |
| jun 2025 | 12 |
| mei 2025 | 13 |
| mrt 2025 | 7 |
| mrt 2026 | 57 |
| nov 2024 | 4 |
| nov 2025 | 29 |
| okt 2024 | 20 |
| okt 2025 | 12 |
| sep 2024 | 7 |
| sep 2025 | 9 |
These figures give an indicative picture of safety trends in the living environment of Nieuwendijk.
Short answers based on current local statistics, handy for a quick comparison of the living environment.
Nieuwendijk telt in 2025 ongeveer 3.730 inwoners.
De gemiddelde WOZ-waarde in Nieuwendijk is in 2025 circa € 377.000.
Het gemiddelde inkomen per inwoner in Nieuwendijk ligt rond € 33.700 per jaar.
Voor het huidige jaar gaat het om ongeveer 175 geregistreerde misdrijven. Gebruik deze cijfers als indicatie en vergelijk trends per periode.
In Nieuwendijk komt vooral "Vrijstaande woningen" veel voor, met ongeveer 459 woningen.