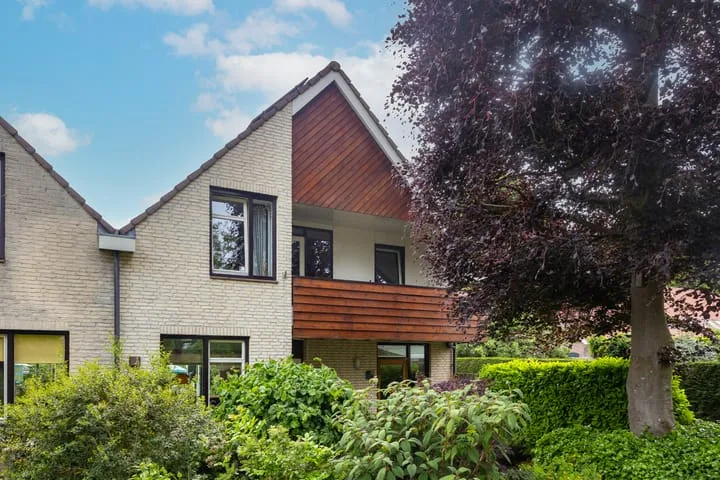
Houses sold in Odijk

View 47 sold houses in Odijk

Connected to: Vastgoed Nederland NVM Makelaars

On this page you will find recently sold homes in Odijk. Use this overview to better estimate selling prices, popular neighborhoods, and the local housing supply before you choose a real estate agent. Also view the current housing supply with 61 houses in Odijk.

Selection

Search and filter homes

Set your preferences and discover homes that suit you.

Total supply 241.443
Filters

Set price, area and other characteristics. Adjust a filter or click on Show homes. Location changes directly above.

Reset filters

You search for

  • Place Odijk
  • Status Sold

Huis verkopen in Odijk? Vergelijk verkoopmakelaars

Bekijk recente verkopen en ontvang gratis offertes van lokale verkoopmakelaars in Odijk.

Free request a quote

  • Quotes in Odijk
  • Non-binding
  • Personal
  • Gratis tarieven vergelijken

Zelf je woning verkopen in Odijk? Vergelijk verkoopmakelaars in Odijk of bekijk de beste verkoopmakelaars in Odijk als referentie bij jouw keuze.

Vergelijk meerdere offertes

Makelaars maken scherpere voorstellen als ze weten dat je vergelijkt — vraag offertes aan voor verkoop of aankoop.

Frequently asked questions about sold homes in Odijk

Short answers about housing prices, sold homes and comparing real estate agents in Odijk.

Residential and neighborhood statistics in Odijk

View current location data on residents, WOZ development, housing stock, energy consumption, business activity and safety in Odijk. In 2025 were there 6.200 residents. The average WOZ value in 2025 is EUR 532.000.

These figures help to better assess and compare the housing stock in Odijk with recent sold homes. Orient yourself then on suitable top real estate agents in Odijk for sales advice in this region.

Residents

6.200

Last year: 2025

Average WOZ

EUR 532.000

Last year: 2025

Average income per person.

EUR 40.300

Source: AllNumbers

Crimes (current year)

122

Total registered

Demographics and WOZ development

Inhabitants per year

Inhabitants per year in Odijk
Year Residents
2021 5.725
2022 5.855
2023 6.080
2024 6.125
2025 6.200

Annual WOZ value

WOZ value per year in Odijk
Year Average WOZ
2021 EUR 388.000
2022 EUR 413.000
2023 EUR 501.000
2024 EUR 508.000
2025 EUR 532.000

Composition of residents

Age build-up

65+: 1.415 0-15: 1.000 15-25: 655 25-45: 1.280 45-65: 1.845

Education level

Hoger

1.930

Praktisch

960

Middelbaar

1.700

Origin of residents (2025)

Europa

350

Nederland

5.150

Buiten Europa

700

Housing stock and construction periods

Types of homes

Hoekwoningen 540
Appartementen 521
Tussenwoningen 1.098
Vrijstaande woningen 273
Twee-onder-één-kap woningen 285

Construction period of buildings

Voor 1700 1
1700 tot 1900 23
1900 tot 1925 13
1925 tot 1950 45
1950 tot 1970 738
1970 tot 1980 176
1980 tot 1990 686
1990 tot 2000 251
2000 tot 2010 173
2010 tot 2020 209
2020 en later 157

Energy and sustainability

Energy label distribution

Label C

984

Label A

640

Label B

362

Label D

231

Label A+++

123

Label A++

111

Label F

100

Label E

67

Label G

56

Label A+

54

Label A++++

1

Label A+++++

0

Average energy consumption per year

Average energy consumption per year in Odijk
Year Gas (m3) Electricity (kWh)
2020 1.180 2.970
2021 1.330 2.990
2022 1.030 2.770
2023 870 2.670
2024 830 2.800

Consumption per house type

Hoekwoning

Gas: 950 • Electricity: 2.860

Huurwoning

Gas: 660 • Electricity: 2.010

Koopwoning

Gas: 940 • Electricity: 2.890

Appartement

Gas: 480 • Electricity: 1.730

Tussenwoning

Gas: 830 • Electricity: 2.500

Vrijstaande woning

Gas: 1.410 • Electricity: 4.290

Twee-onder-één-kap woning

Gas: 1.020 • Electricity: 3.100

Business activity in Odijk (2025)

Handel en HORECA 85
Nijverheid en energie 105
Zakelijke dienstverlening 245
Overheid, onderwijs en zorg 160
Landbouw, bosbouw en visserij 20
Vervoer, informatie en communicatie 55
Financiele diensten en onroerendgoed 35
Cultuur, recreatie en overige diensten 80

Total number of company establishments: 785

Recent crime statistics

Recent crime statistics in Odijk
Period Crimes
jan 2026 14
jul 2025 12
jun 2025 10
mei 2025 12
mrt 2025 10
mrt 2026 12
nov 2024 9
nov 2025 8
okt 2024 6
okt 2025 14
sep 2024 8
sep 2025 8

These figures give an indicative picture of safety trends in the living environment of Odijk.

Frequently asked questions about living in Odijk

Short answers based on current local statistics, handy for a quick comparison of the living environment.

Hoeveel inwoners heeft Odijk?

Odijk telt in 2025 ongeveer 6.200 inwoners.

Wat is de gemiddelde WOZ-waarde in Odijk?

De gemiddelde WOZ-waarde in Odijk is in 2025 circa € 532.000.

Wat is het gemiddelde inkomen per inwoner in Odijk?

Het gemiddelde inkomen per inwoner in Odijk ligt rond € 40.300 per jaar.

Hoe veilig is wonen in Odijk?

Voor het huidige jaar gaat het om ongeveer 122 geregistreerde misdrijven. Gebruik deze cijfers als indicatie en vergelijk trends per periode.

Welke woningtypen komen het meest voor in Odijk?

In Odijk komt vooral "Tussenwoningen" veel voor, met ongeveer 1.098 woningen.

Gratis vrijblijvende offertes ontvangen

Vergelijk meerdere makelaars en kies de beste match.