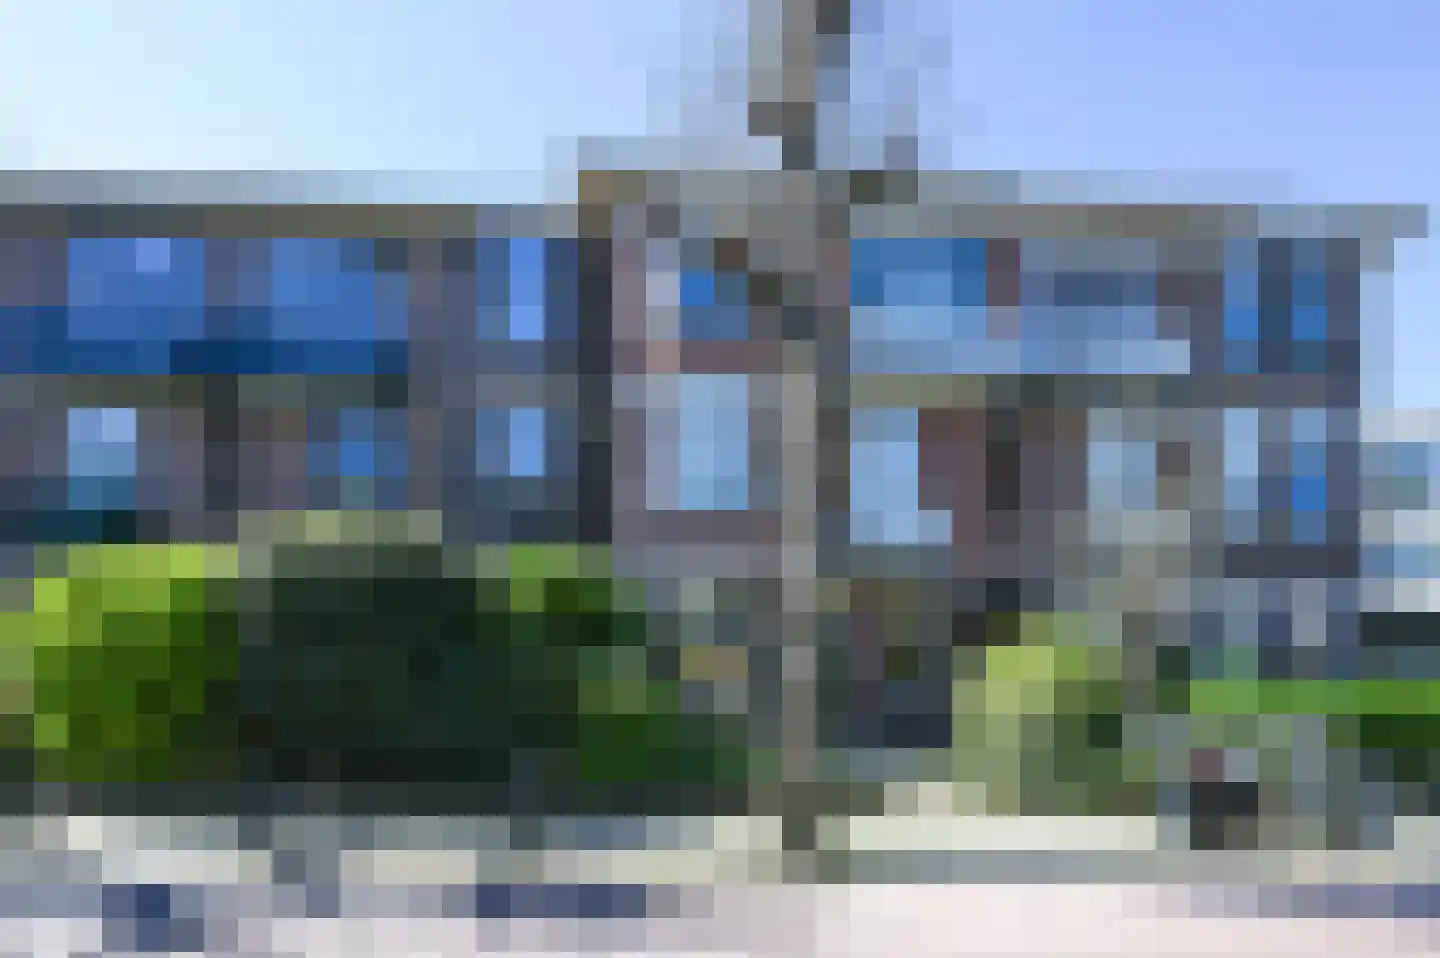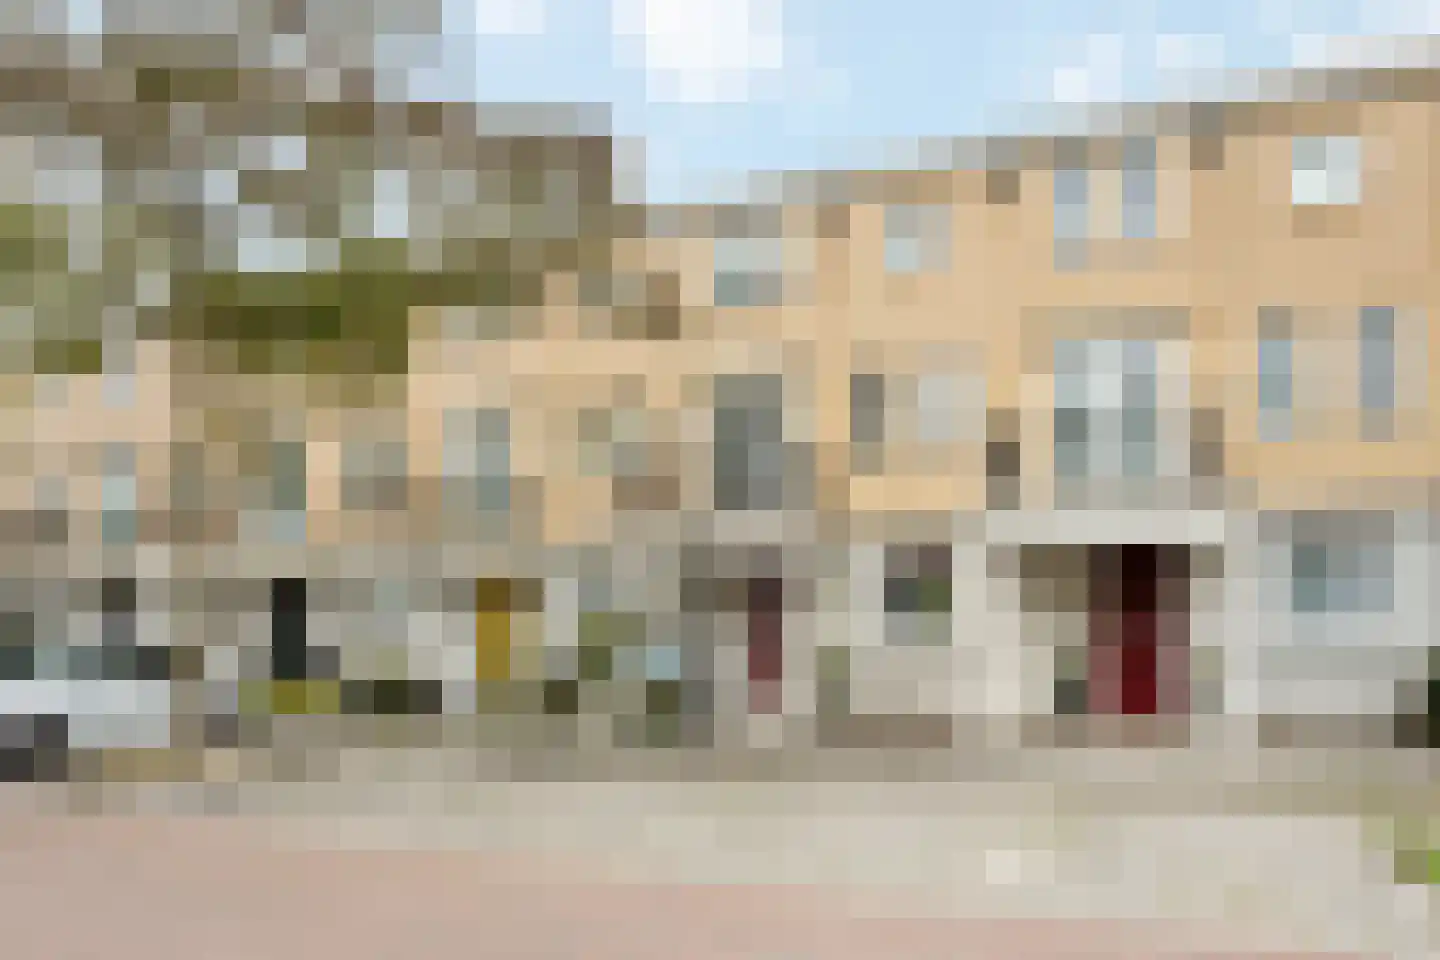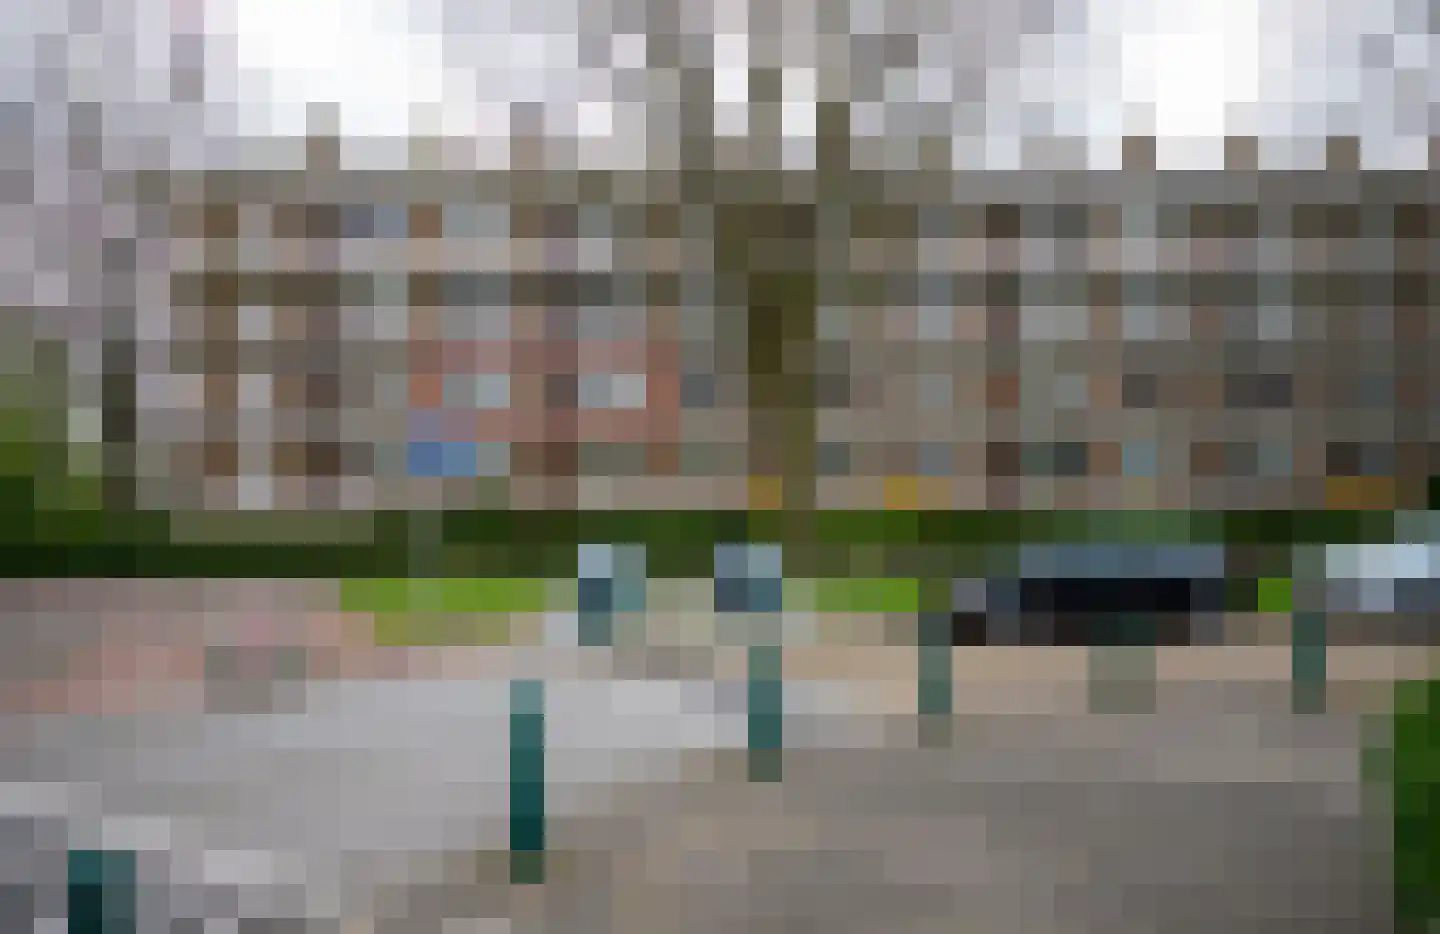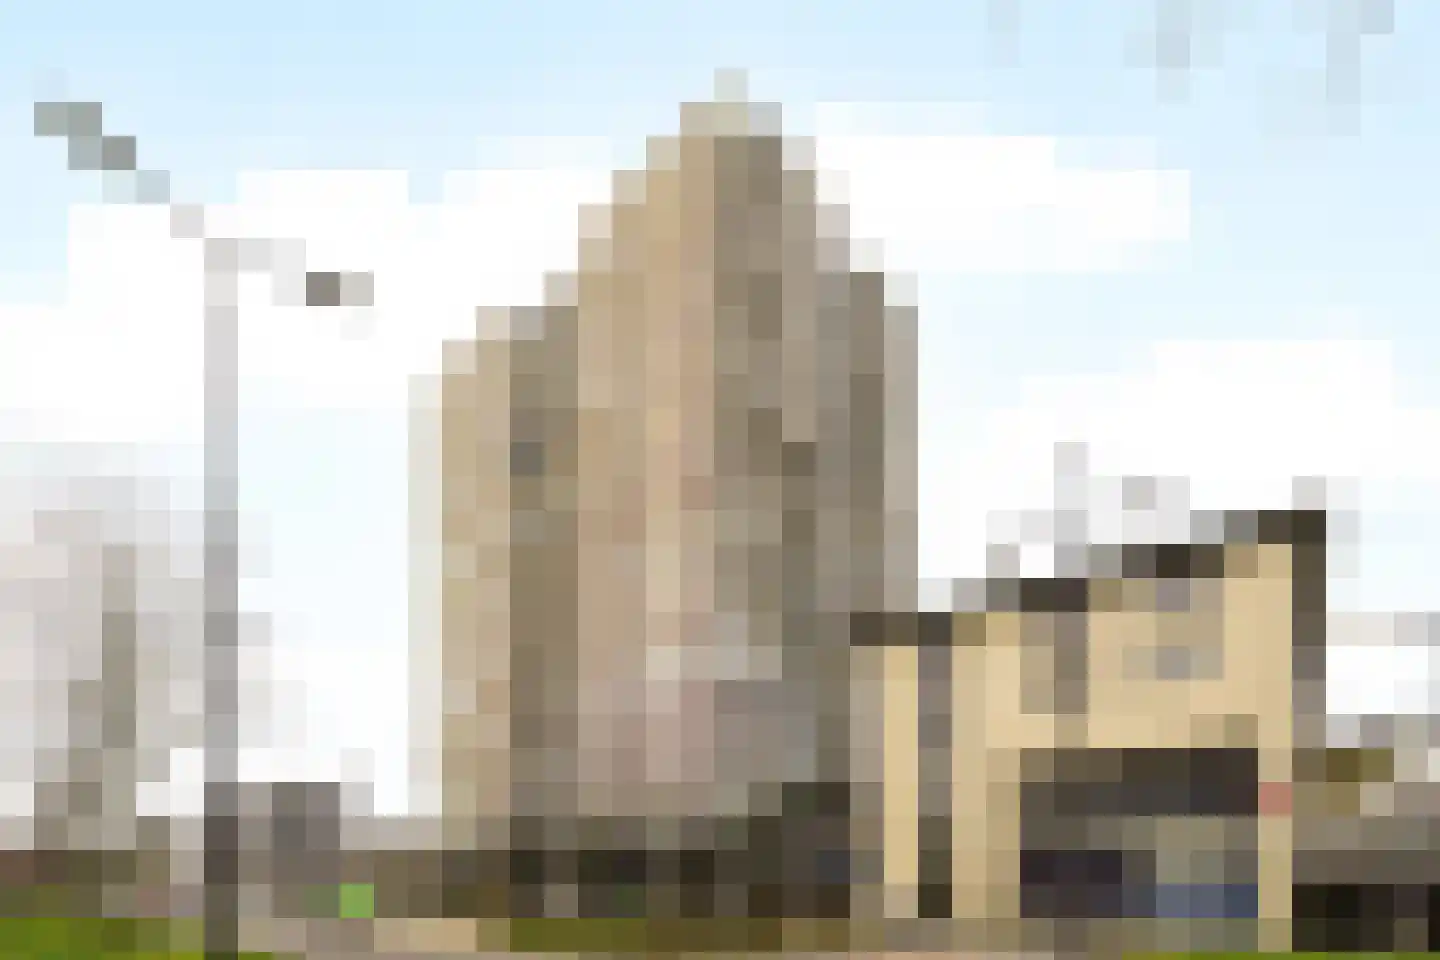
- Available
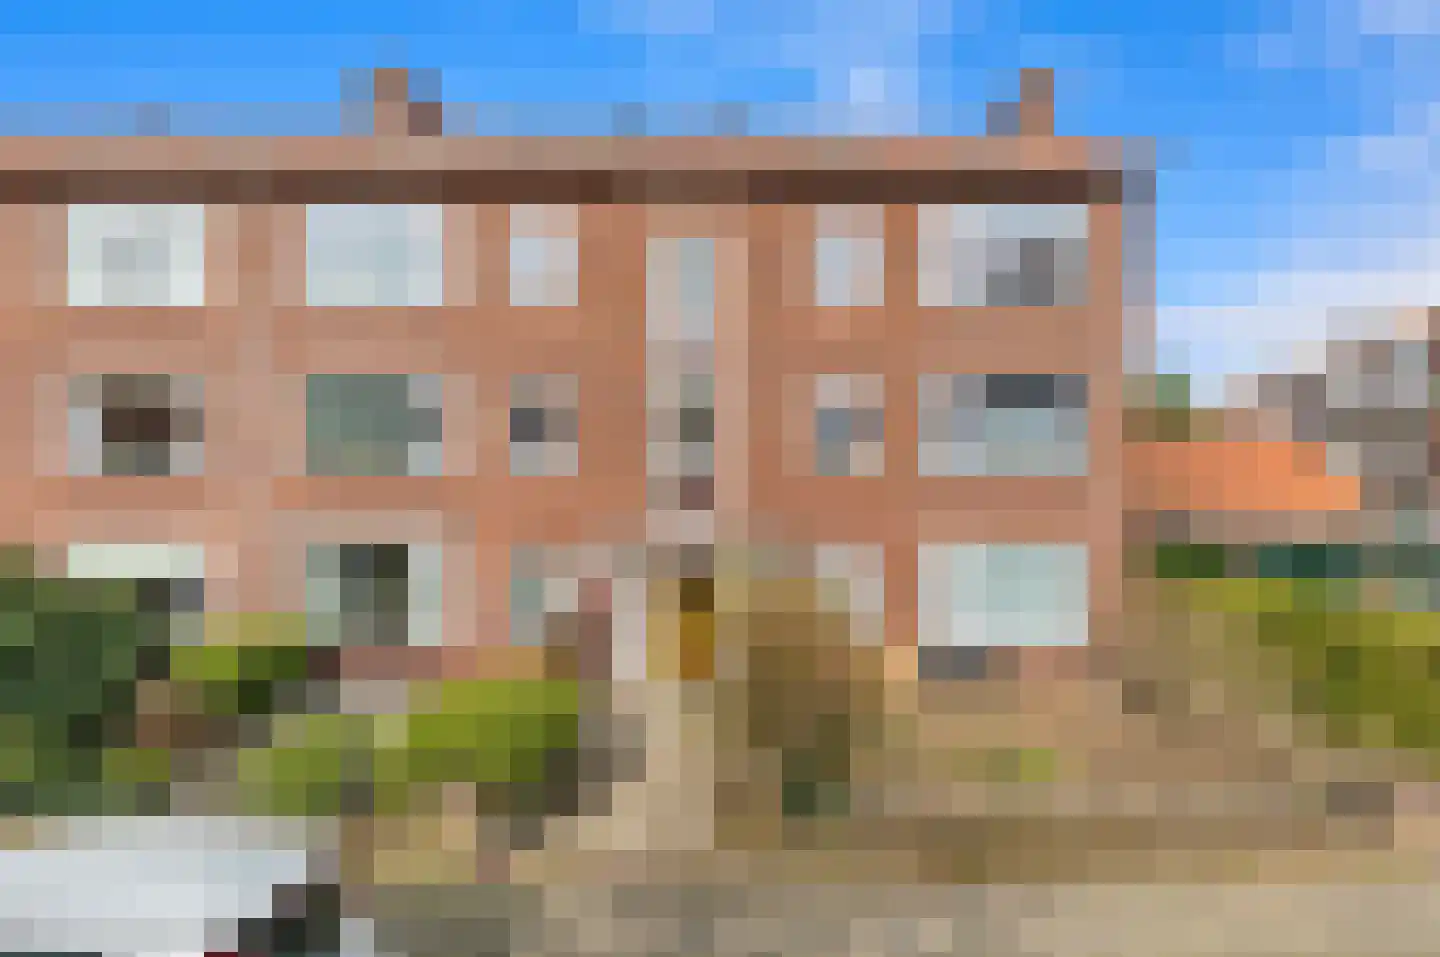
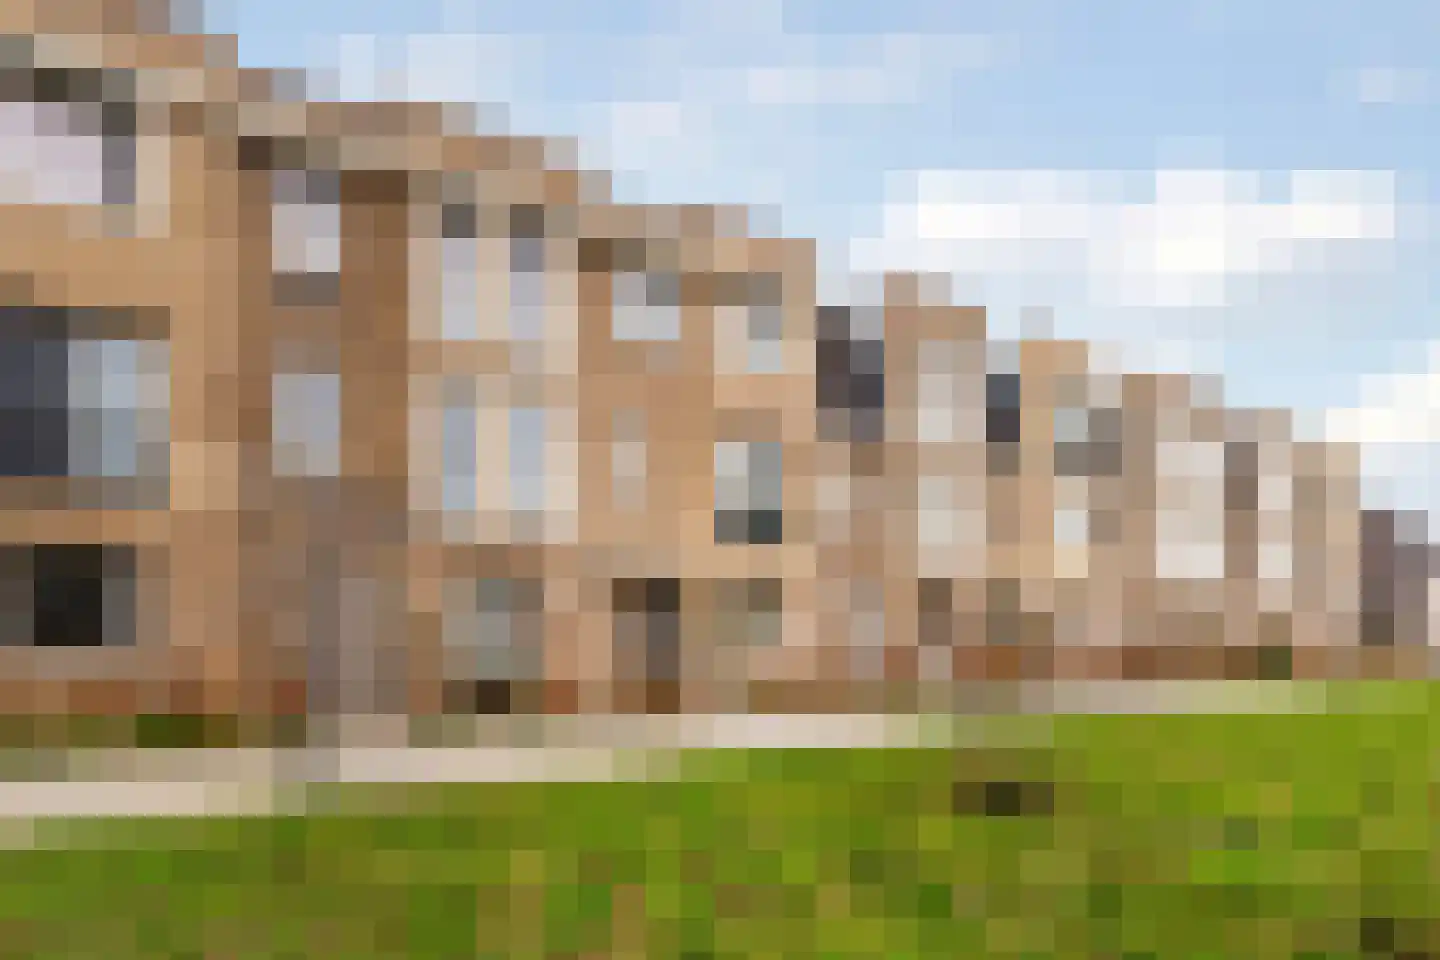
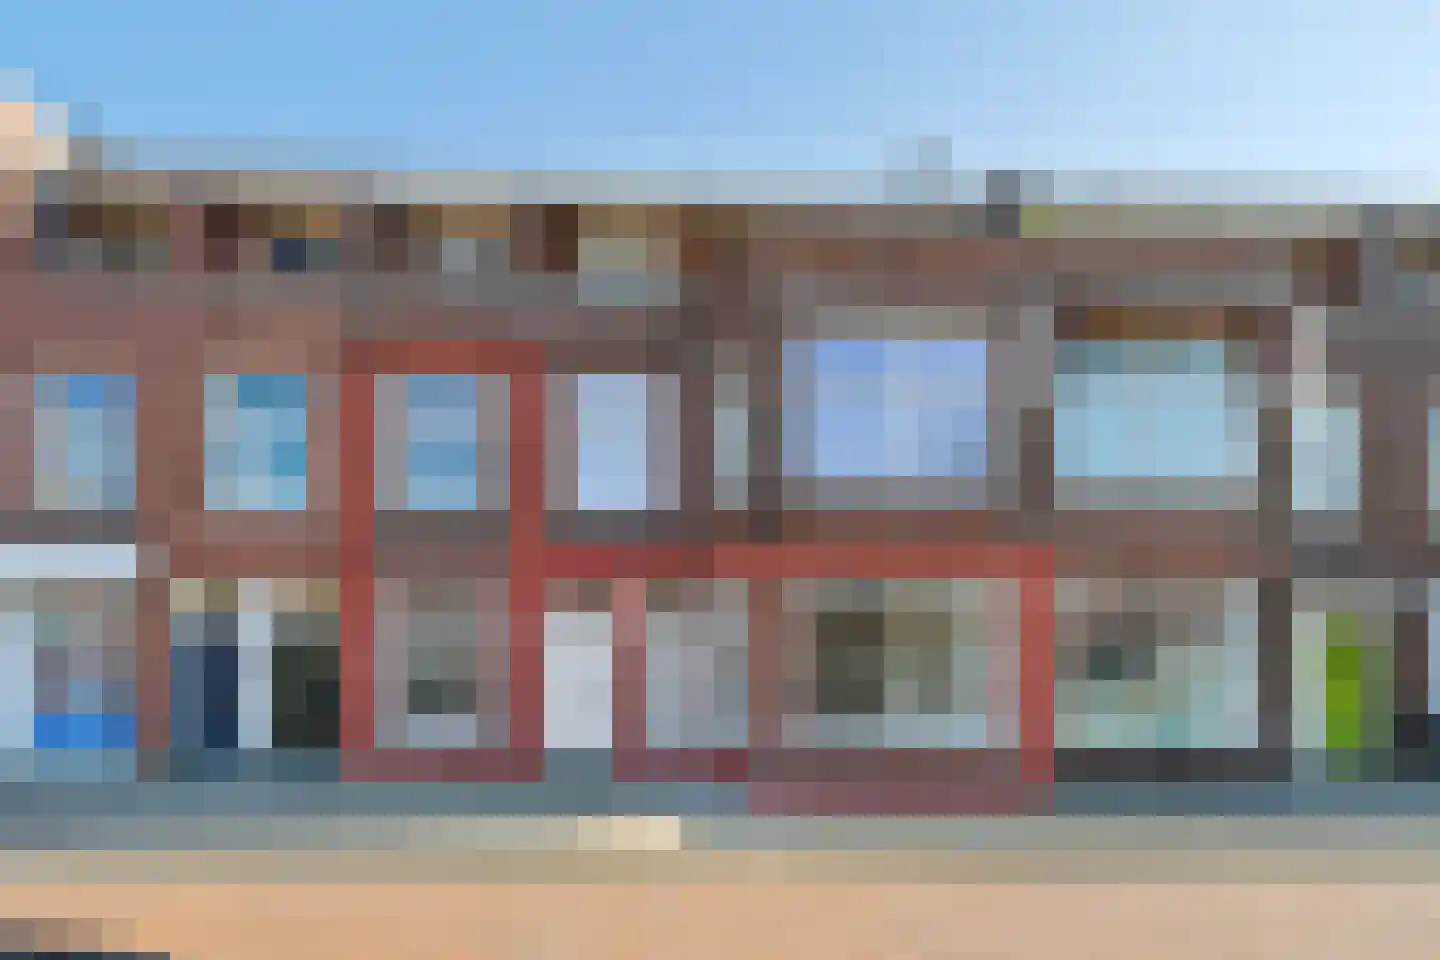
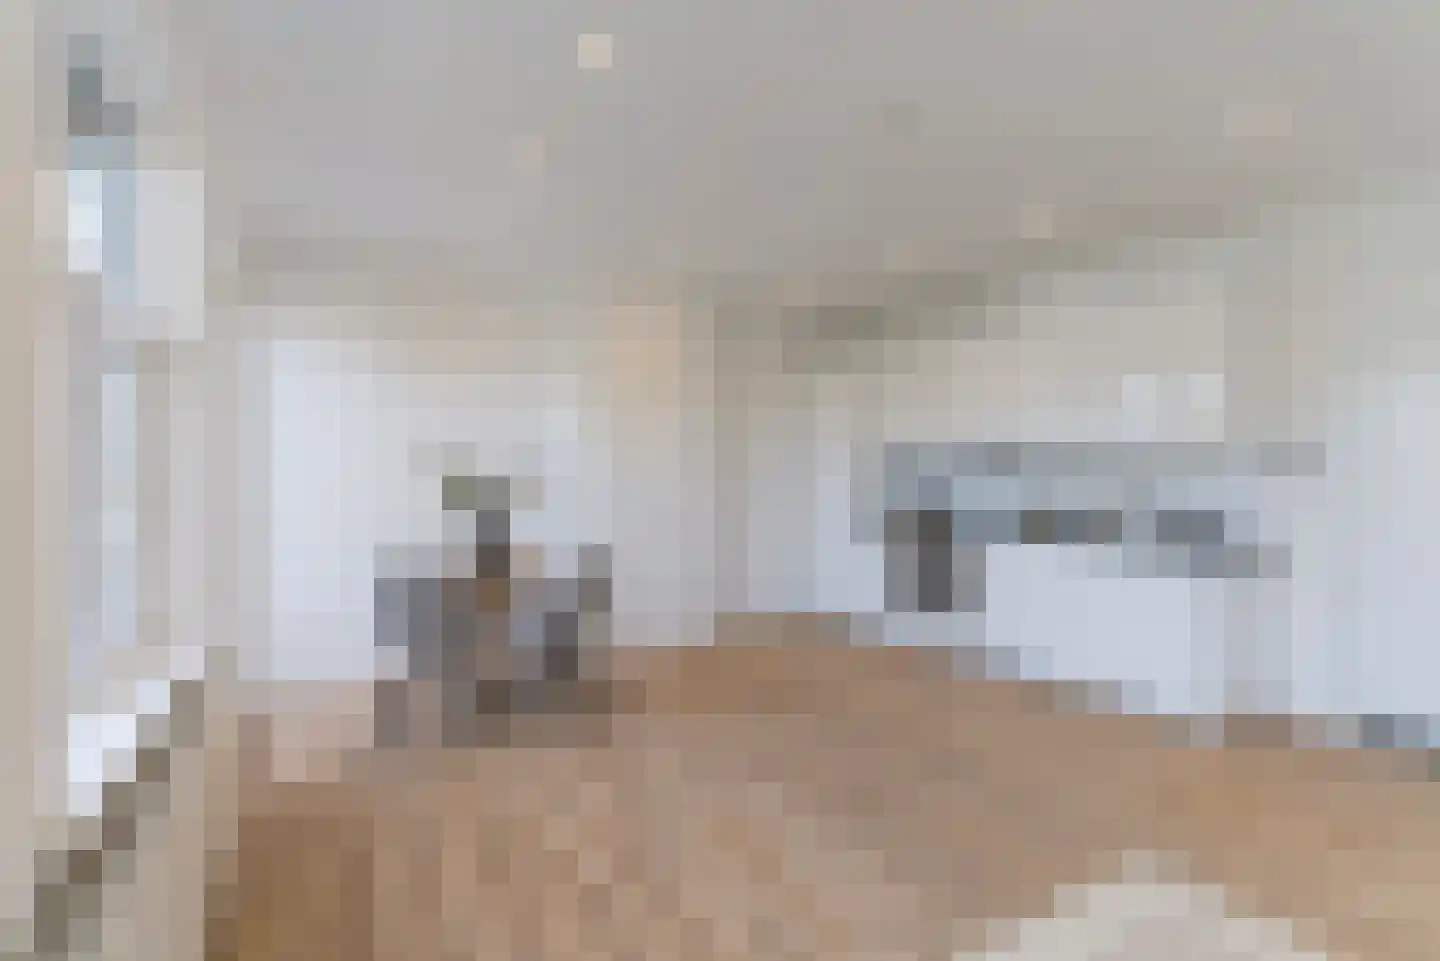
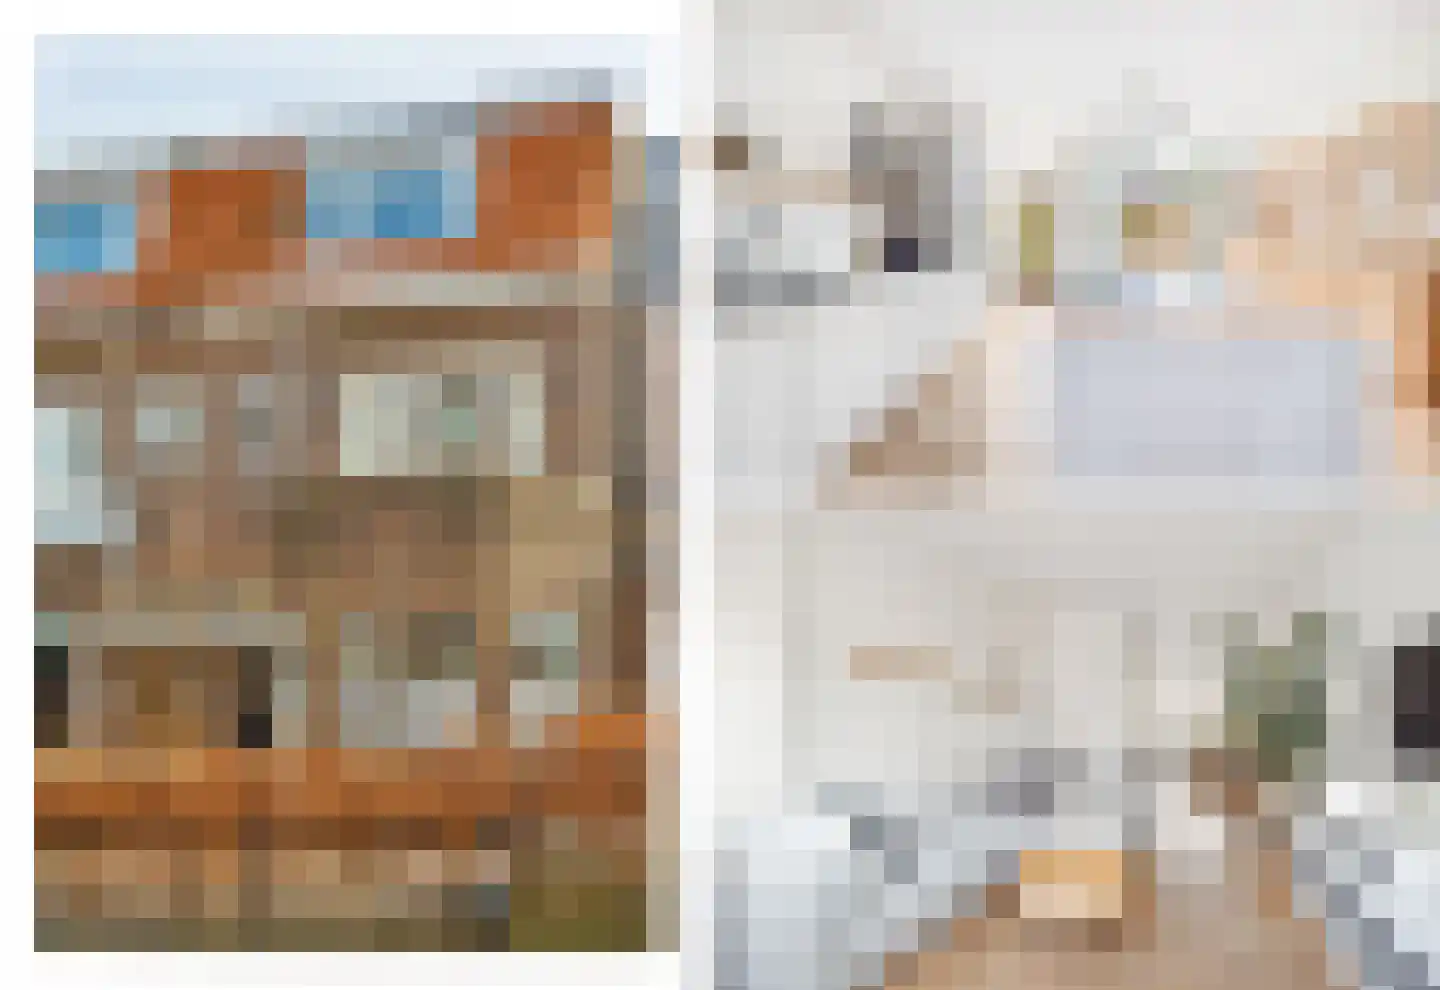
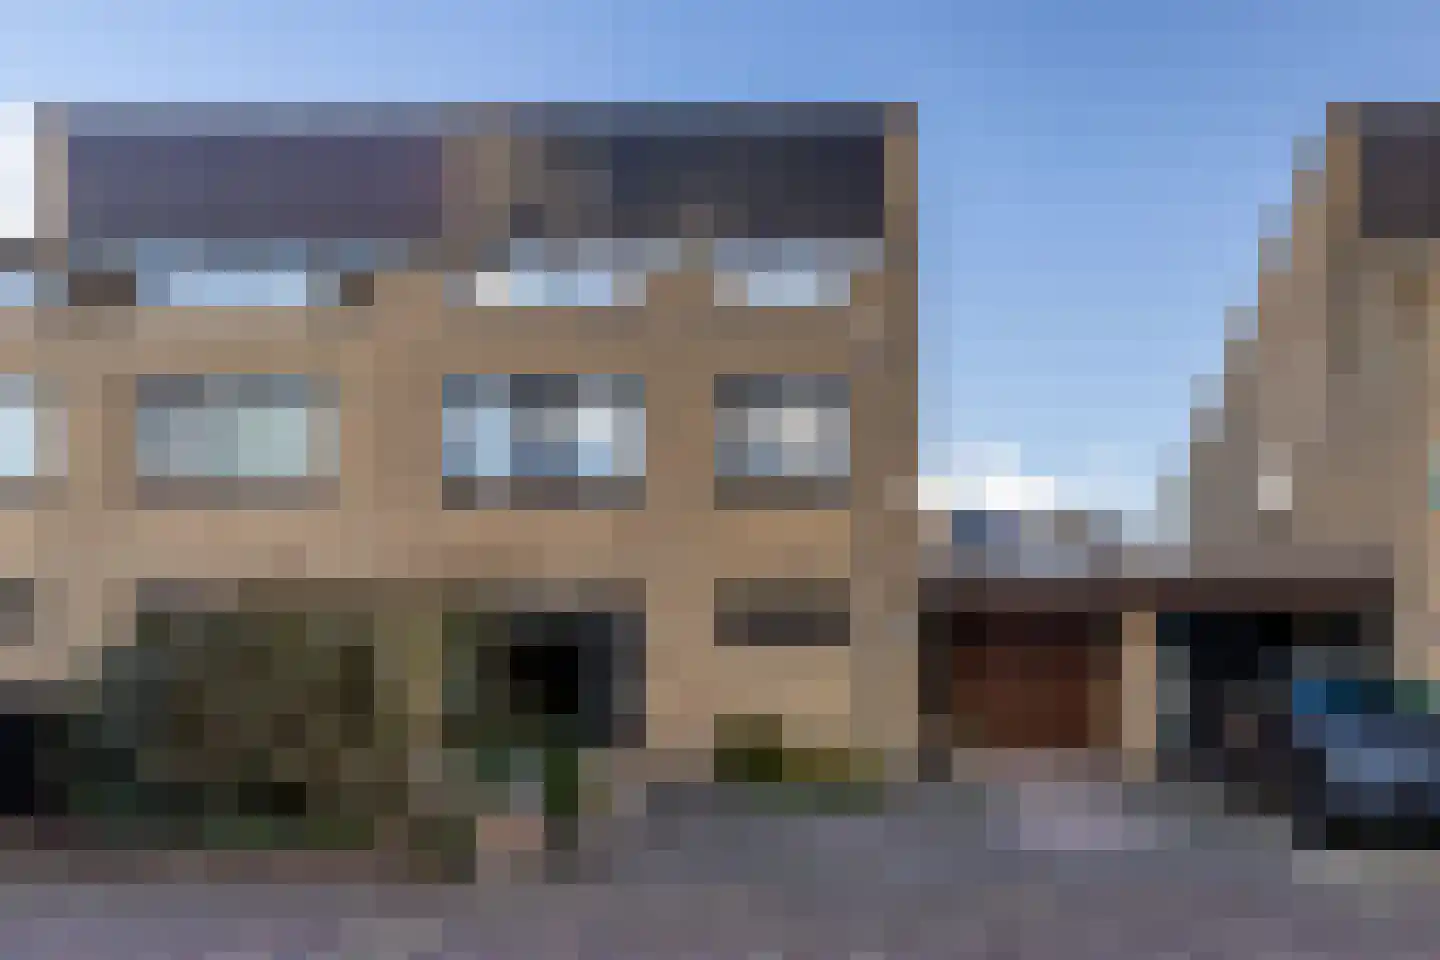
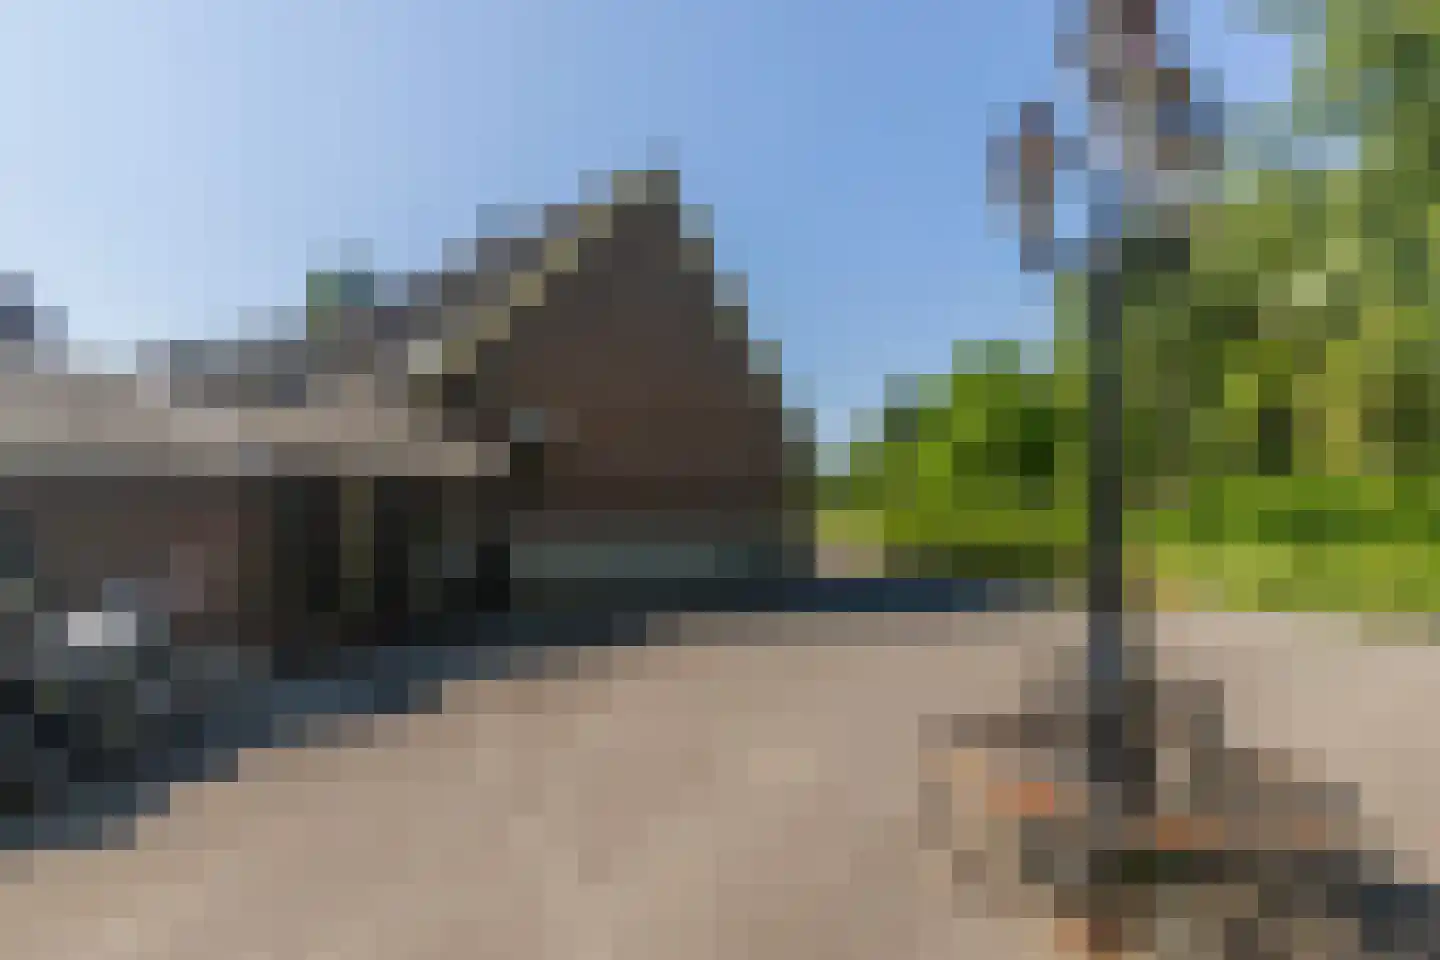
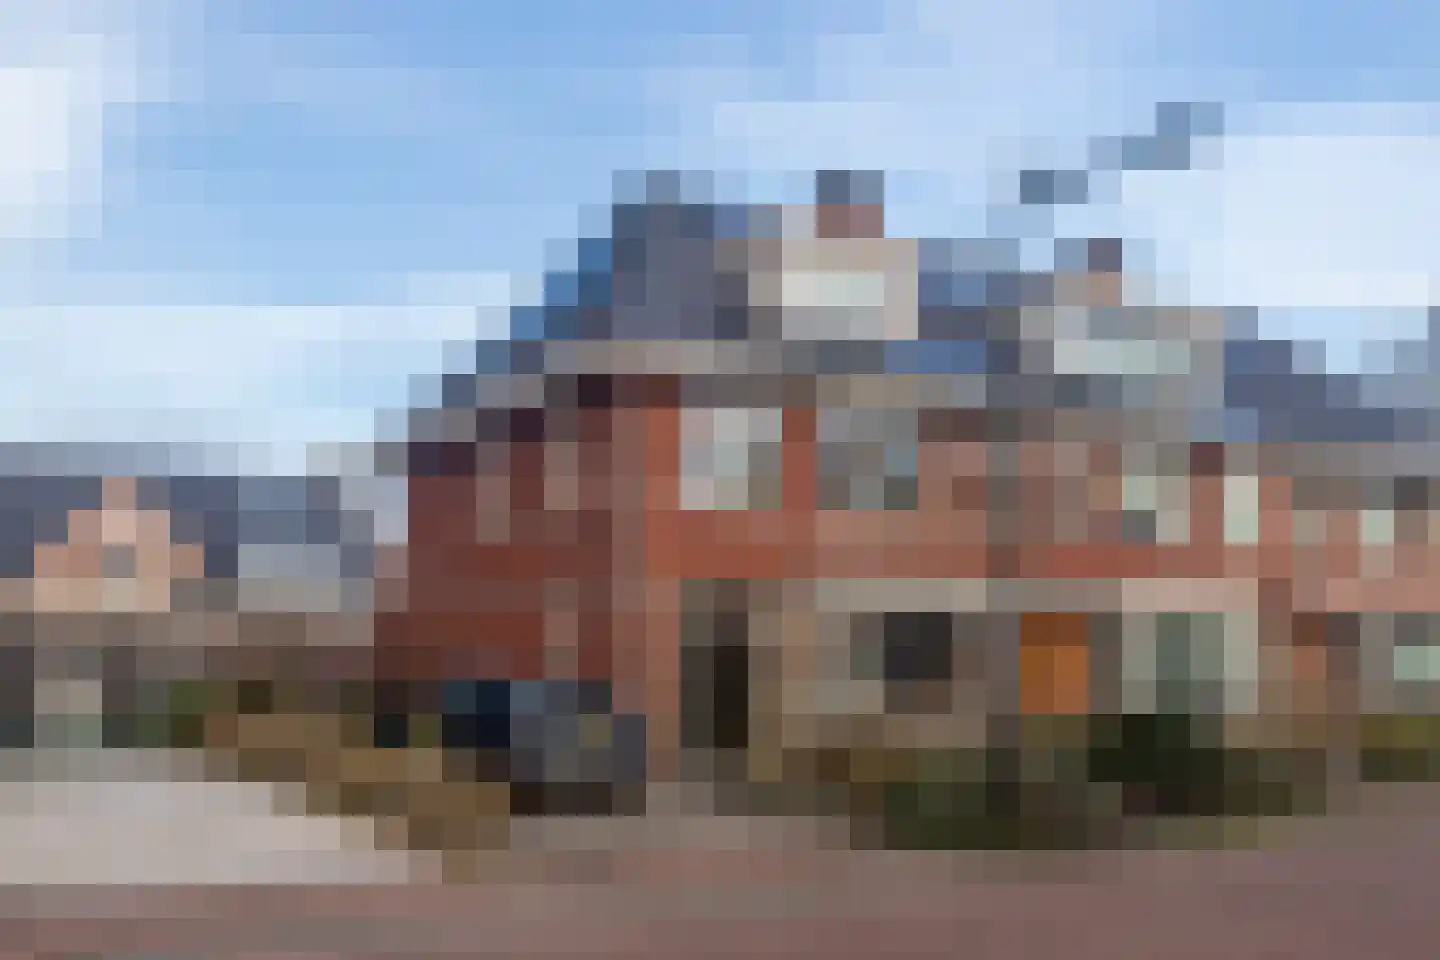
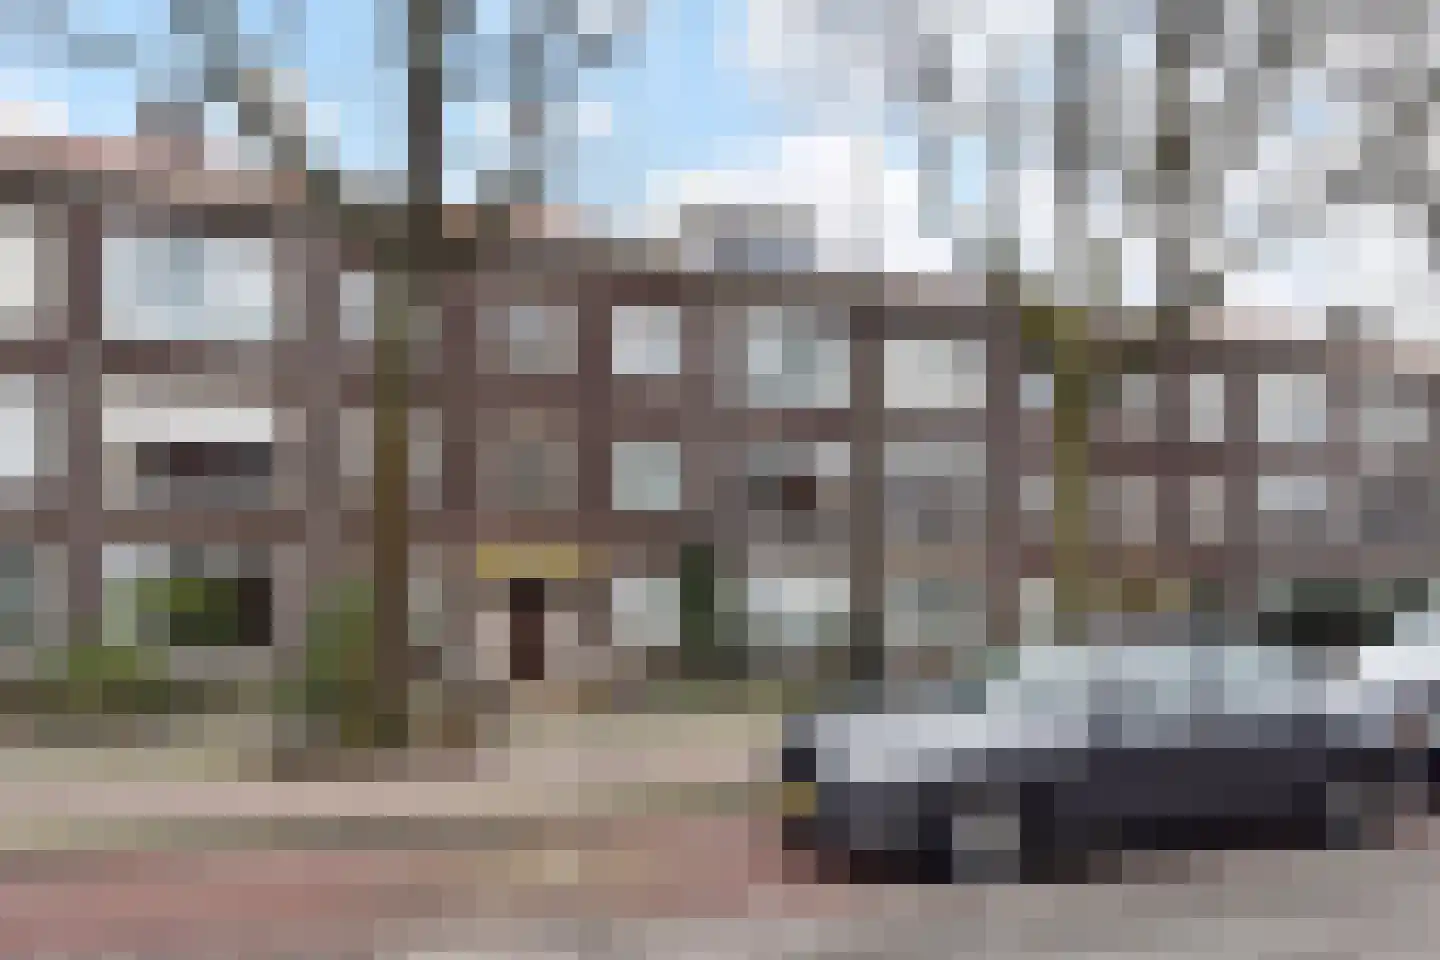
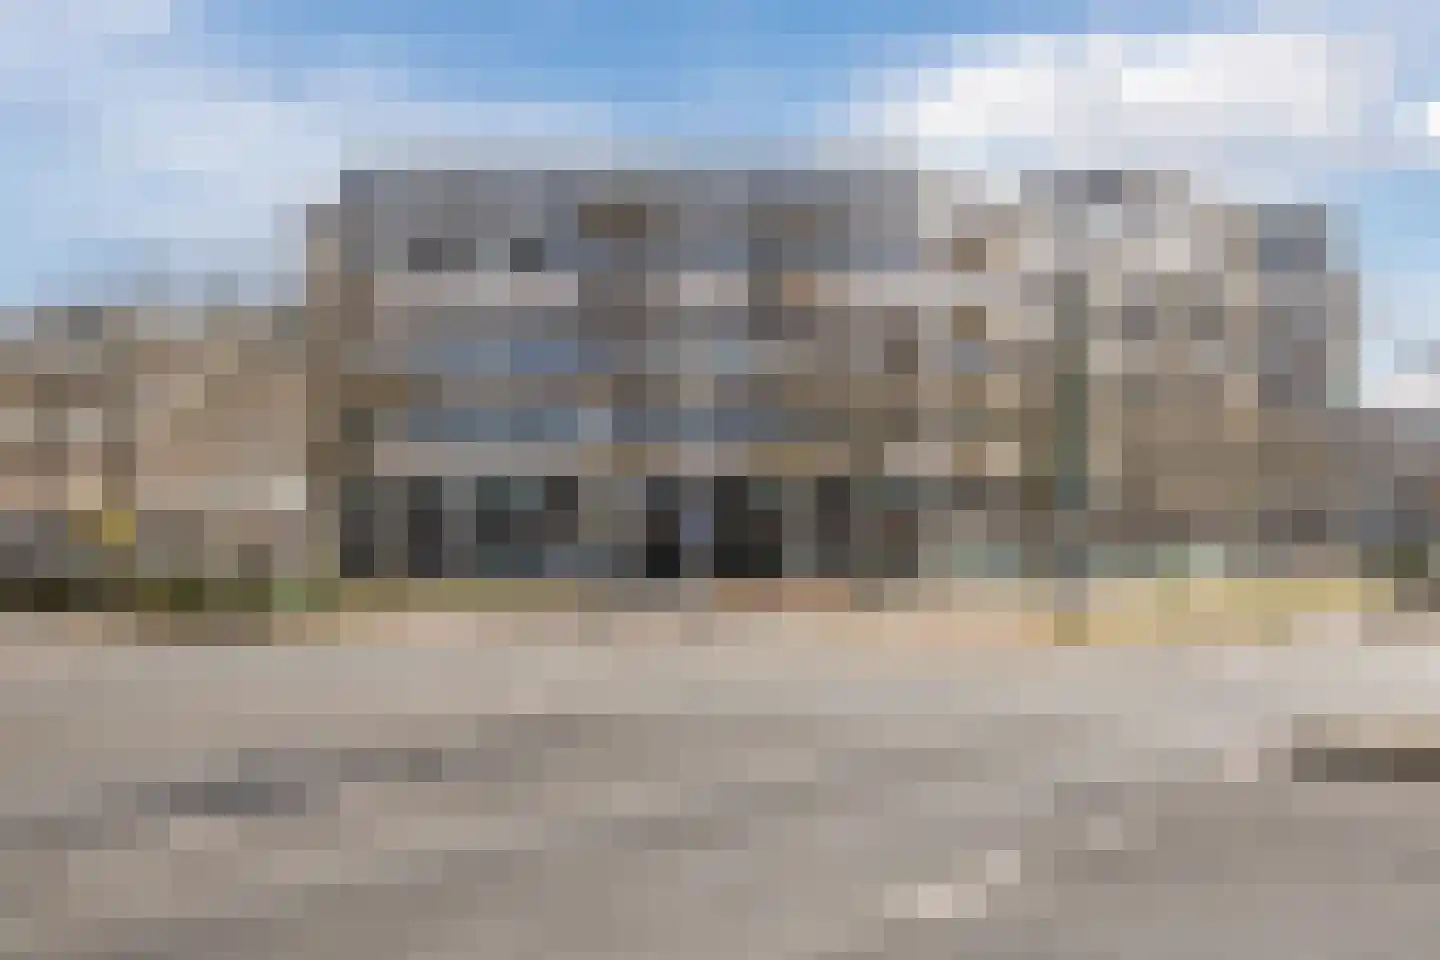
Burgemeester Elsenlaan 319 F103
2282MZ Rijswijk
€ 300.000 k.k.
€ 6.000/m²
A+
Save as favorite
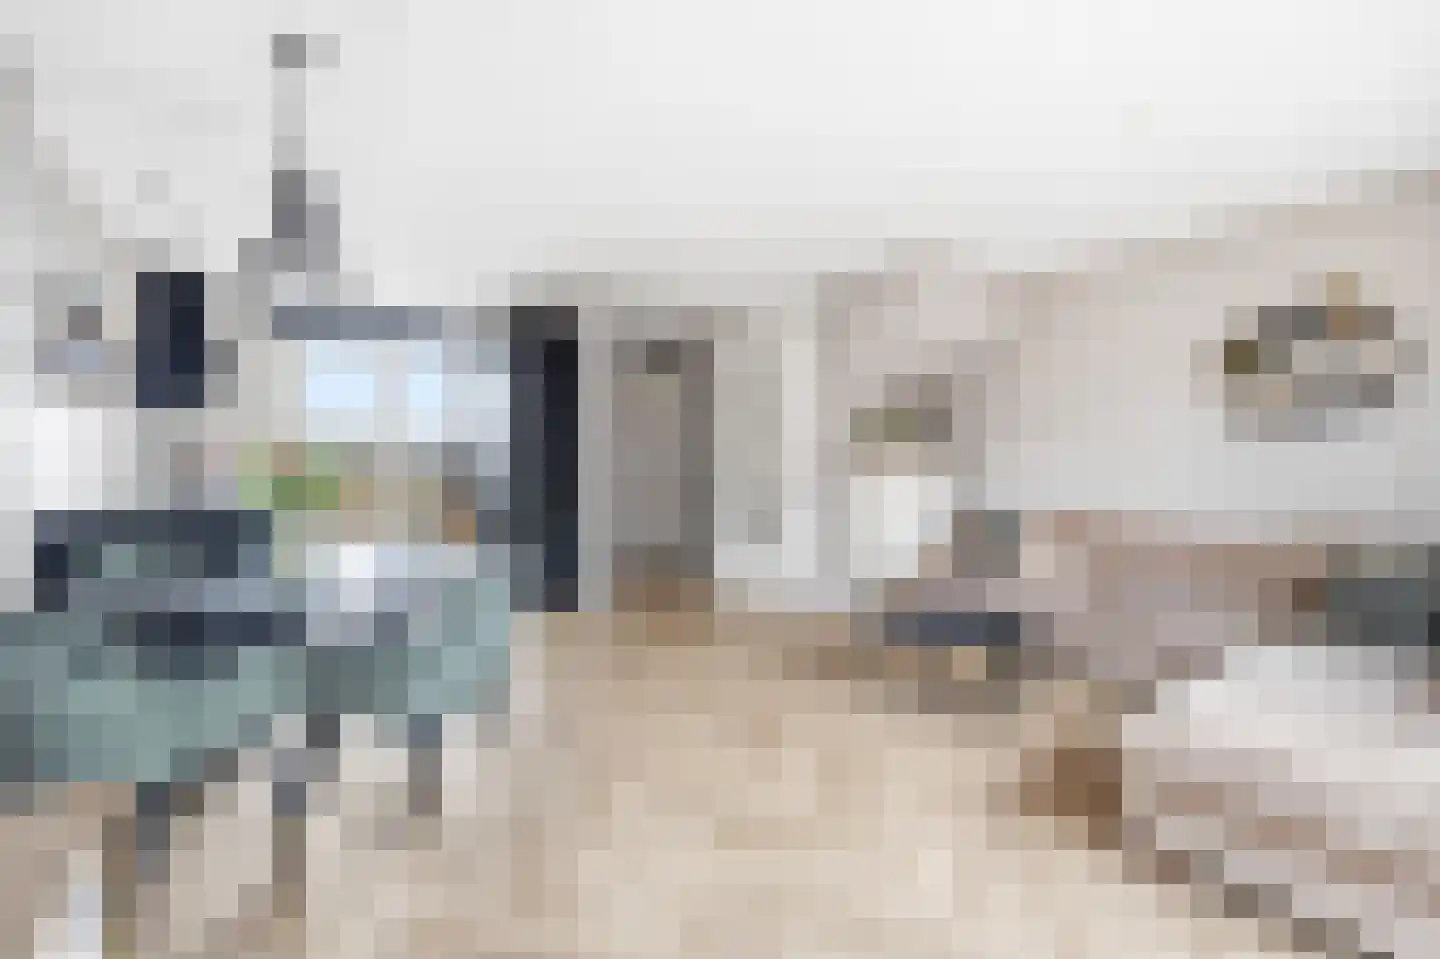
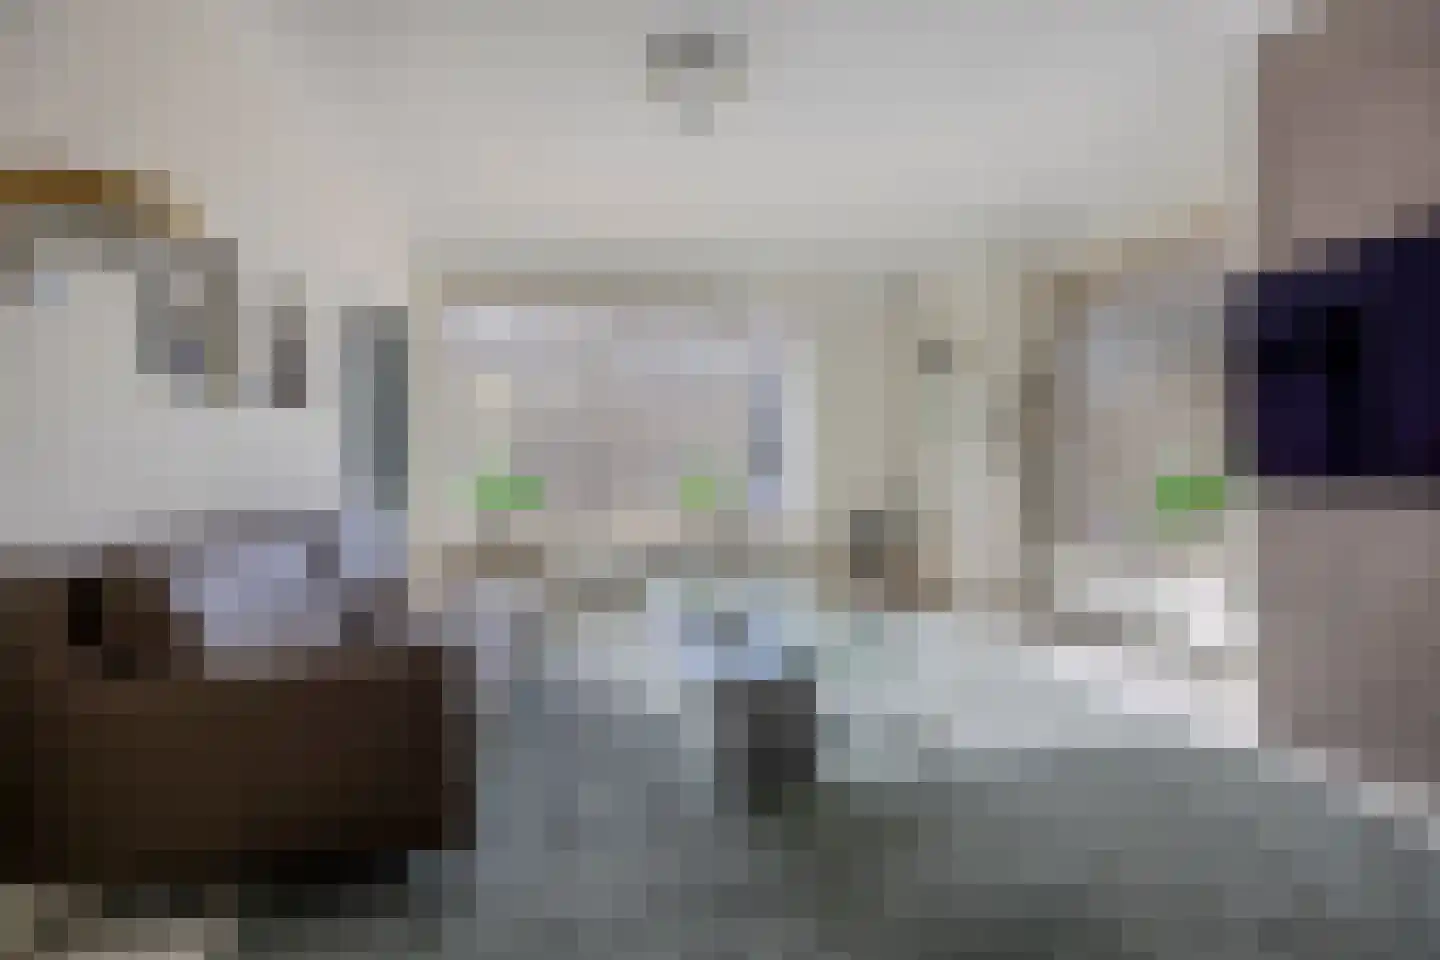
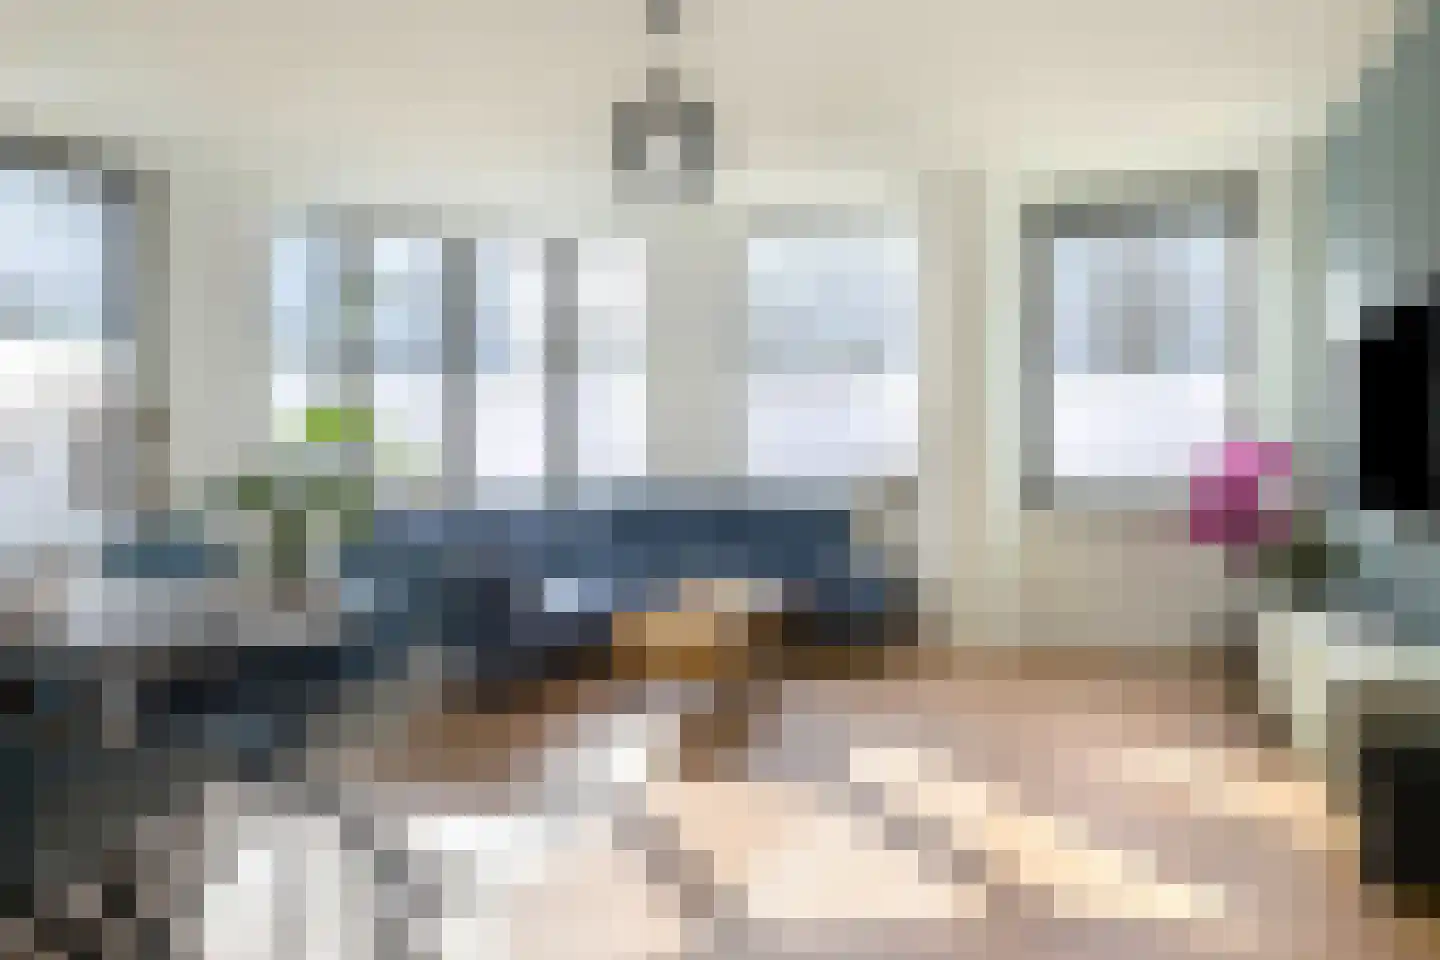
- Living area
- 50 m²
- Land area
- —
- Bedrooms
- 1