- Available
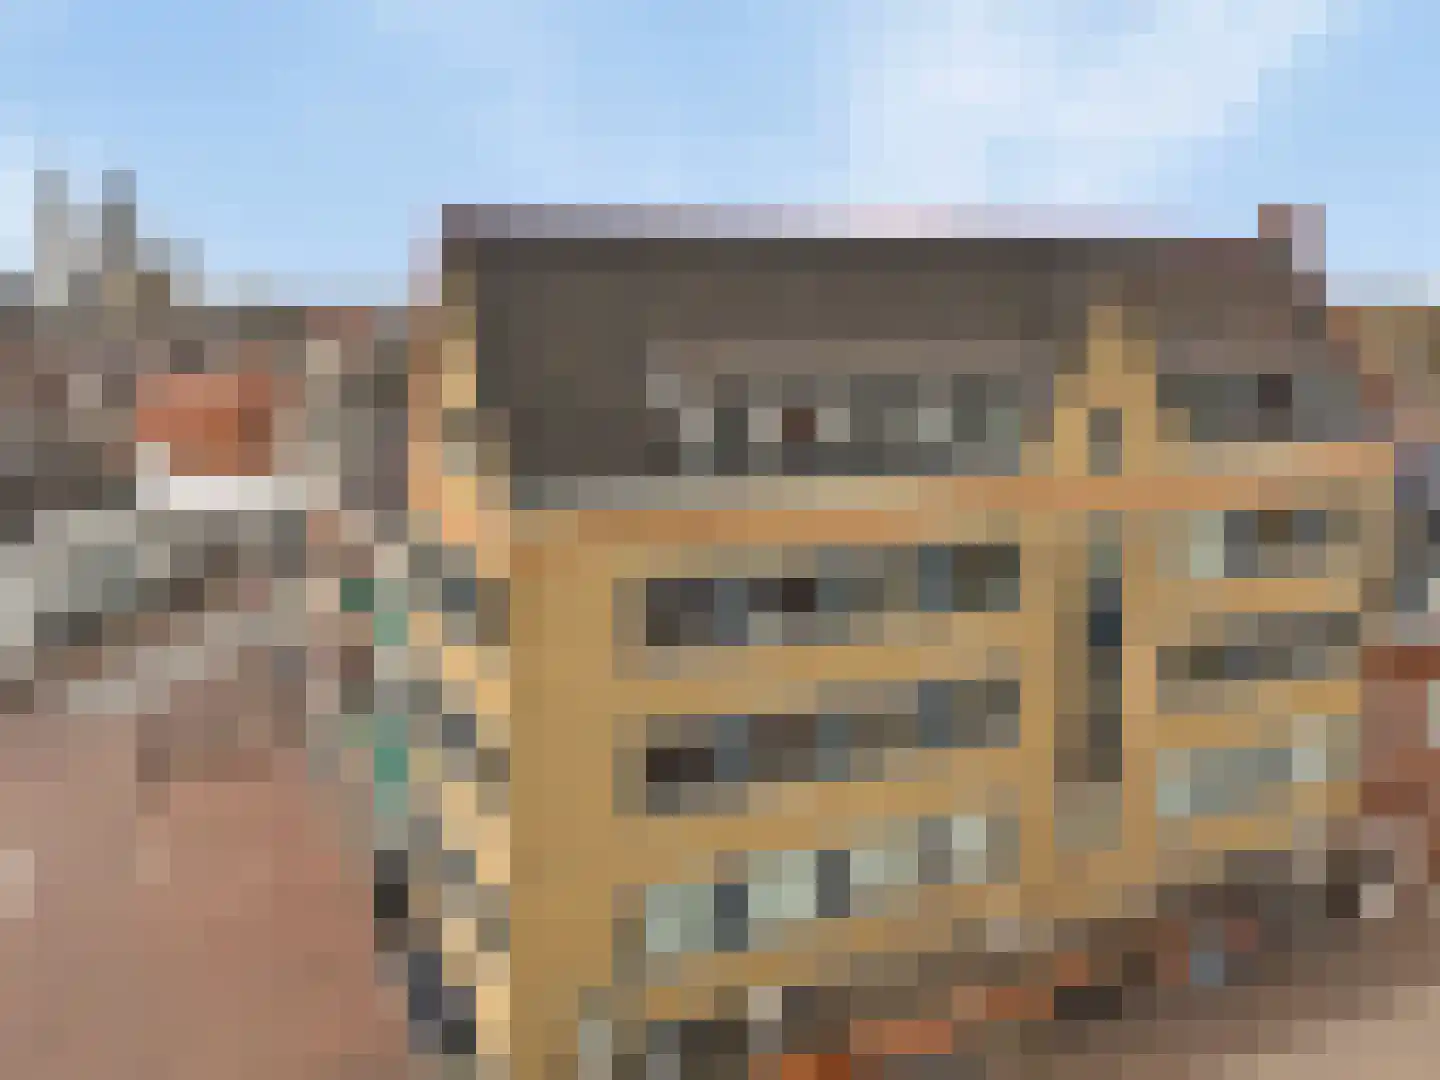
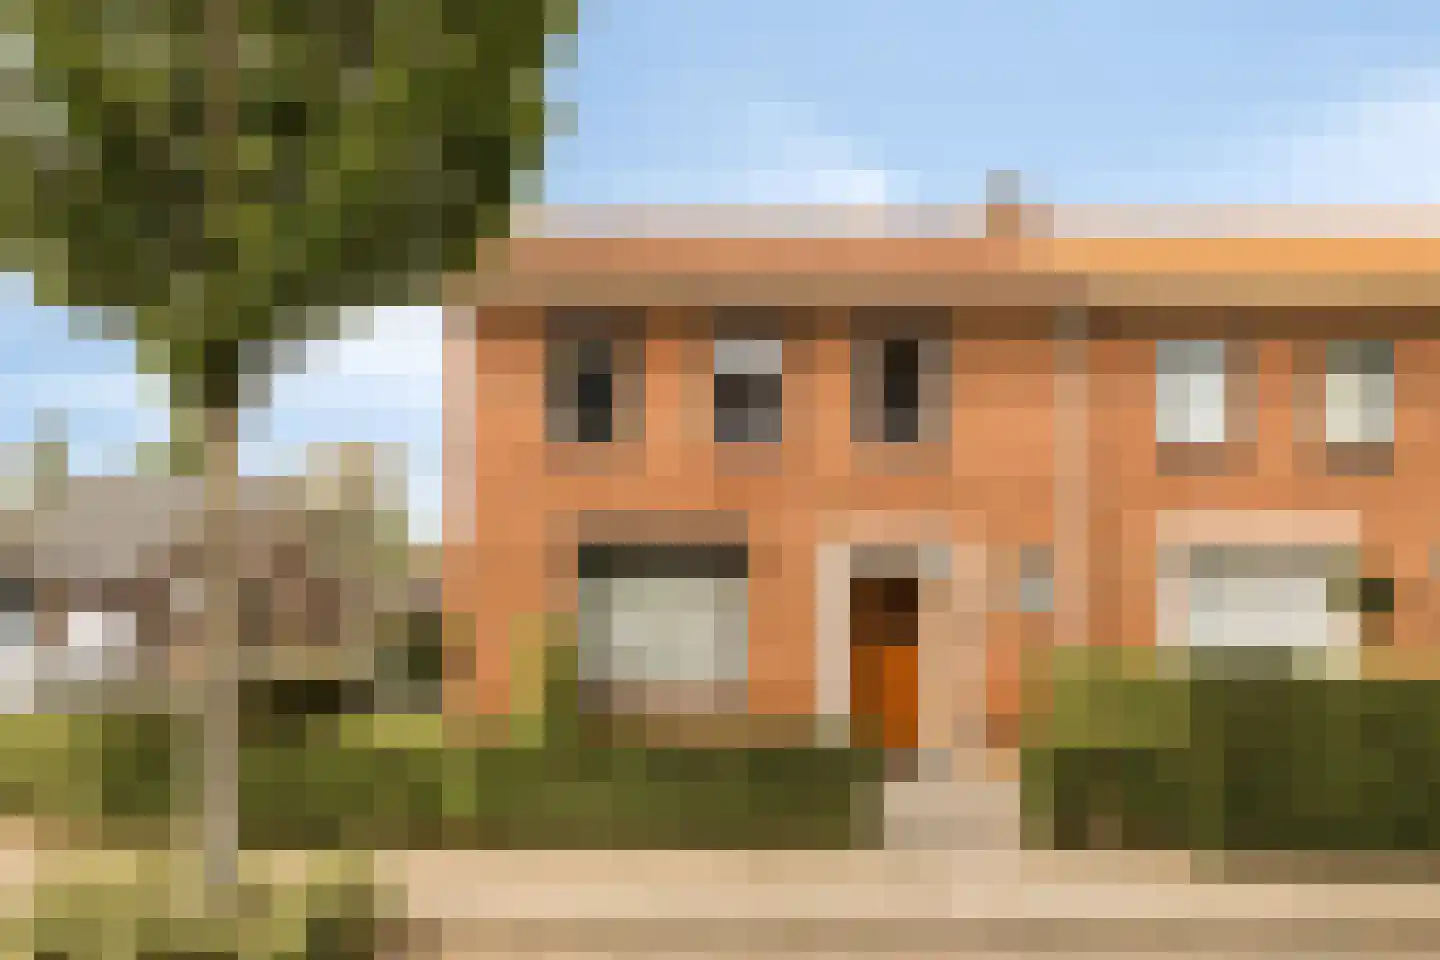
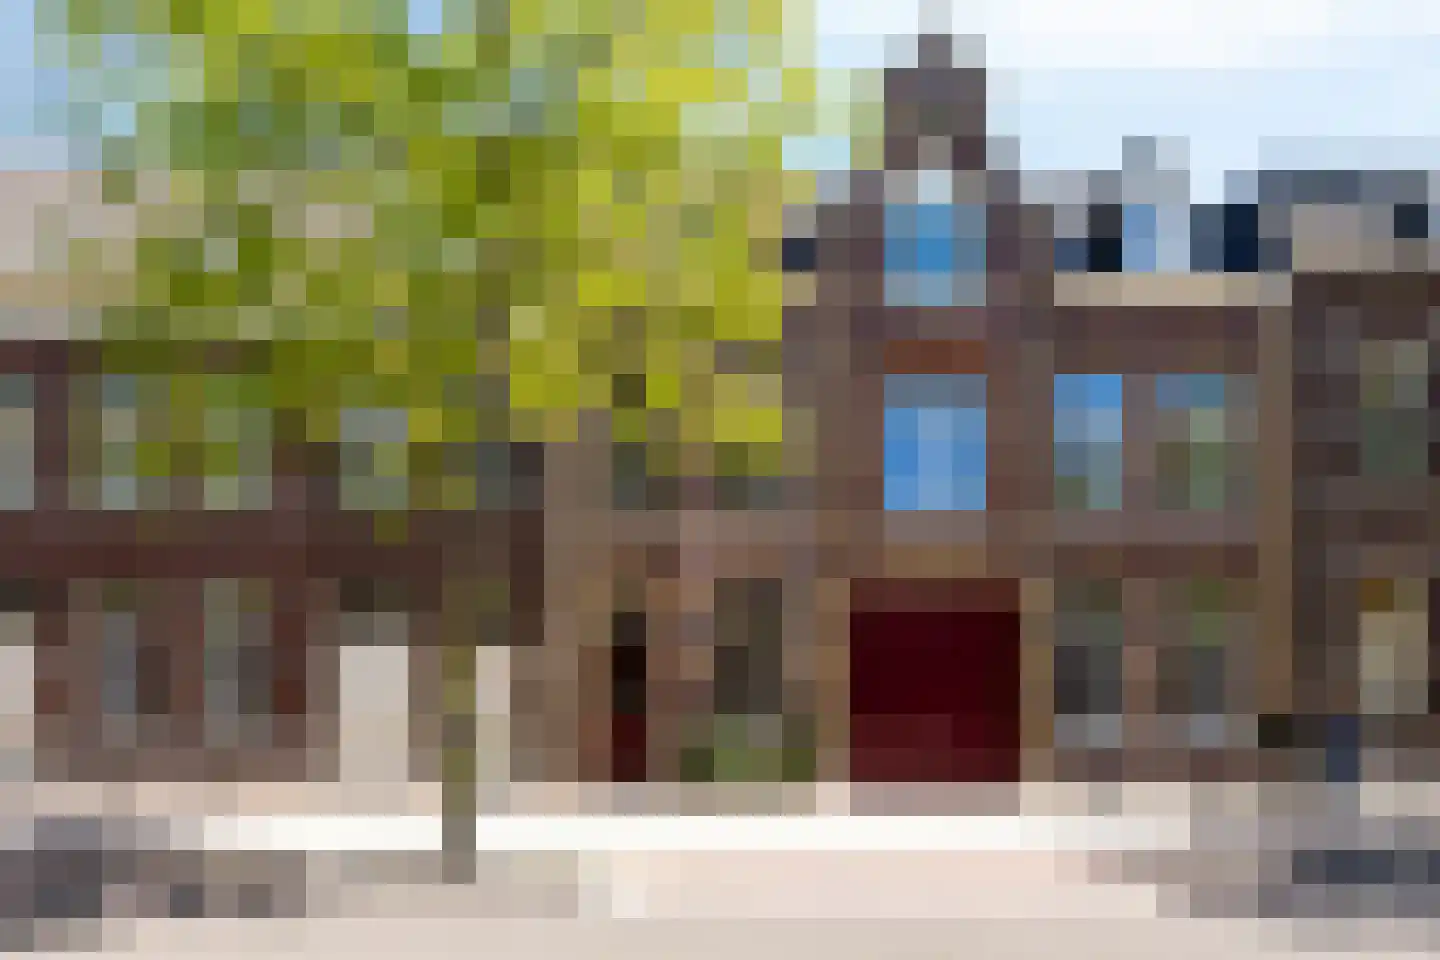
Heilige Geeststraat 14
6041GB Roermond
€ 550.000 k.k.
€ 2.022/m²
- Living area
- 272 m²
- Land area
- 114 m²
- Bedrooms
- 4
Searching in 659 houses in Roermond
Type to search. Use arrow down and arrow up to navigate through results and press Enter to open.
Hidden search suggestions.
View current properties in Roermond or search targeted on street, postal code and property characteristics.
View the current housing stock in Roermond and quickly filter by price, living area, rooms and more. There are currently 659 houses in this place within our selection. View also 368 sold houses in Roermond for extra insight into the local housing market.
6041GB Roermond
€ 550.000 k.k.
€ 2.022/m²
6041CB Roermond
€ 389.000
€ 4.576/m²
6041CB Roermond
€ 375.000
€ 4.360/m²
6041CB Roermond
€ 359.000
€ 4.224/m²
6045AE Roermond
€ 698.000 k.k.
€ 2.006/m²
6041LZ Roermond
€ 375.000 k.k.
€ 3.440/m²
6041JL Roermond
€ 350.000 k.k.
€ 1.528/m²
6041GJ Roermond
€ 495.000 k.k.
€ 4.231/m²
6041HJ Roermond
€ 279.000 k.k.
€ 2.287/m²
6041DZ Roermond
€ 315.000 k.k.
€ 4.038/m²
6041JS Roermond
€ 740 p/m
€ 13/m²
6045AJ Roermond
€ 325.000 k.k.
€ 3.571/m²
6043WX Roermond
€ 309.000 k.k.
€ 3.219/m²
6041XB Roermond
€ 500.000 k.k.
€ 3.497/m²
6044RR Roermond
€ 239.500 k.k.
€ 2.661/m²
6042HJ Roermond
€ 300.000 k.k.
€ 3.488/m²
6045AB Roermond
€ 875.000 k.k.
€ 2.114/m²
6045EX Roermond
€ 445.000 k.k.
€ 3.589/m²
6045BK Roermond
€ 389.000 k.k.
€ 2.779/m²
6043SK Roermond
€ 375.000 k.k.
€ 2.885/m²
6043SM Roermond
€ 339.000 k.k.
€ 3.260/m²
6042WC Roermond
€ 439.000 k.k.
6043XX Roermond
€ 310.000 k.k.
6041EJ Roermond
€ 425.000 k.k.
6043XS Roermond
€ 399.000 k.k.
6041GL Roermond
€ 300.000 k.k.
6042WB Roermond
€ 650.000 k.k.
6042KC Roermond
€ 350.000 k.k.
Get free quotes from real estate agents with local market knowledge. Compare more than 36 real estate agents in Roermond.
Selling a home in Roermond? View the sales-oriented guide sell a house in Roermond, compare all real estate agents in Roermond or view the top 10 real estate agents in Roermond for extra context to your choice.
Real estate agents make sharper offers when they know you're comparing — ask for quotes for sale or purchase.
Practical answers about housing supply, sales and comparing real estate agents in Roermond.
The costs of a real estate agent in Roermond depend on commission, setup costs, property presentation and the chosen service. Compare the 36 real estate agents in Roermond via the real estate agent page and request multiple quotes to compare rates and approach well.
Within our selection, we are currently showing 659 houses in Roermond. View also the sold houses in Roermond to compare the current offering with recent transactions.
Take into account not only price and living area but also maintenance, energy label, location, outdoor space and sales status. This way you compare houses in Roermond on more than just the asking price.
A local real estate agent knows the neighborhoods, recent transactions and demand in Roermond. By comparing 36 real estate agents in the region you get a better insight into prices, sales strategy and expected yield; the top 10 in Roermond provides a useful starting point.
Yes, when making a sales plan, a valuation in Roermond is wise. You gain insight into a realistic asking price and can then compare offers from real estate agents specifically.
View current location data on residents, WOZ development, housing stock, energy consumption, business activity and safety in Roermond. In 2026 were there 44.047 residents. The average WOZ value in 2025 is EUR 293.330.
These figures help to better assess and compare the housing stock in Roermond with recent sold homes. Orient yourself then on suitable top real estate agents in Roermond for sales advice in this region.
Residents
44.047
Last year: 2026
Average WOZ
EUR 293.330
Last year: 2025
Average income per person.
EUR 31.106
Source: AllNumbers
Crimes (current year)
3.816
Total registered
| Year | Residents |
|---|---|
| 2021 | 41.990 |
| 2022 | 42.310 |
| 2023 | 42.880 |
| 2024 | 43.480 |
| 2025 | 43.940 |
| 2026 | 44.047 |
| Year | Average WOZ |
|---|---|
| 2021 | EUR 214.372 |
| 2022 | EUR 229.567 |
| 2023 | EUR 272.415 |
| 2024 | EUR 274.188 |
| 2025 | EUR 293.330 |
Hoger
9.760
Praktisch
10.320
Middelbaar
13.220
Europa
7.080
Nederland
26.255
Buiten Europa
10.590
Label C
5.576
Label A
5.559
Label B
3.906
Label D
2.147
Label F
1.707
Label G
1.539
Label E
1.450
Label A+
525
Label A+++
481
Label A++++
318
Label A++
187
Label A+++++
0
| Year | Gas (m3) | Electricity (kWh) |
|---|---|---|
| 2020 | 1.134 | 2.644 |
| 2021 | 1.282 | 2.655 |
| 2022 | 985 | 2.526 |
| 2023 | 829 | 2.415 |
| 2024 | 809 | 2.472 |
Hoekwoning
Gas: 1.007 • Electricity: 2.808
Huurwoning
Gas: 694 • Electricity: 1.981
Koopwoning
Gas: 987 • Electricity: 2.878
Appartement
Gas: 617 • Electricity: 1.807
Tussenwoning
Gas: 882 • Electricity: 2.580
Vrijstaande woning
Gas: 1.386 • Electricity: 3.864
Twee-onder-één-kap woning
Gas: 1.139 • Electricity: 2.984
Total number of company establishments: 5.765
| Period | Crimes |
|---|---|
| jan 2026 | 274 |
| jul 2025 | 309 |
| jun 2025 | 317 |
| mei 2025 | 326 |
| mrt 2025 | 312 |
| mrt 2026 | 264 |
| nov 2024 | 304 |
| nov 2025 | 293 |
| okt 2024 | 384 |
| okt 2025 | 292 |
| sep 2024 | 305 |
| sep 2025 | 273 |
These figures give an indicative picture of safety trends in the living environment of Roermond.
Short answers based on current local statistics, handy for a quick comparison of the living environment.
Roermond telt in 2026 ongeveer 44.047 inwoners.
De gemiddelde WOZ-waarde in Roermond is in 2025 circa € 293.330.
Het gemiddelde inkomen per inwoner in Roermond ligt rond € 31.106 per jaar.
Voor het huidige jaar gaat het om ongeveer 3.816 geregistreerde misdrijven. Gebruik deze cijfers als indicatie en vergelijk trends per periode.
In Roermond komt vooral "Appartementen" veel voor, met ongeveer 9.683 woningen.