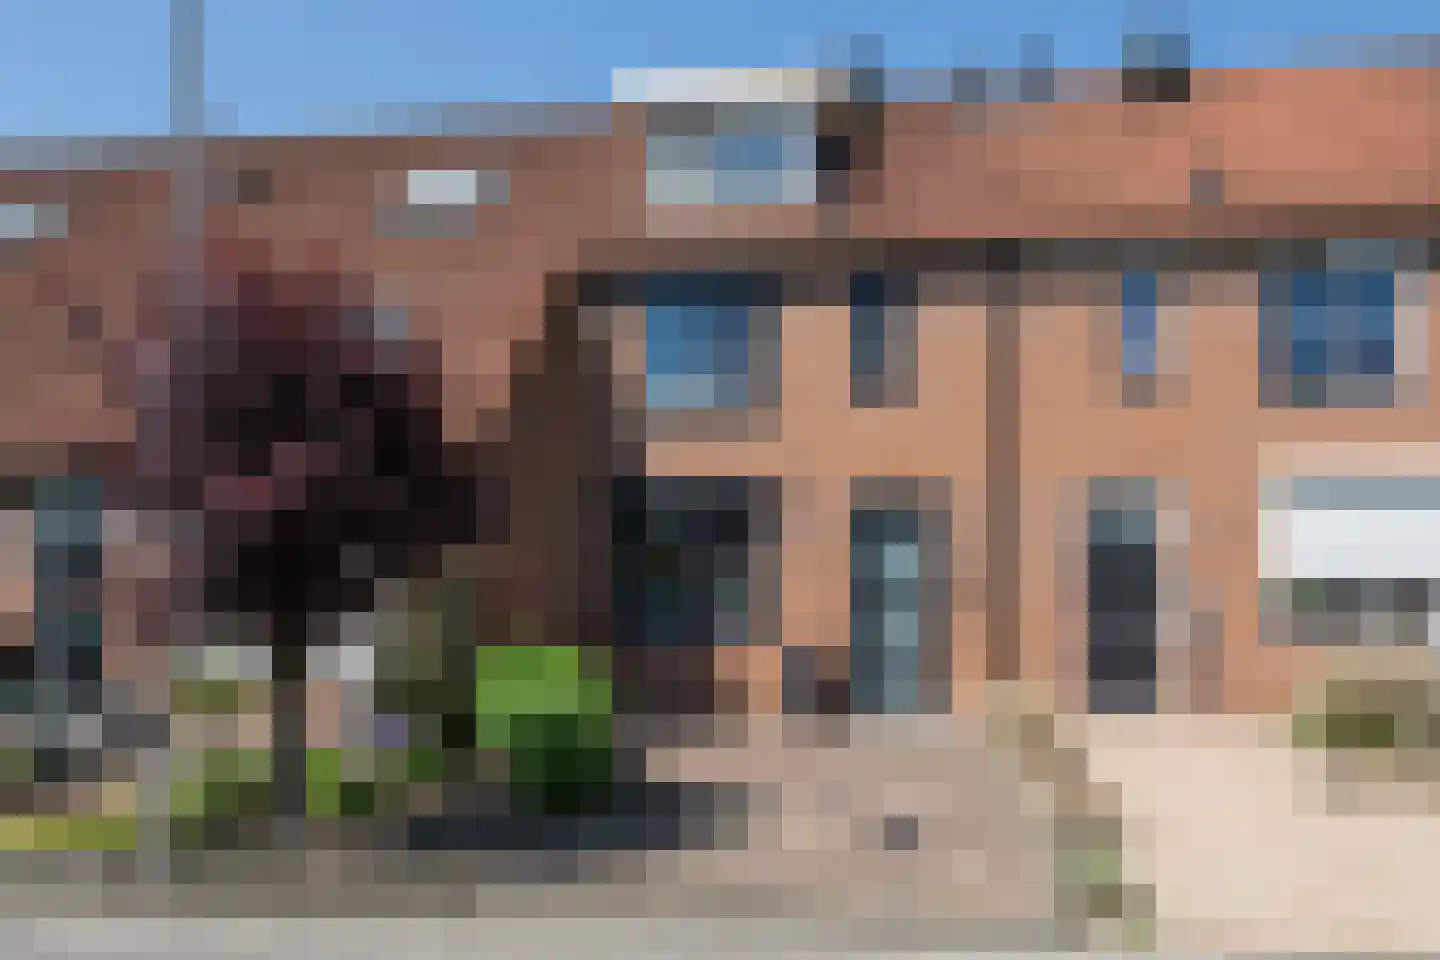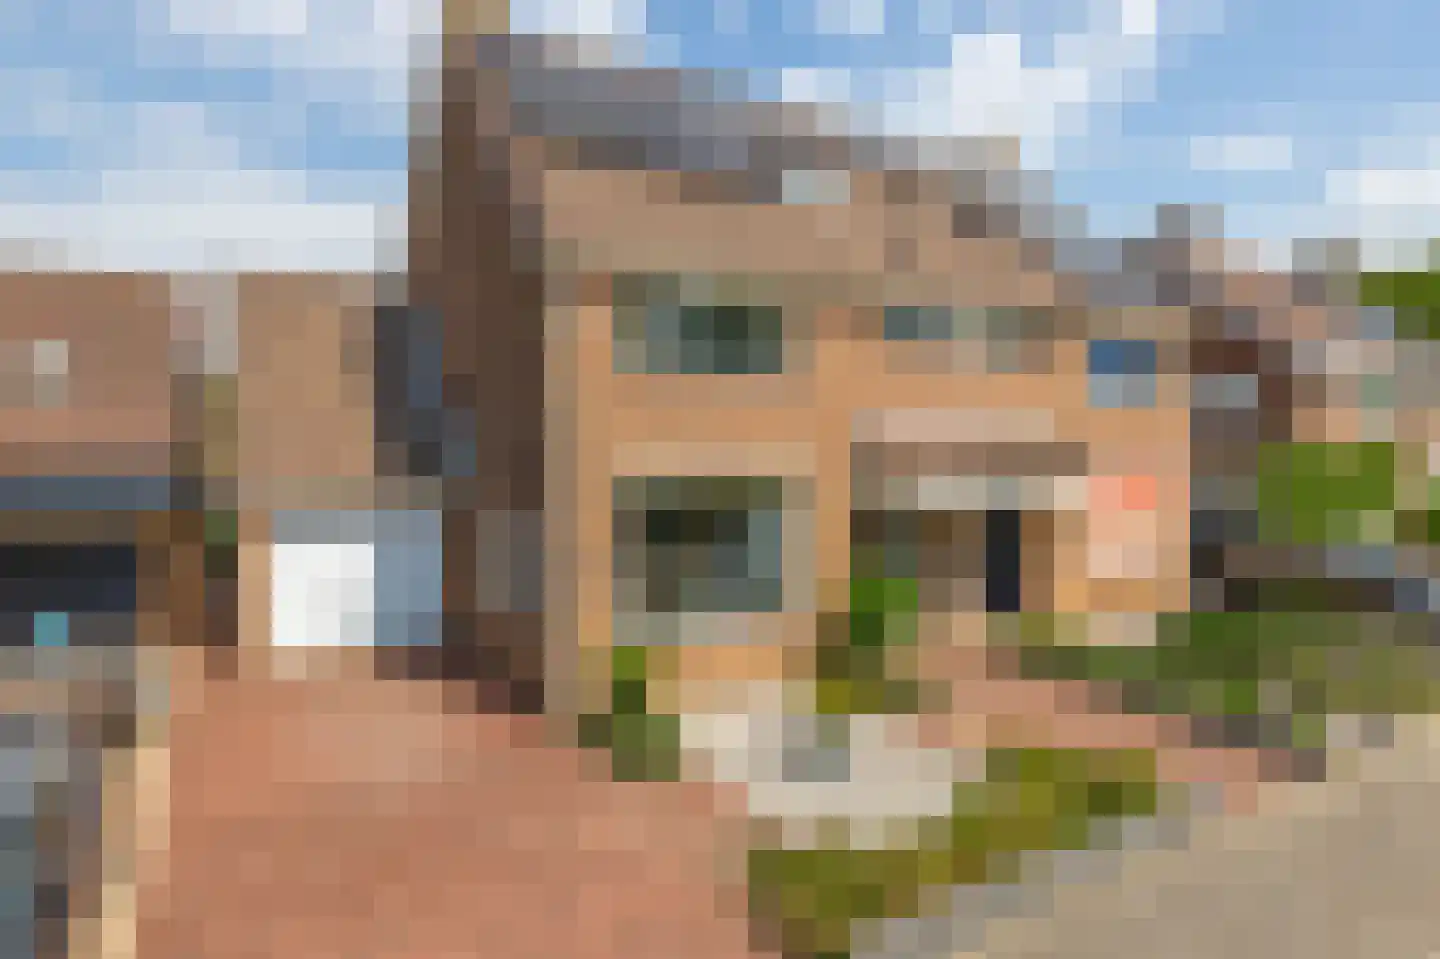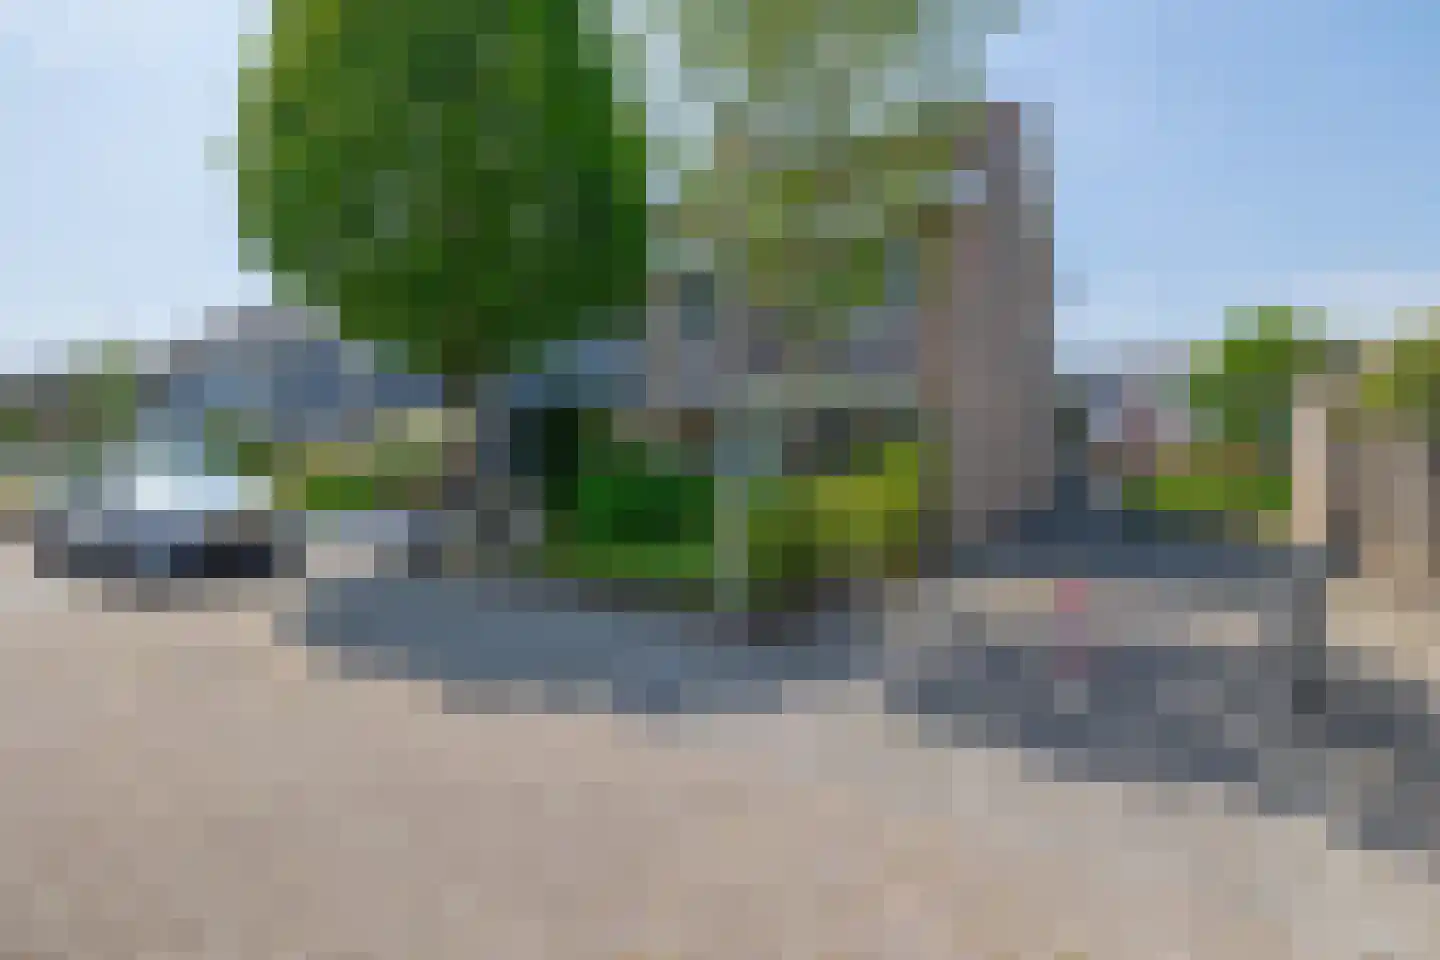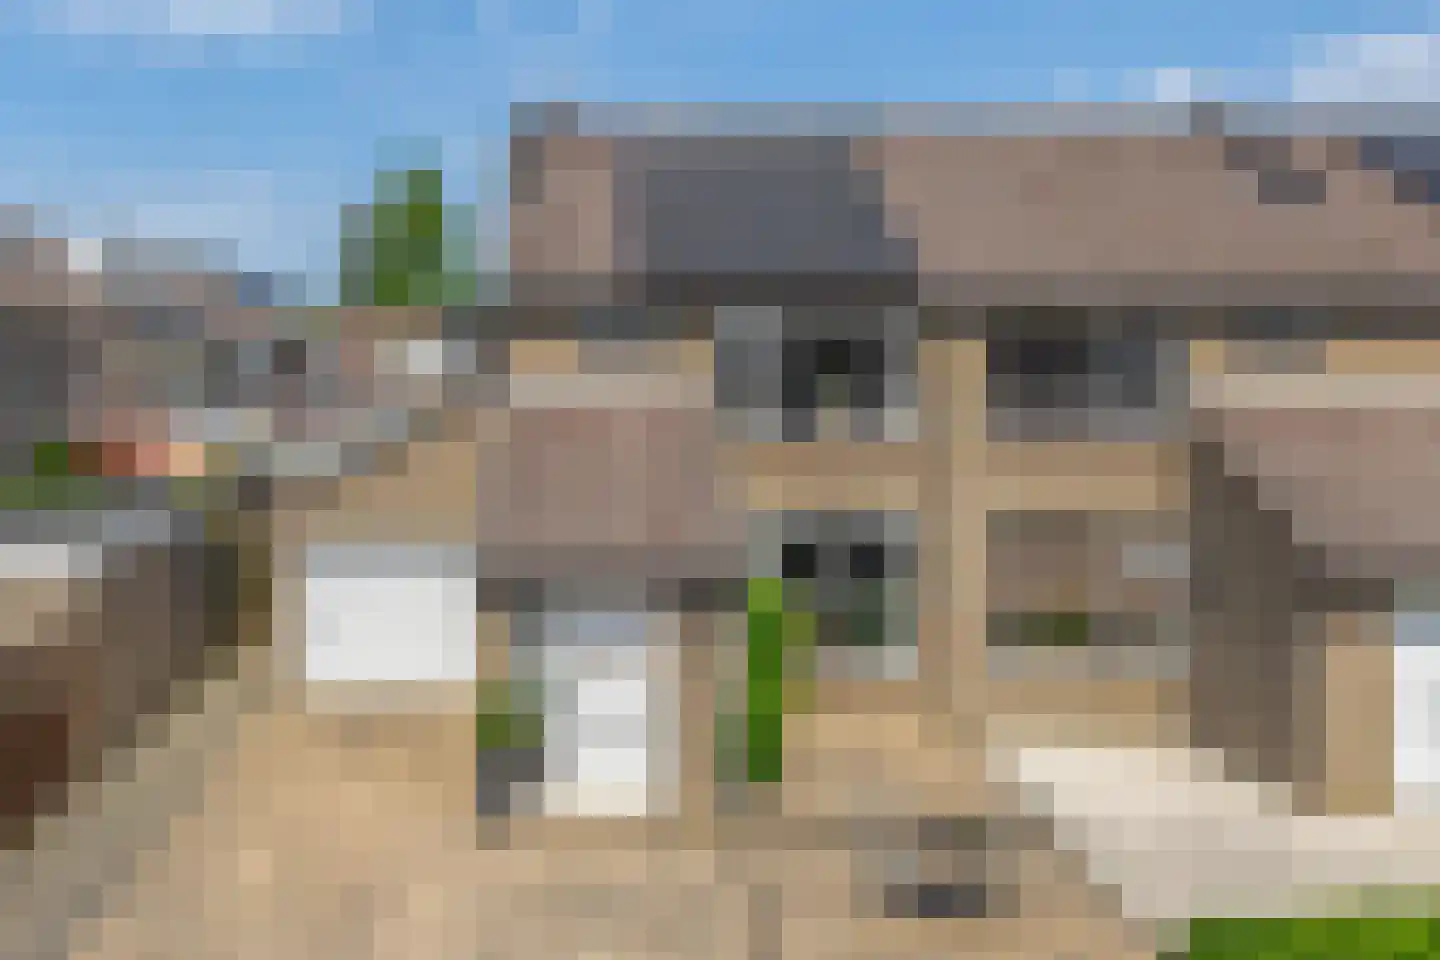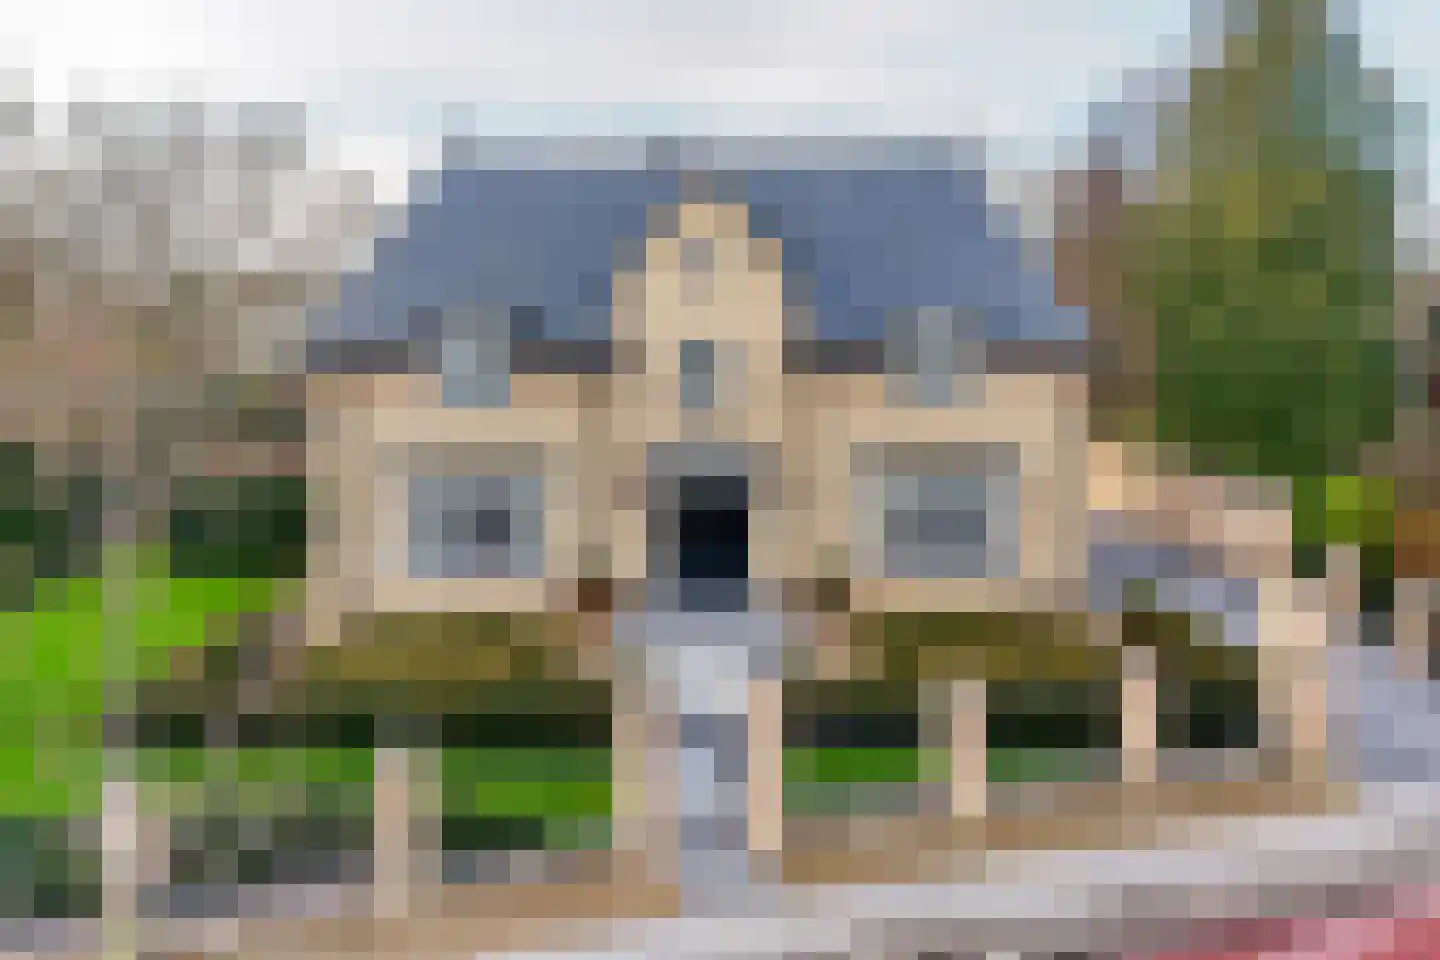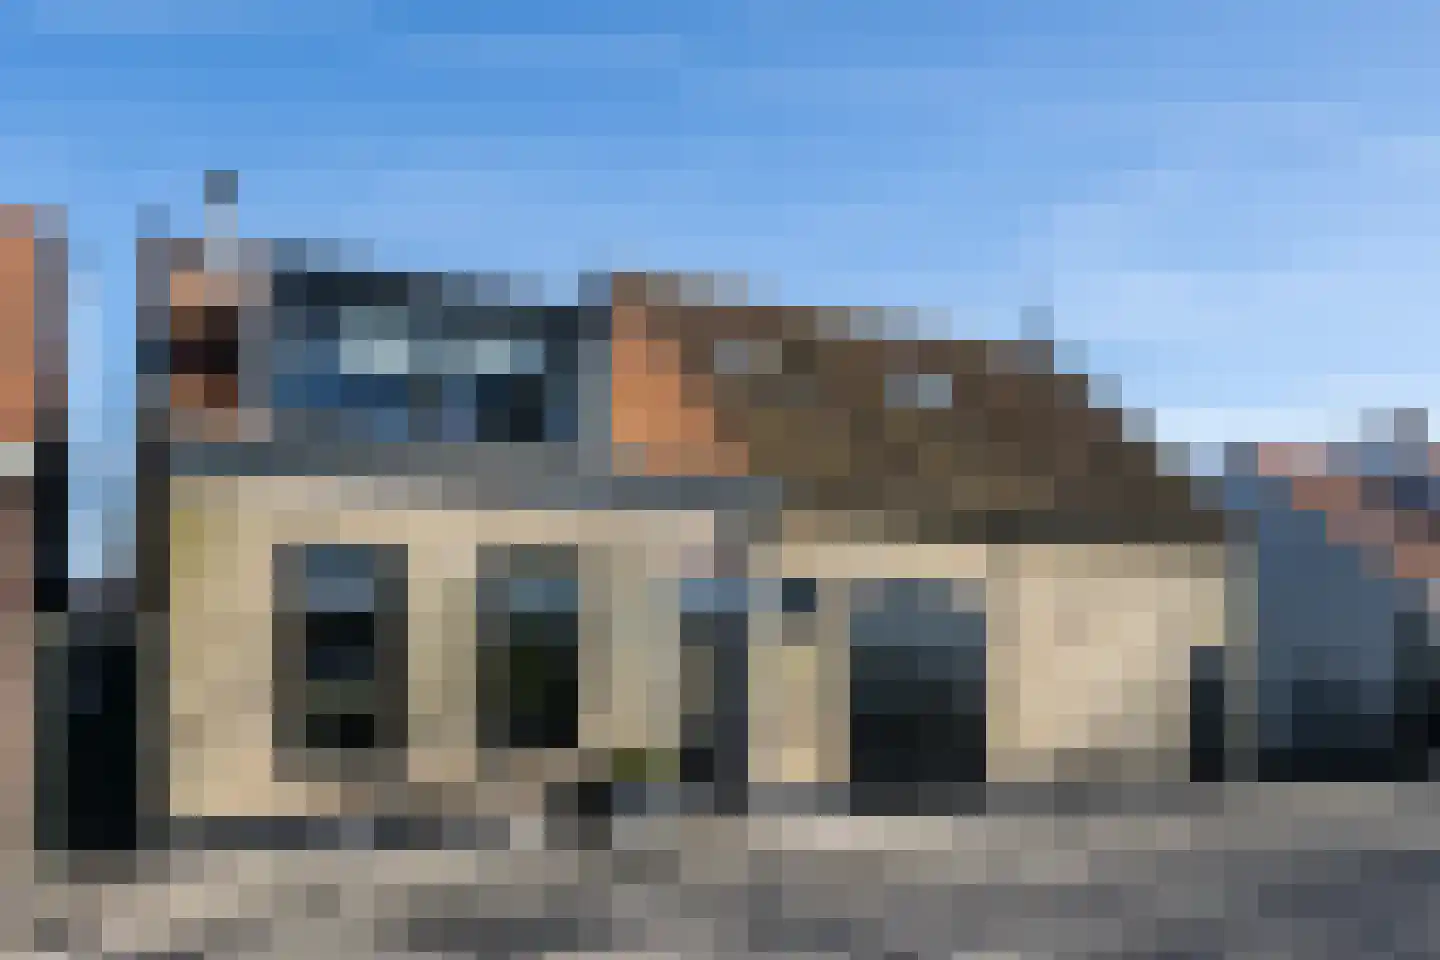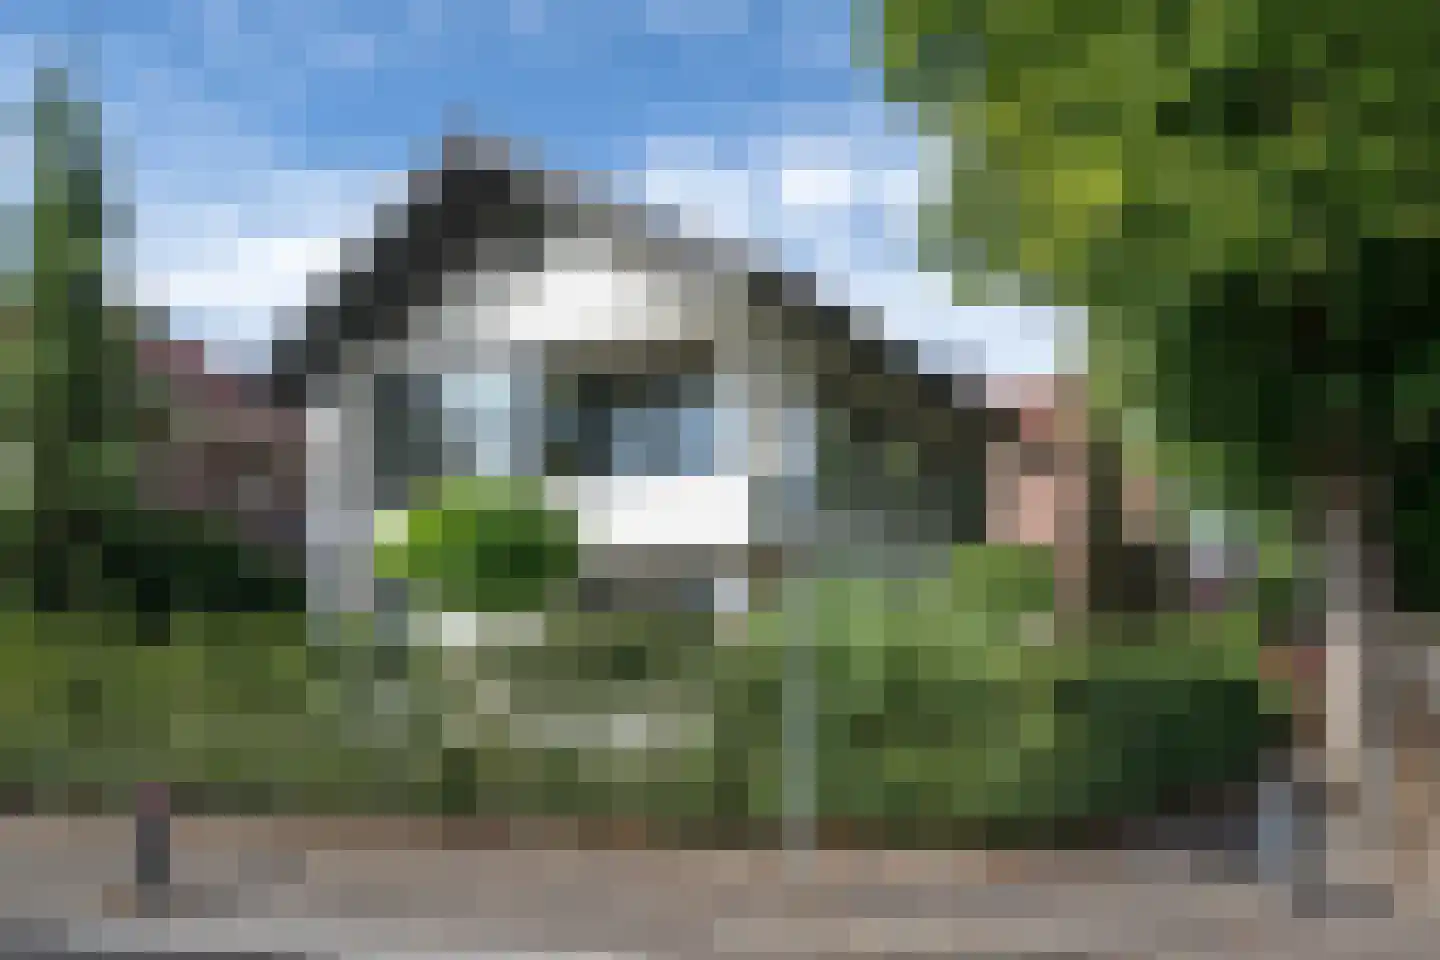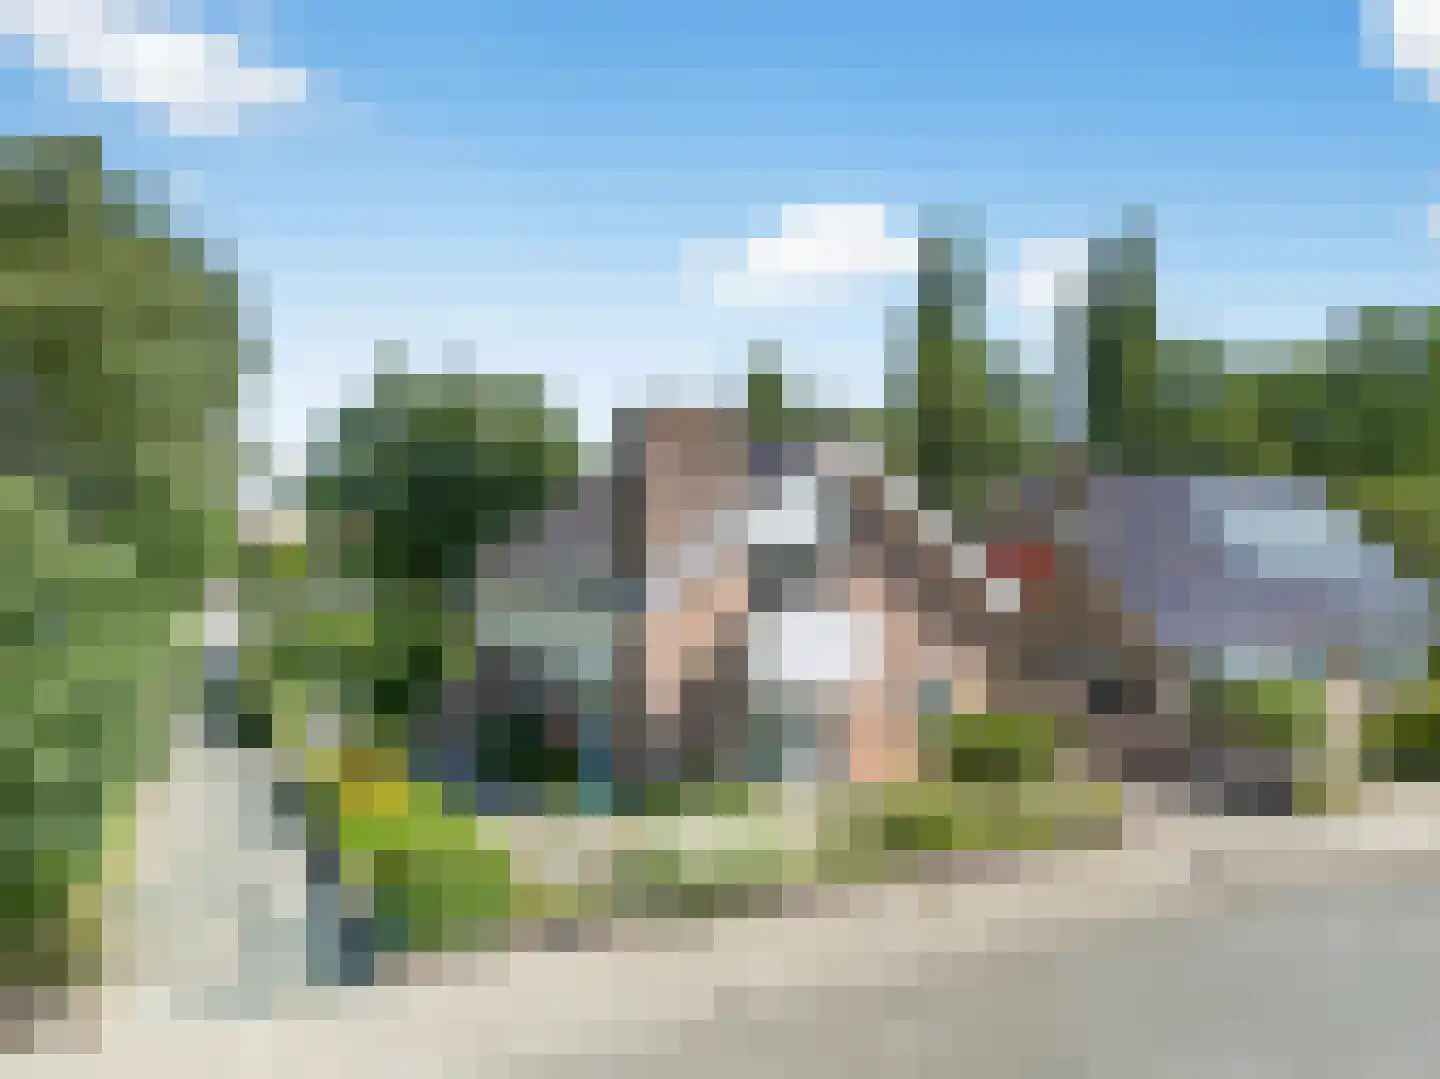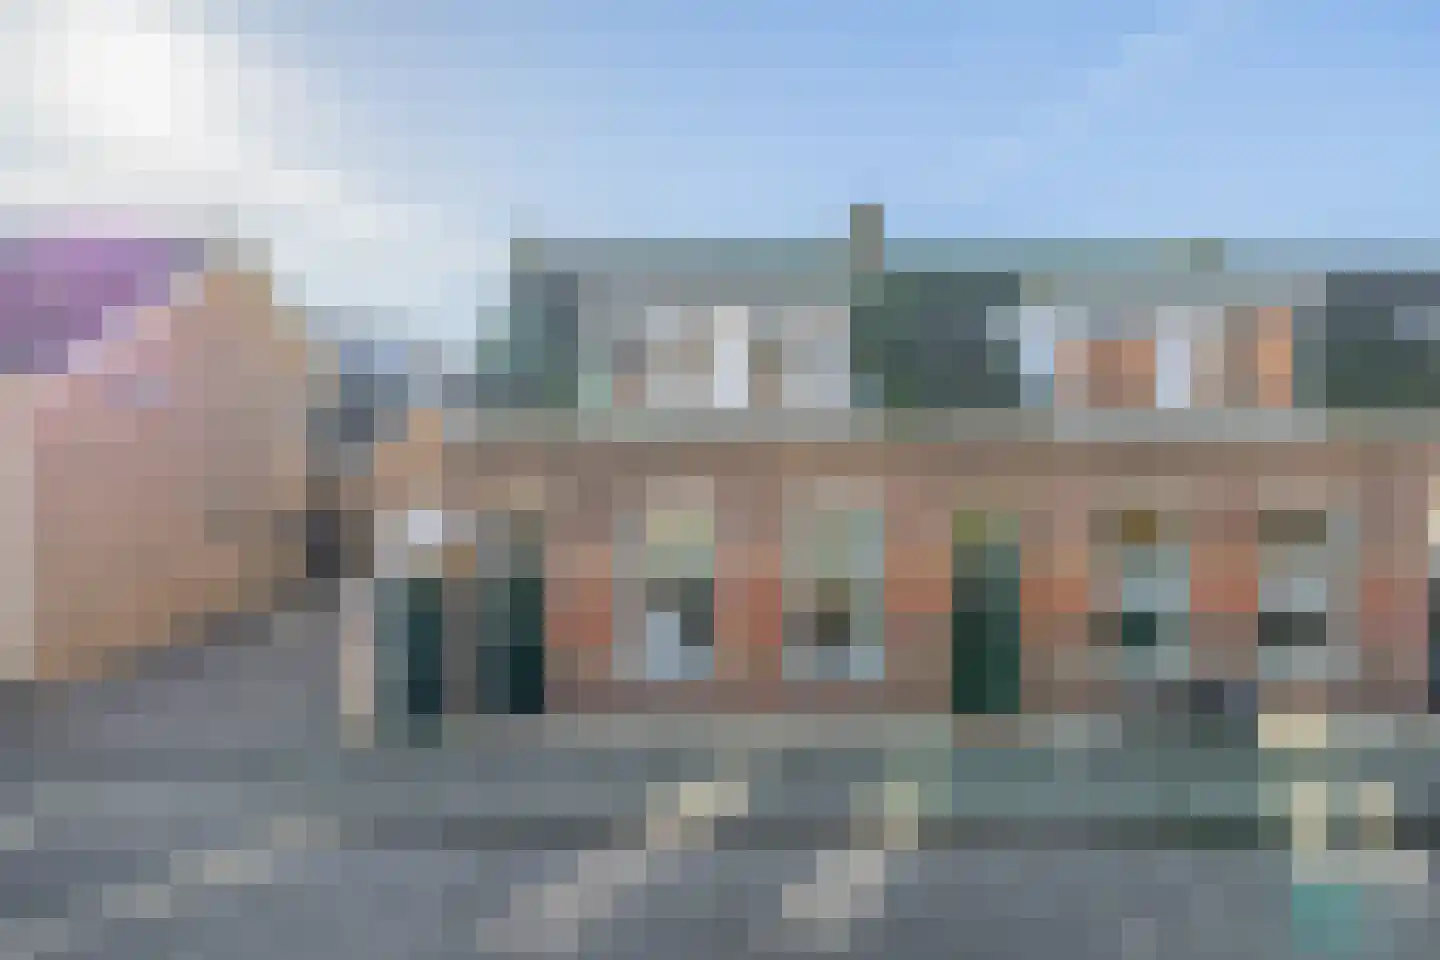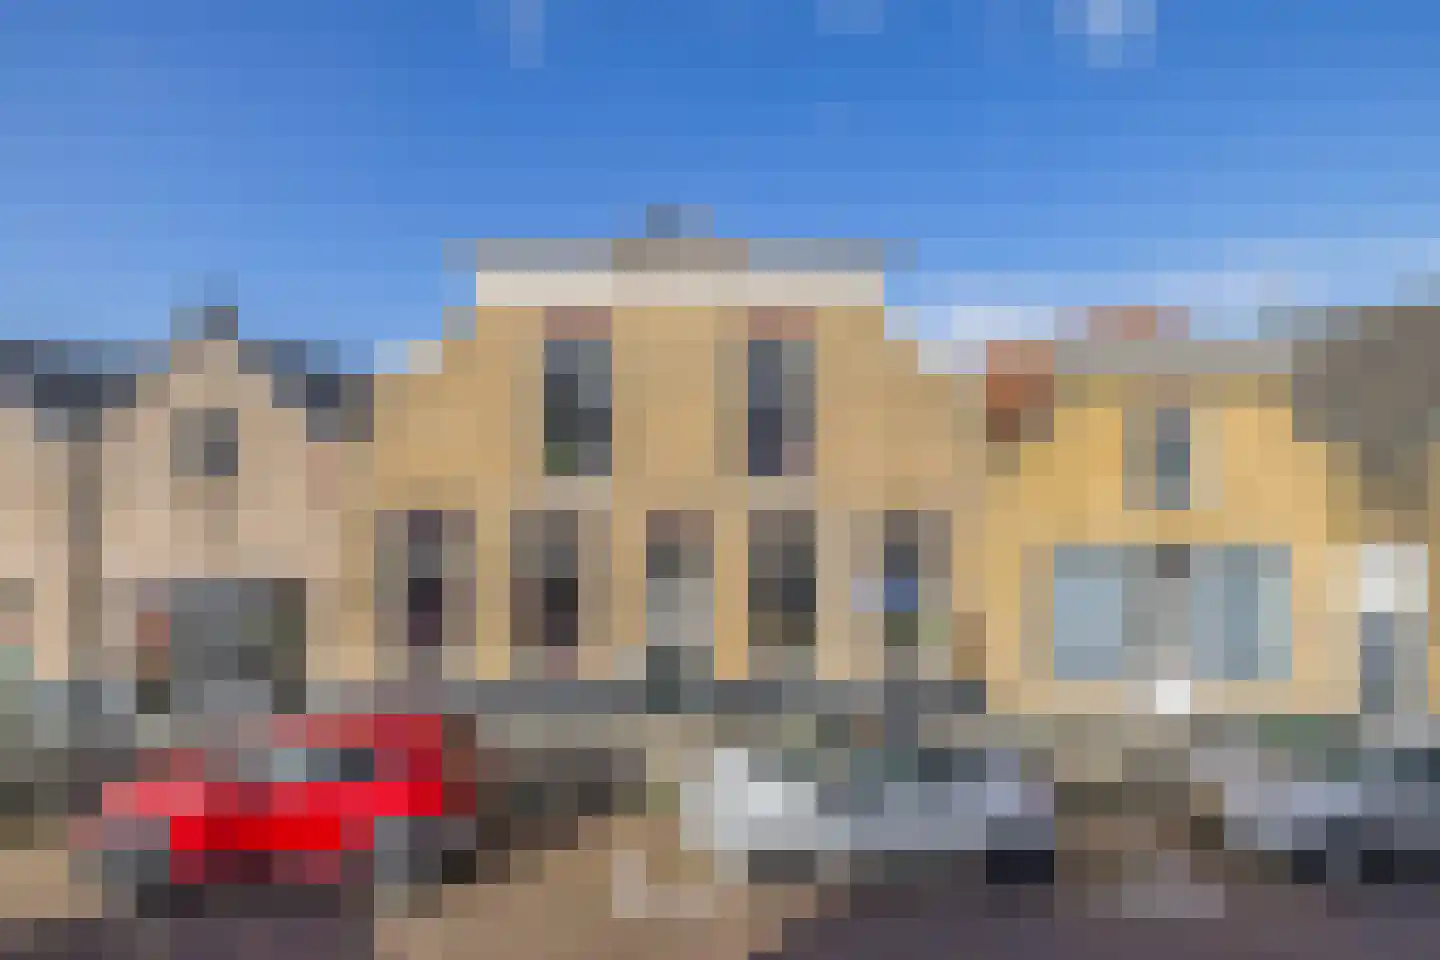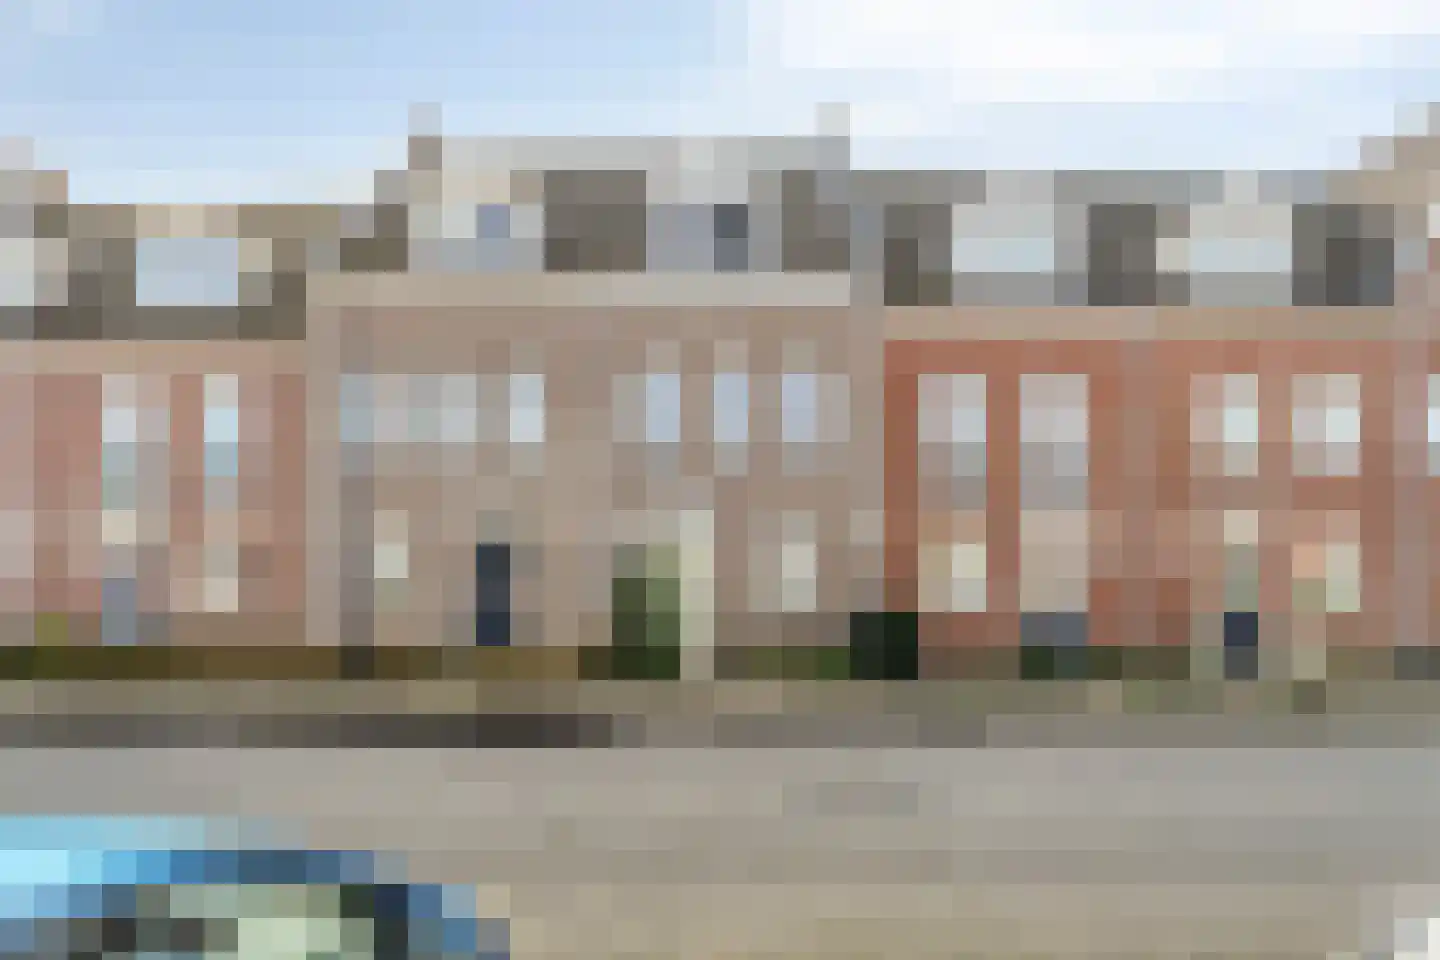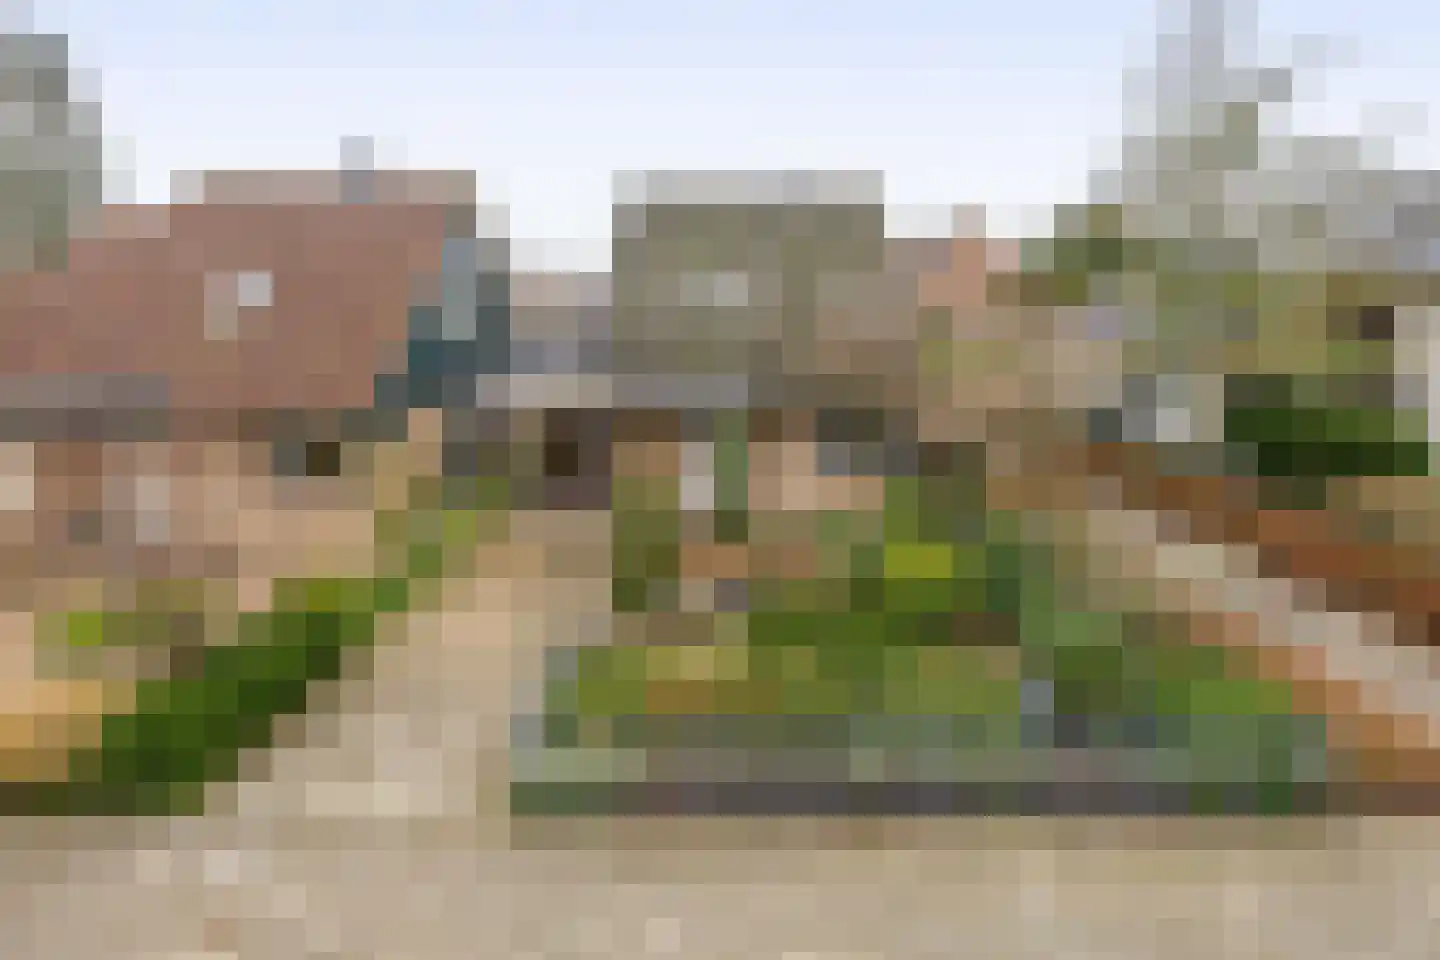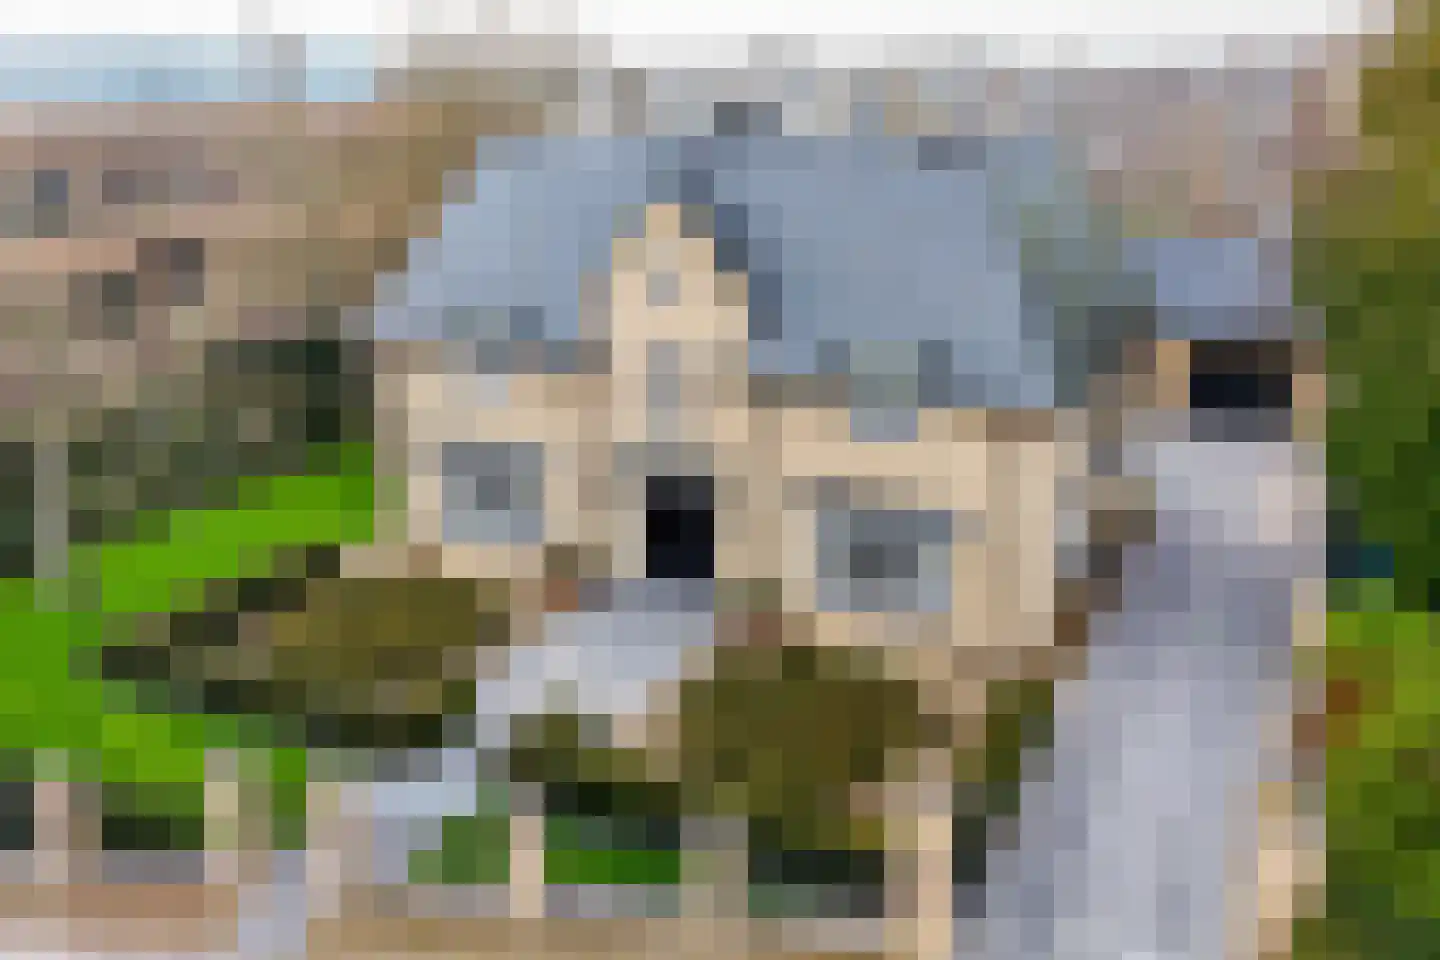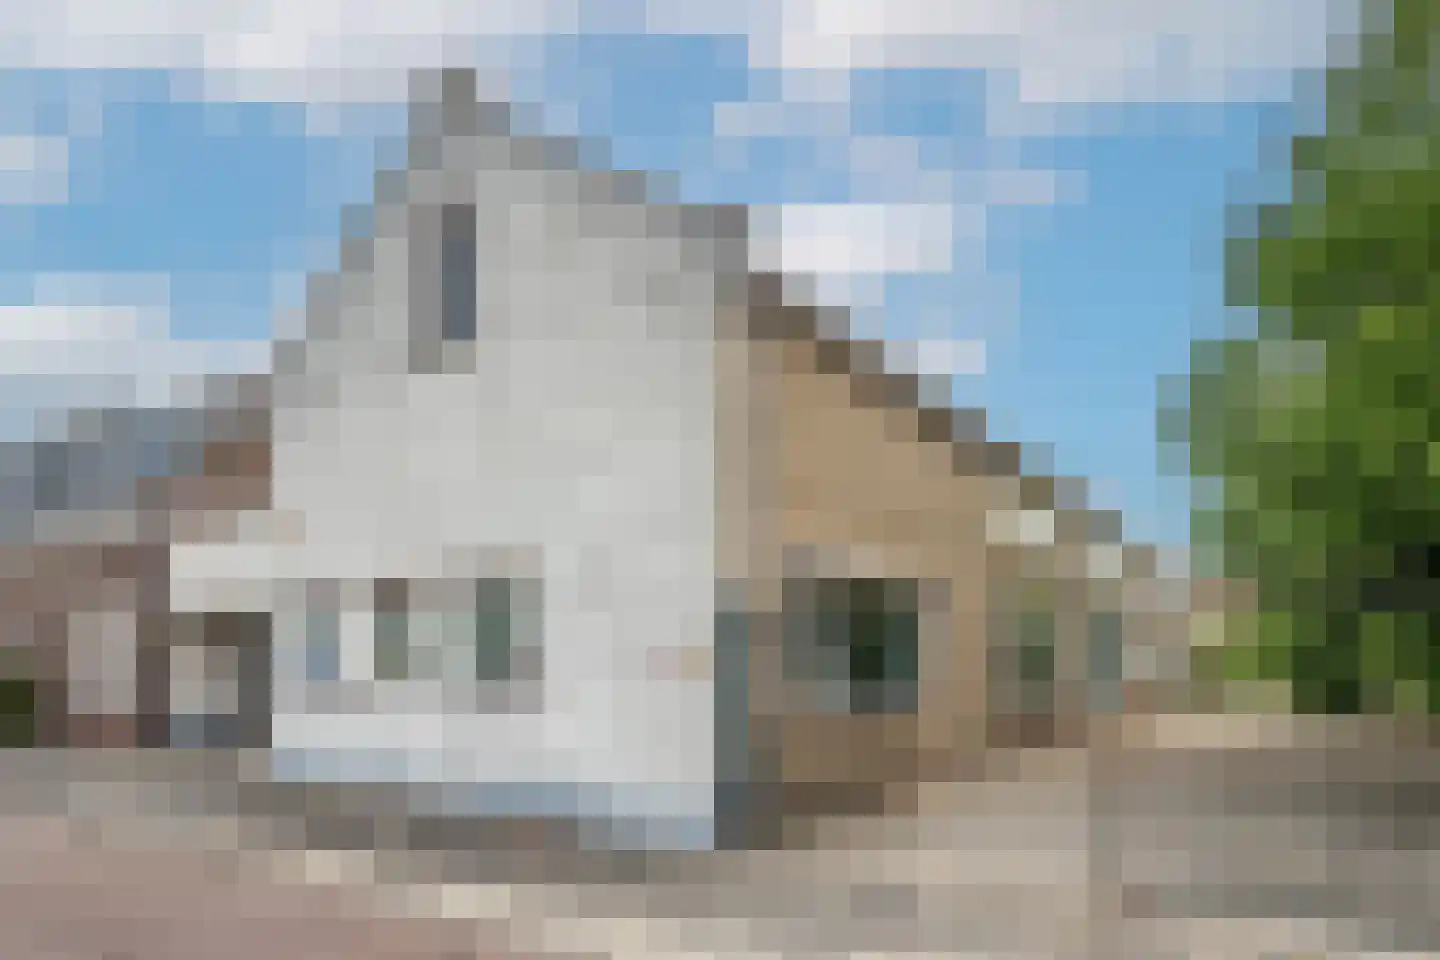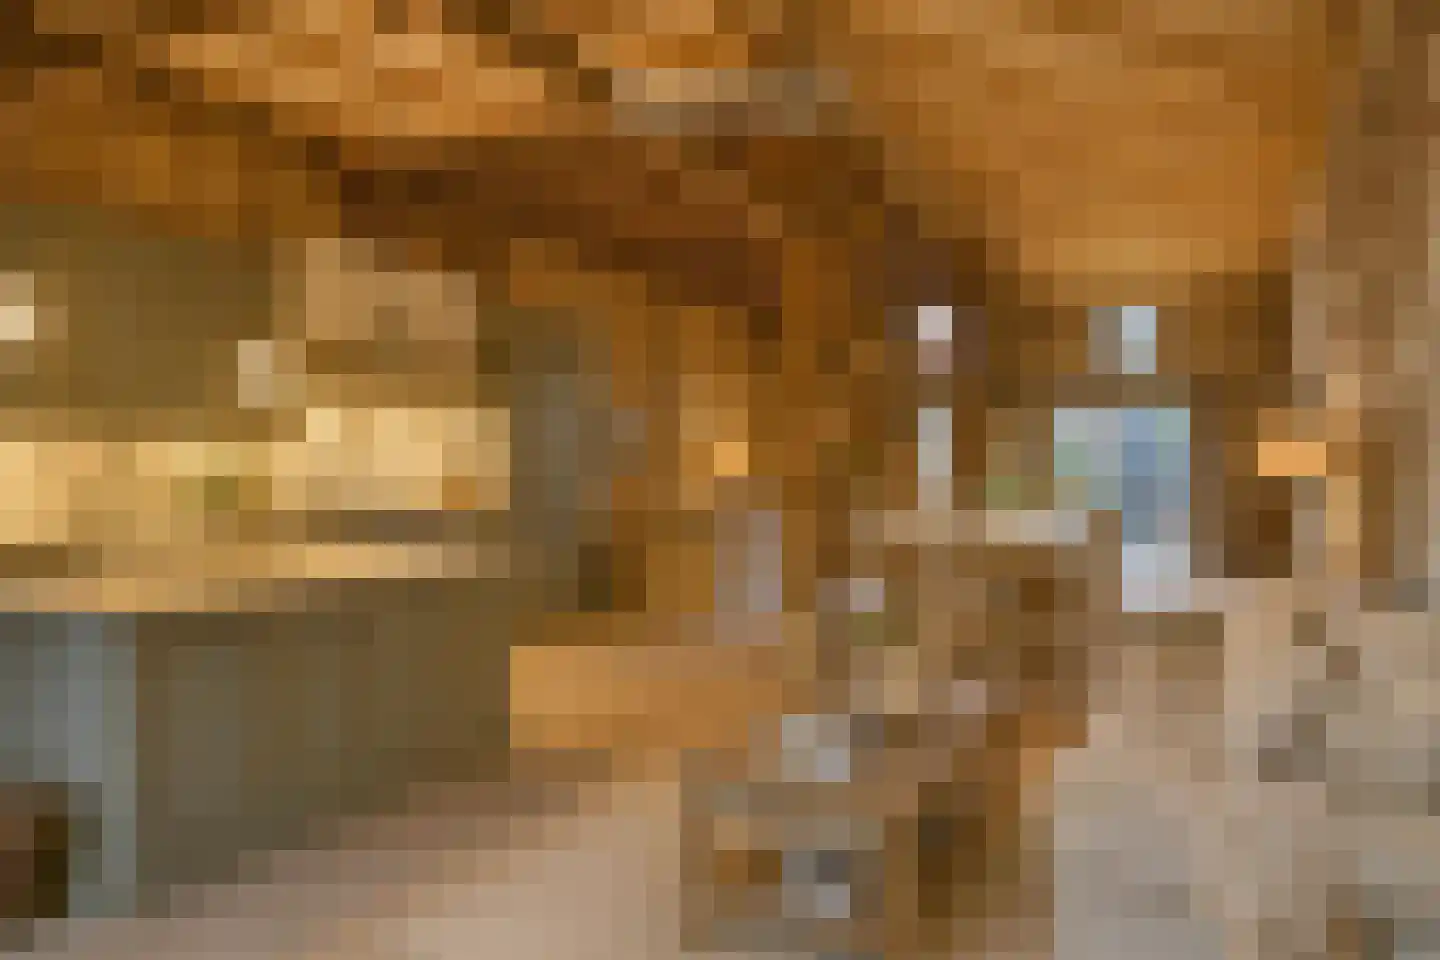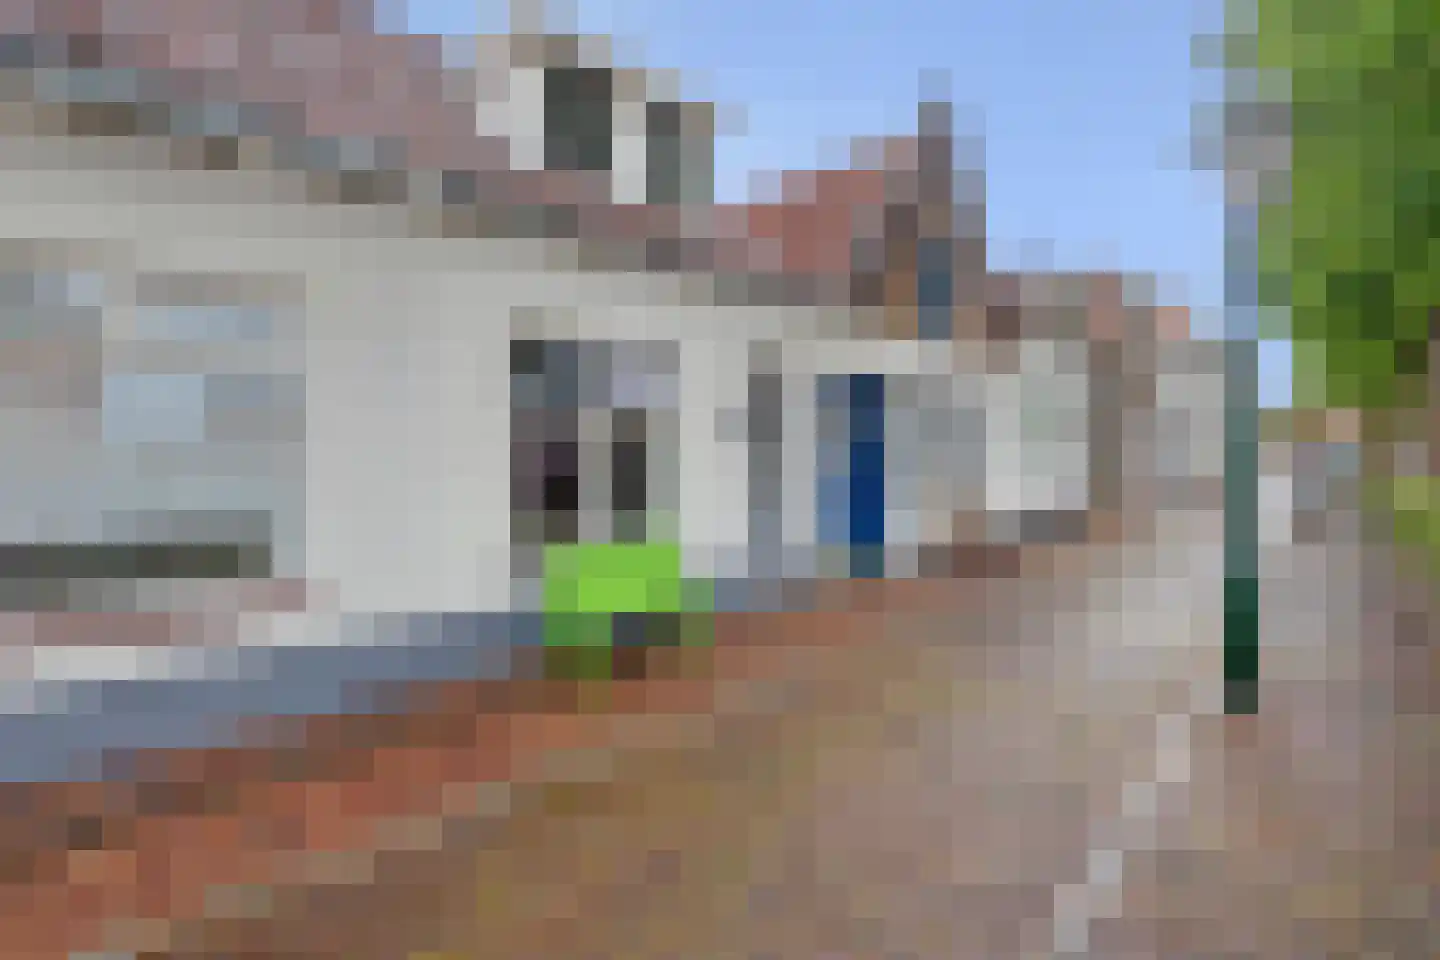
- Available
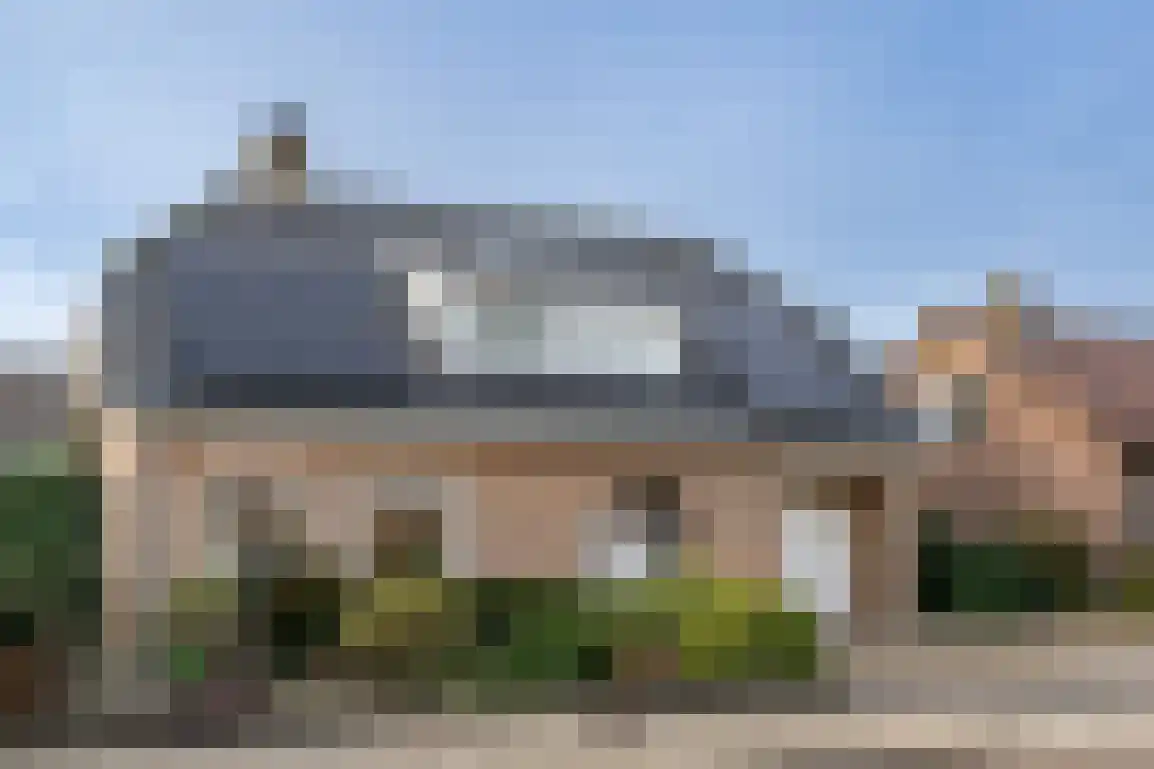
A.M. de Jongstraat 18
3245RK Sommelsdijk
€ 695.000 k.k.
€ 3.819/m²
Save as favorite
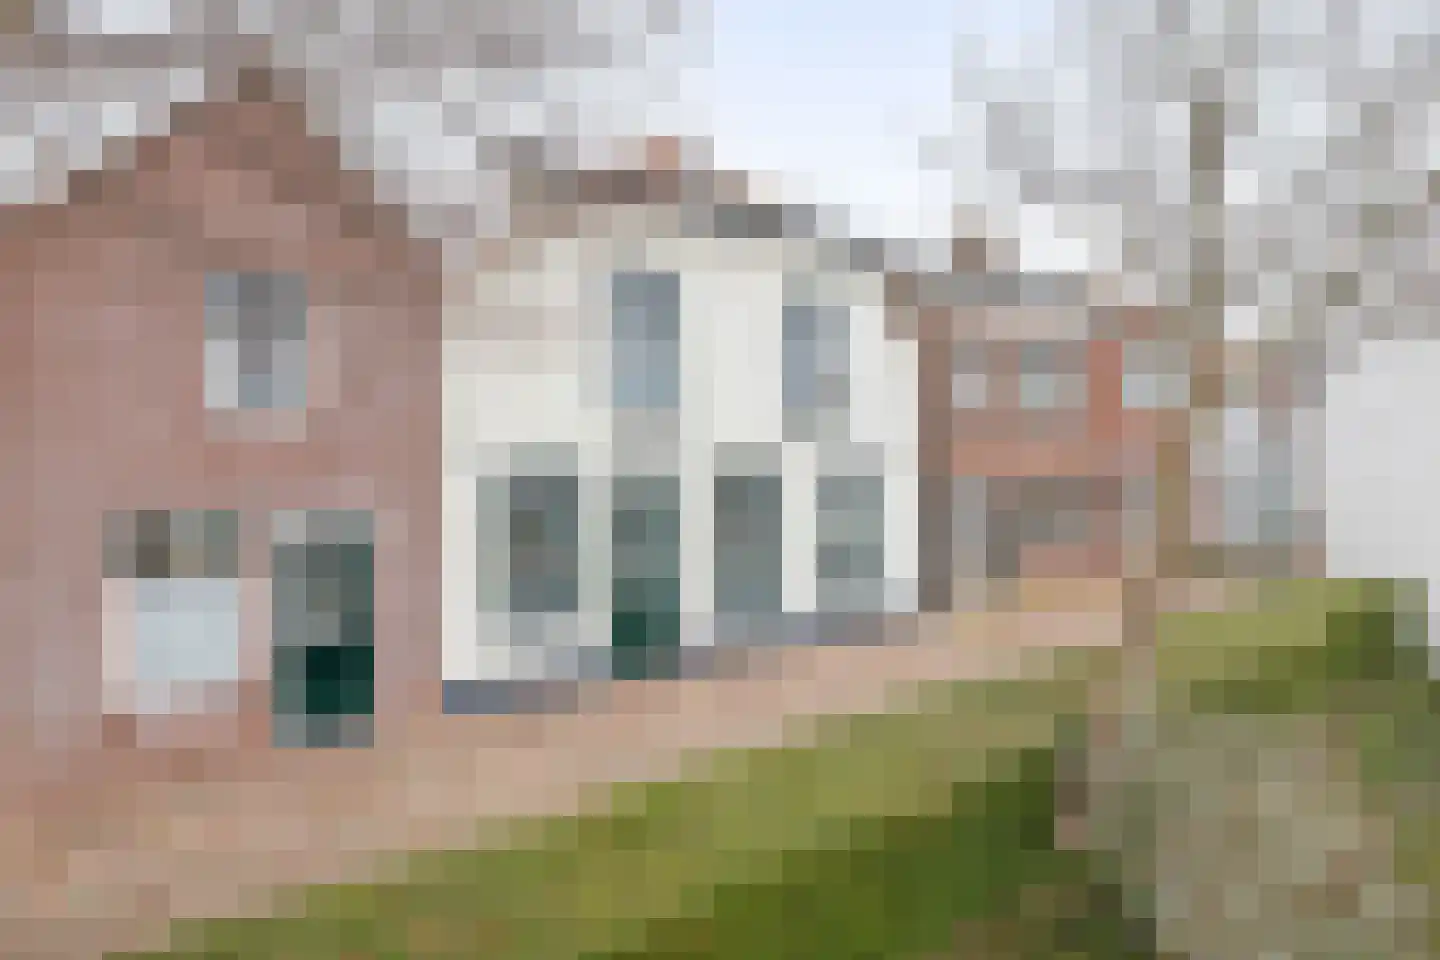
- Living area
- 182 m²
- Land area
- 306 m²
- Bedrooms
- 5