- Sold
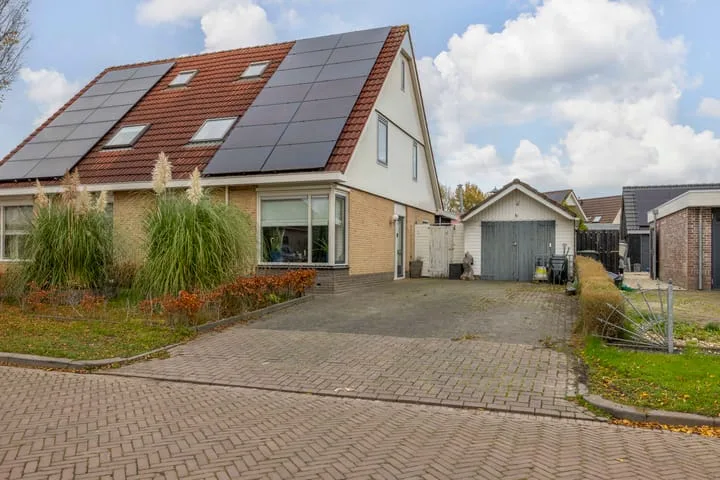
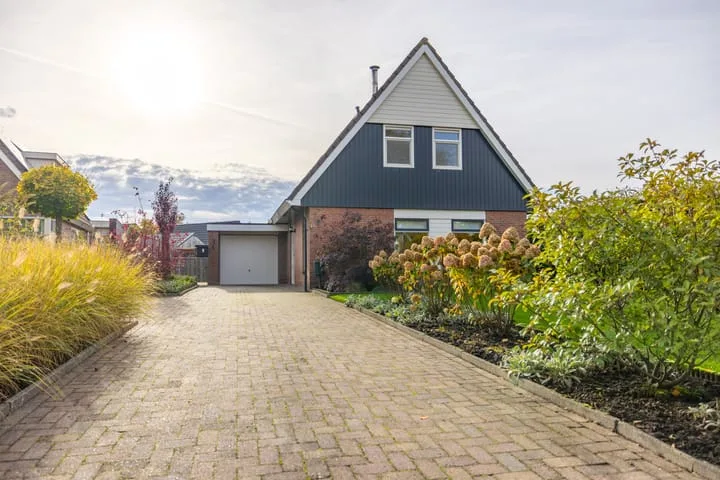
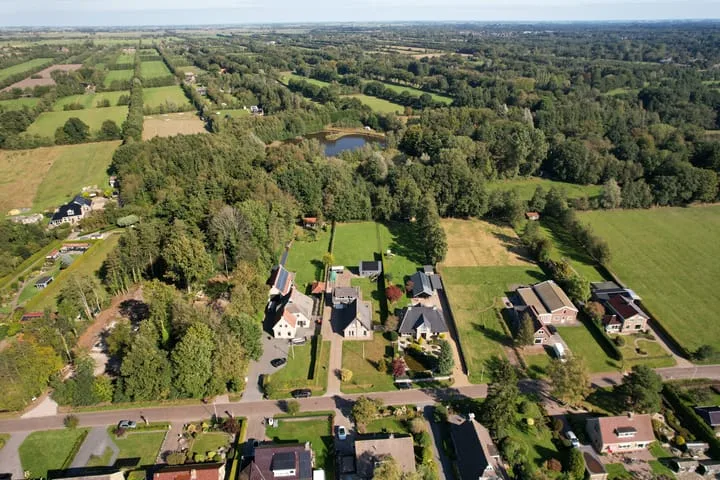
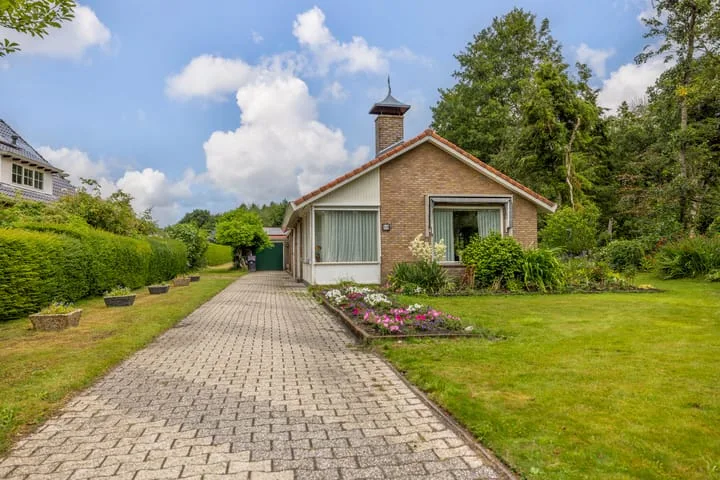
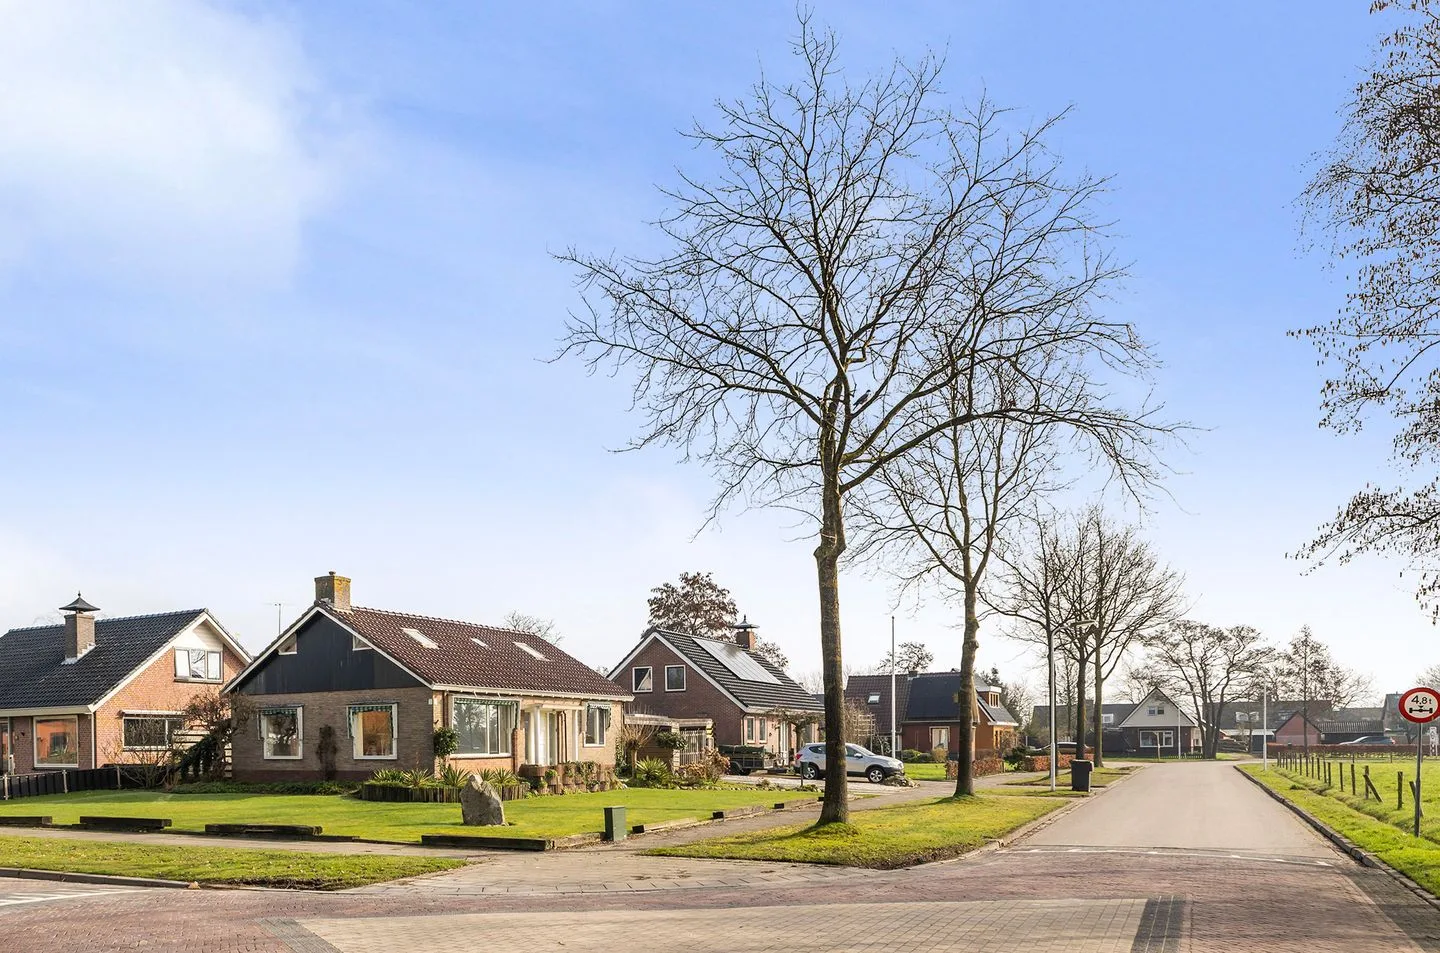
Hiltsjemuoiswâlden 1 A
9287NH Twijzelerheide
€ 350.000 k.k.
€ 3.097/m²
- Living area
- 113 m²
- Land area
- 508 m²
- Bedrooms
- 4
View 13 sold houses in Twijzelerheide
Type to search. Use arrow down and arrow up to navigate through results and press Enter to open.
Hidden search suggestions.
Compare sold homes in Twijzelerheide or view the current offering in this location directly.
On this page you will find recently sold homes in Twijzelerheide. Use this overview to better estimate selling prices, popular neighborhoods, and the local housing supply before you choose a real estate agent. Also view the current housing supply with 19 houses in Twijzelerheide.
9287NH Twijzelerheide
€ 350.000 k.k.
€ 3.097/m²
9287LC Twijzelerheide
€ 425.000 k.k.
€ 3.294/m²
9287NW Twijzelerheide
€ 365.000 k.k.
€ 2.644/m²
9287NT Twijzelerheide
€ 295.000 k.k.
€ 3.172/m²
9287LZ Twijzelerheide
€ 325.000 k.k.
€ 4.166/m²
9287HA Twijzelerheide
€ 425.000 k.k.
€ 3.695/m²
9287HC Twijzelerheide
€ 575.000 k.k.
€ 4.713/m²
9287NW Twijzelerheide
€ 350.000 k.k.
€ 0/m²
9287HC Twijzelerheide
€ 695.000 k.k.
€ 4.695/m²
9287HC Twijzelerheide
€ 469.000 k.k.
€ 4.936/m²
9287NS Twijzelerheide
€ 240.000 k.k.
€ 2.580/m²
9287LR Twijzelerheide
€ 245.000 k.k.
€ 2.041/m²
9287MZ Twijzelerheide
€ 699.000 k.k.
€ 3.738/m²
View recent sales and receive free quotes from local real estate agents. Compare more than 17 real estate agents in Twijzelerheide.
Selling your own home in Twijzelerheide? Compare real estate agents in Twijzelerheide or view the best real estate agents in Twijzelerheide as a reference for your choice.
Real estate agents make sharper offers when they know you're comparing — ask for quotes for sale or purchase.
Short answers about housing prices, sold homes and comparing real estate agents in Twijzelerheide.
The costs of a real estate agent in Twijzelerheide vary per office, property type and sales approach. In Twijzelerheide you can compare 17 real estate agents; therefore also look at the real estate agents in Twijzelerheide to better compare fees, presentation and local experience.
On this page we currently show 13 sold houses in Twijzelerheide from our selection. This helps you to better assess recent transactions and the local housing market.
Houses sold in Twijzelerheide give insight into asking prices, house types and neighborhoods where recent transactions have taken place. Compare this also with the current housing stock in Twijzelerheide to better understand the market.
You can use sold homes as a first market indication, but a local real estate agent can better take into account finishing, location, maintenance and current demand in Twijzelerheide.
Compare the 17 real estate agents in Twijzelerheide on local sales experience, reviews, expected yield, commission and marketing approach. View real estate agents in Twijzelerheide or the top 10 agents in Twijzelerheide to quickly discover strong offices.
View current location data on residents, WOZ development, housing stock, energy consumption, business activity and safety in Twijzelerheide. In 2026 were there 1.828 residents. The average WOZ value in 2025 is EUR 294.981.
These figures help to better assess and compare the housing stock in Twijzelerheide with recent sold homes. Orient yourself then on suitable top real estate agents in Twijzelerheide for sales advice in this region.
Residents
1.828
Last year: 2026
Average WOZ
EUR 294.981
Last year: 2025
Average income per person.
EUR 23.890
Source: AllNumbers
Crimes (current year)
24
Total registered
| Year | Residents |
|---|---|
| 2021 | 1.780 |
| 2022 | 1.800 |
| 2023 | 1.795 |
| 2024 | 1.815 |
| 2025 | 1.830 |
| 2026 | 1.828 |
| Year | Average WOZ |
|---|---|
| 2021 | EUR 200.895 |
| 2022 | EUR 217.500 |
| 2023 | EUR 246.515 |
| 2024 | EUR 268.235 |
| 2025 | EUR 294.981 |
Hoger
170
Praktisch
520
Middelbaar
730
Europa
45
Nederland
1.750
Buiten Europa
40
Label C
210
Label B
144
Label G
131
Label A
97
Label D
87
Label E
47
Label F
41
Label A+++
15
Label A++
5
Label A+
1
Label A++++
0
Label A+++++
0
| Year | Gas (m3) | Electricity (kWh) |
|---|---|---|
| 2020 | 1.531 | 2.901 |
| 2021 | 1.713 | 3.039 |
| 2022 | 1.310 | 2.838 |
| 2023 | 1.052 | 2.657 |
| 2024 | 1.023 | 2.825 |
Hoekwoning
Gas: 928 • Electricity: 2.006
Huurwoning
Gas: 990 • Electricity: 2.360
Koopwoning
Gas: 1.090 • Electricity: 2.868
Appartement
Gas: 683 • Electricity: 1.375
Tussenwoning
Gas: 771 • Electricity: 1.813
Vrijstaande woning
Gas: 1.106 • Electricity: 2.966
Twee-onder-één-kap woning
Gas: 1.064 • Electricity: 2.700
Total number of company establishments: 220
| Period | Crimes |
|---|---|
| jan 2026 | 3 |
| jul 2025 | 2 |
| jun 2025 | 2 |
| mei 2025 | 3 |
| mrt 2025 | 2 |
| mrt 2026 | 2 |
| nov 2024 | 2 |
| nov 2025 | 1 |
| okt 2024 | 1 |
| okt 2025 | 3 |
| sep 2024 | 3 |
| sep 2025 | 0 |
These figures give an indicative picture of safety trends in the living environment of Twijzelerheide.
Short answers based on current local statistics, handy for a quick comparison of the living environment.
Twijzelerheide telt in 2026 ongeveer 1.828 inwoners.
De gemiddelde WOZ-waarde in Twijzelerheide is in 2025 circa € 294.981.
Het gemiddelde inkomen per inwoner in Twijzelerheide ligt rond € 23.890 per jaar.
Voor het huidige jaar gaat het om ongeveer 24 geregistreerde misdrijven. Gebruik deze cijfers als indicatie en vergelijk trends per periode.
In Twijzelerheide komt vooral "Vrijstaande woningen" veel voor, met ongeveer 409 woningen.