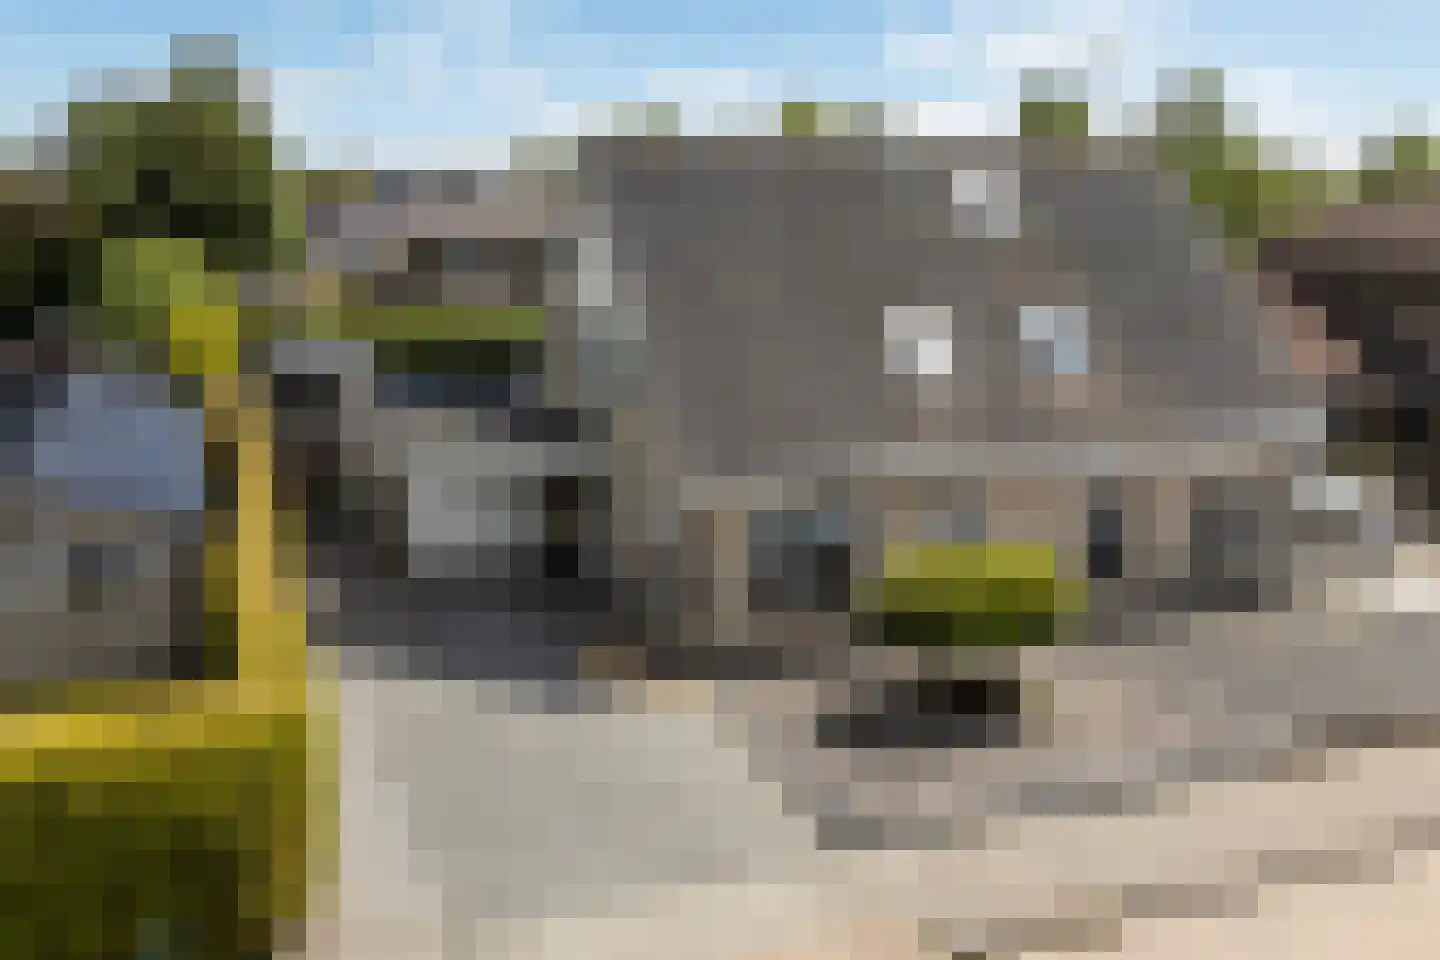
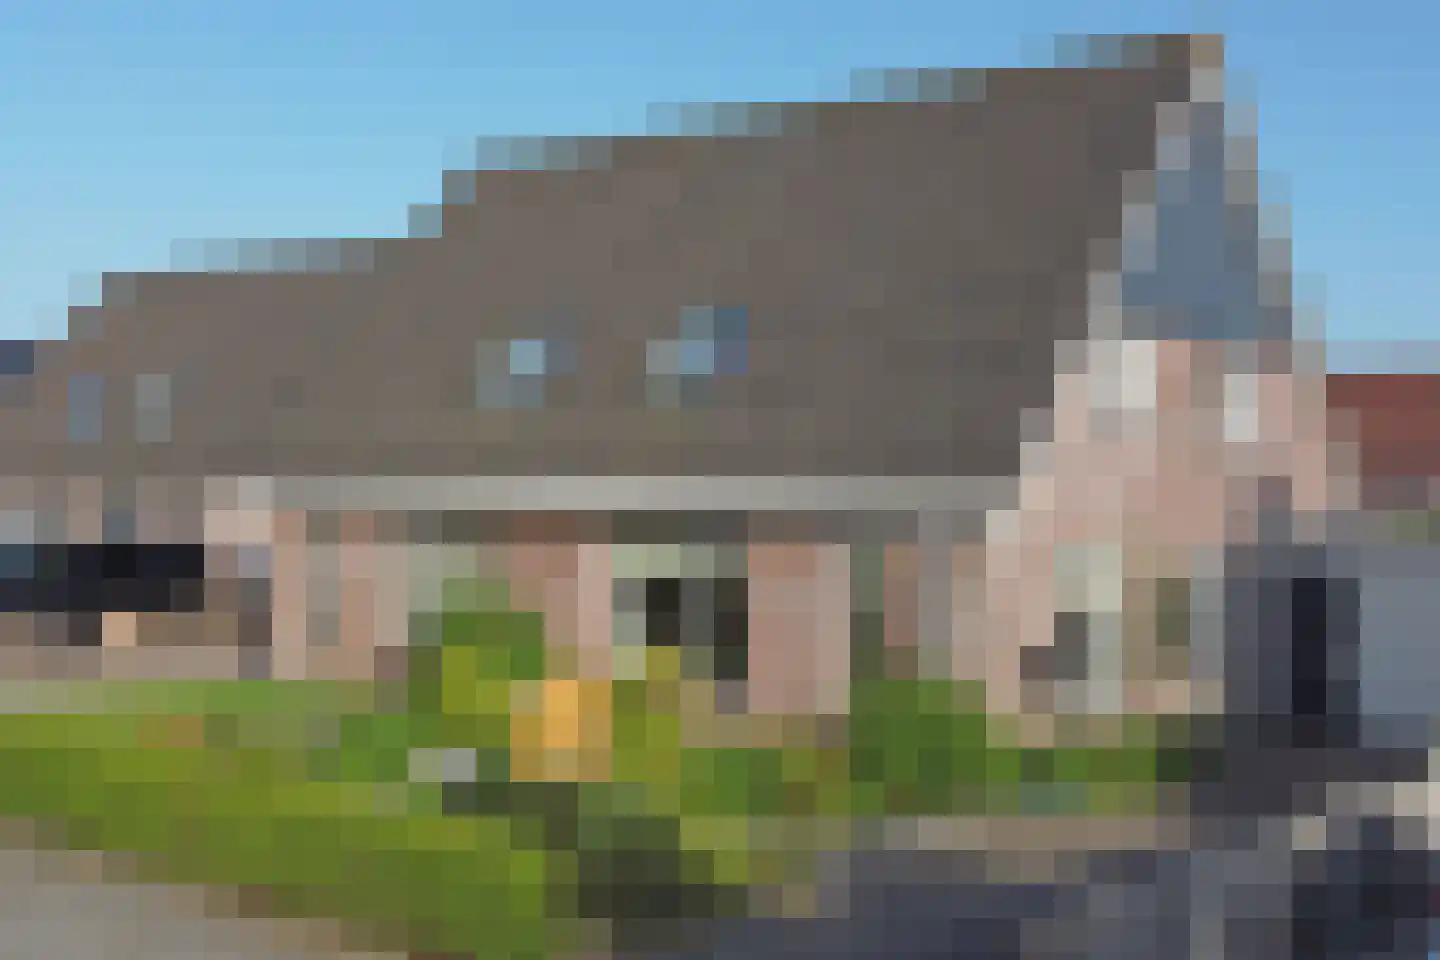
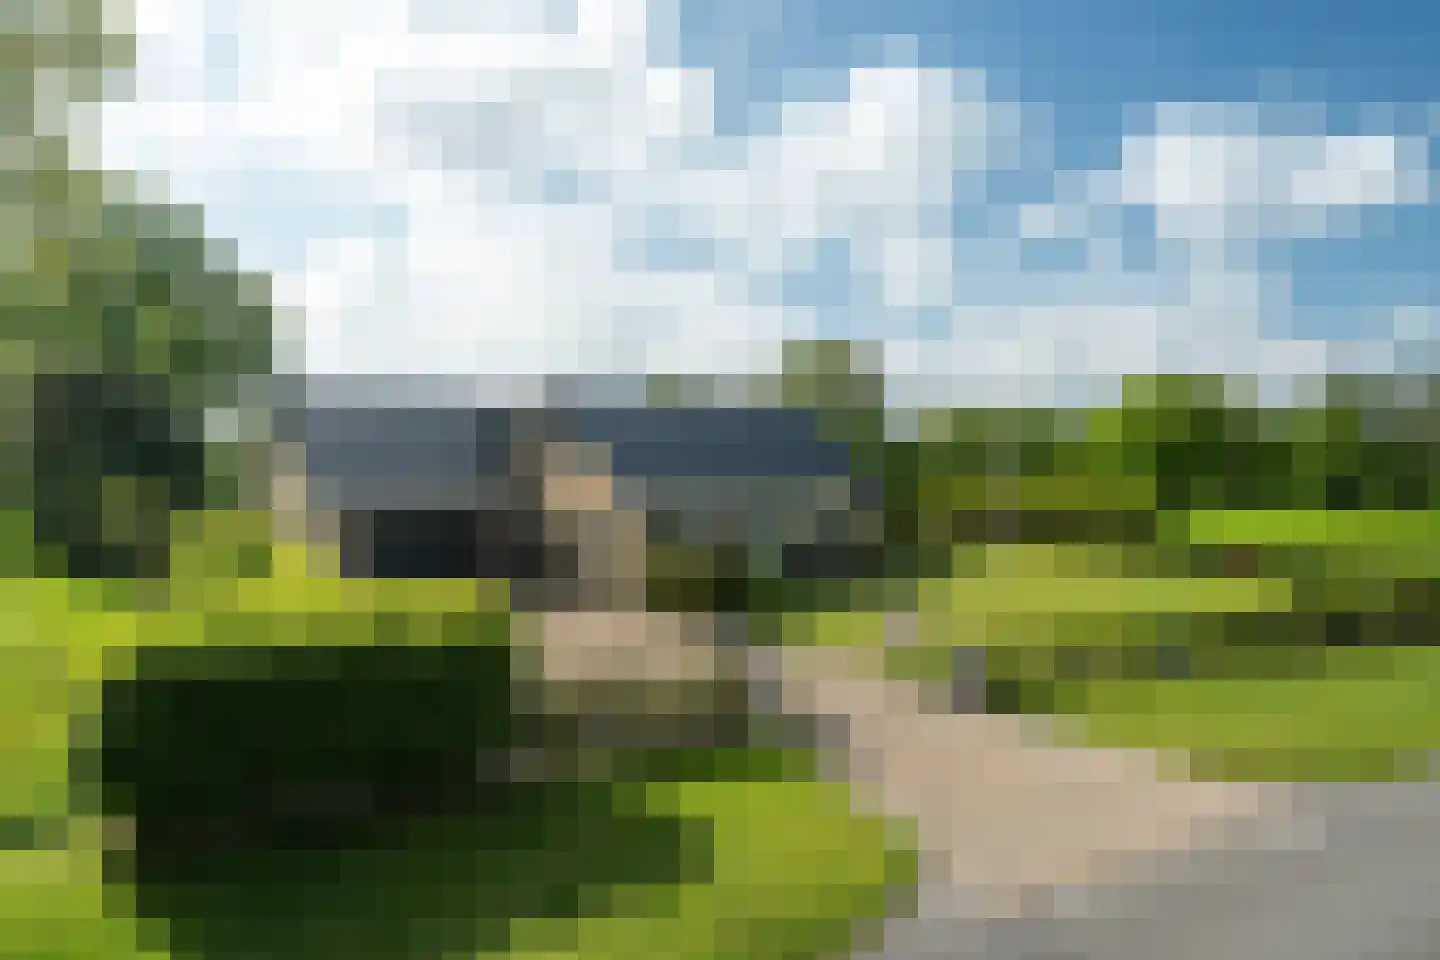
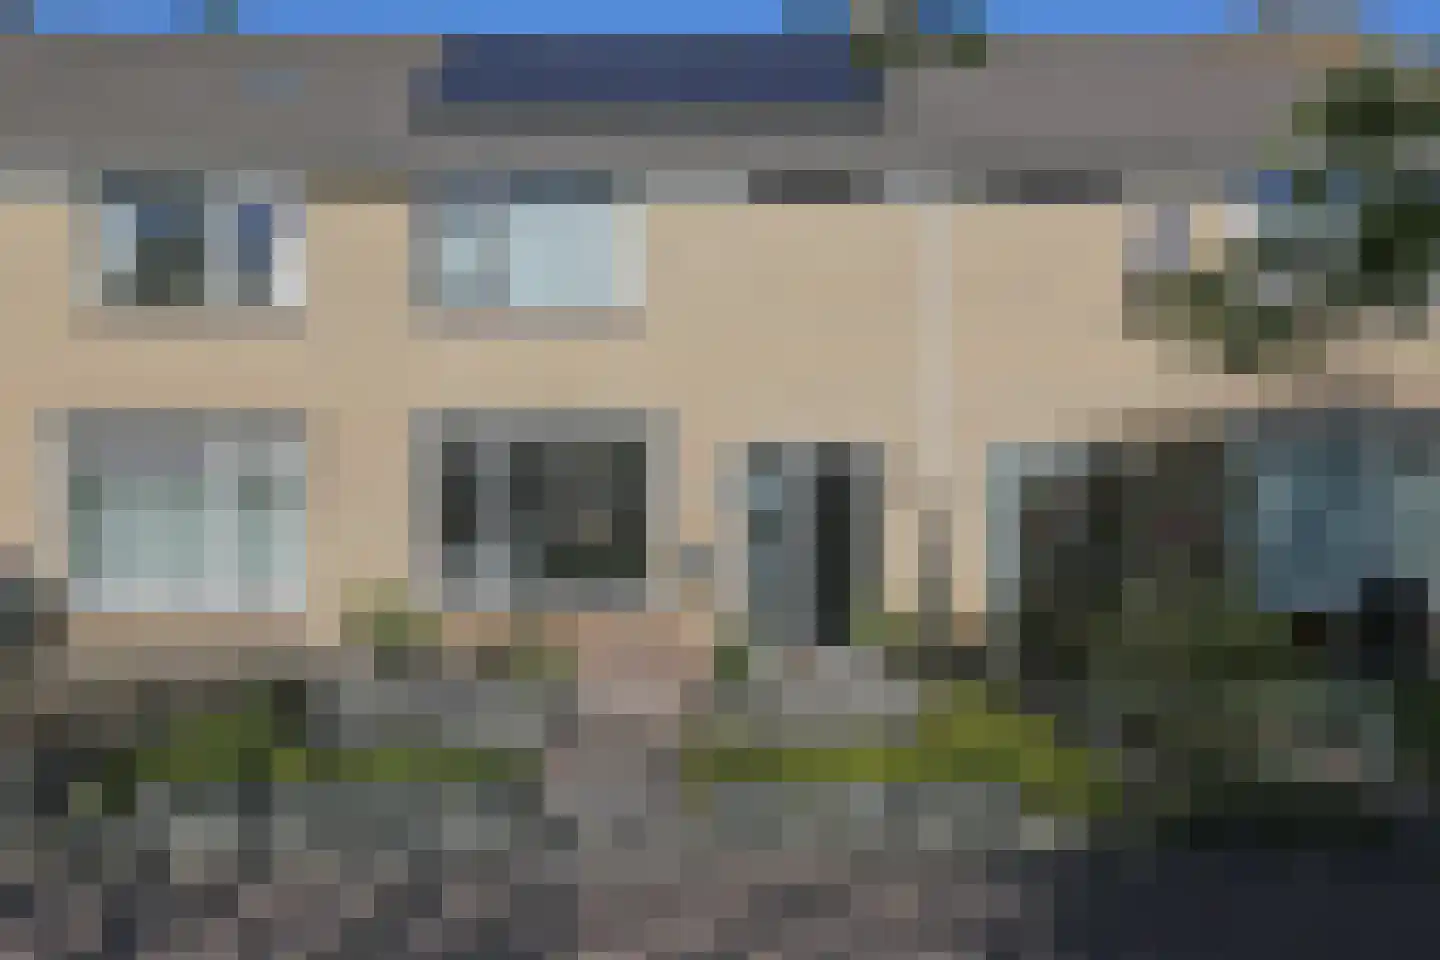
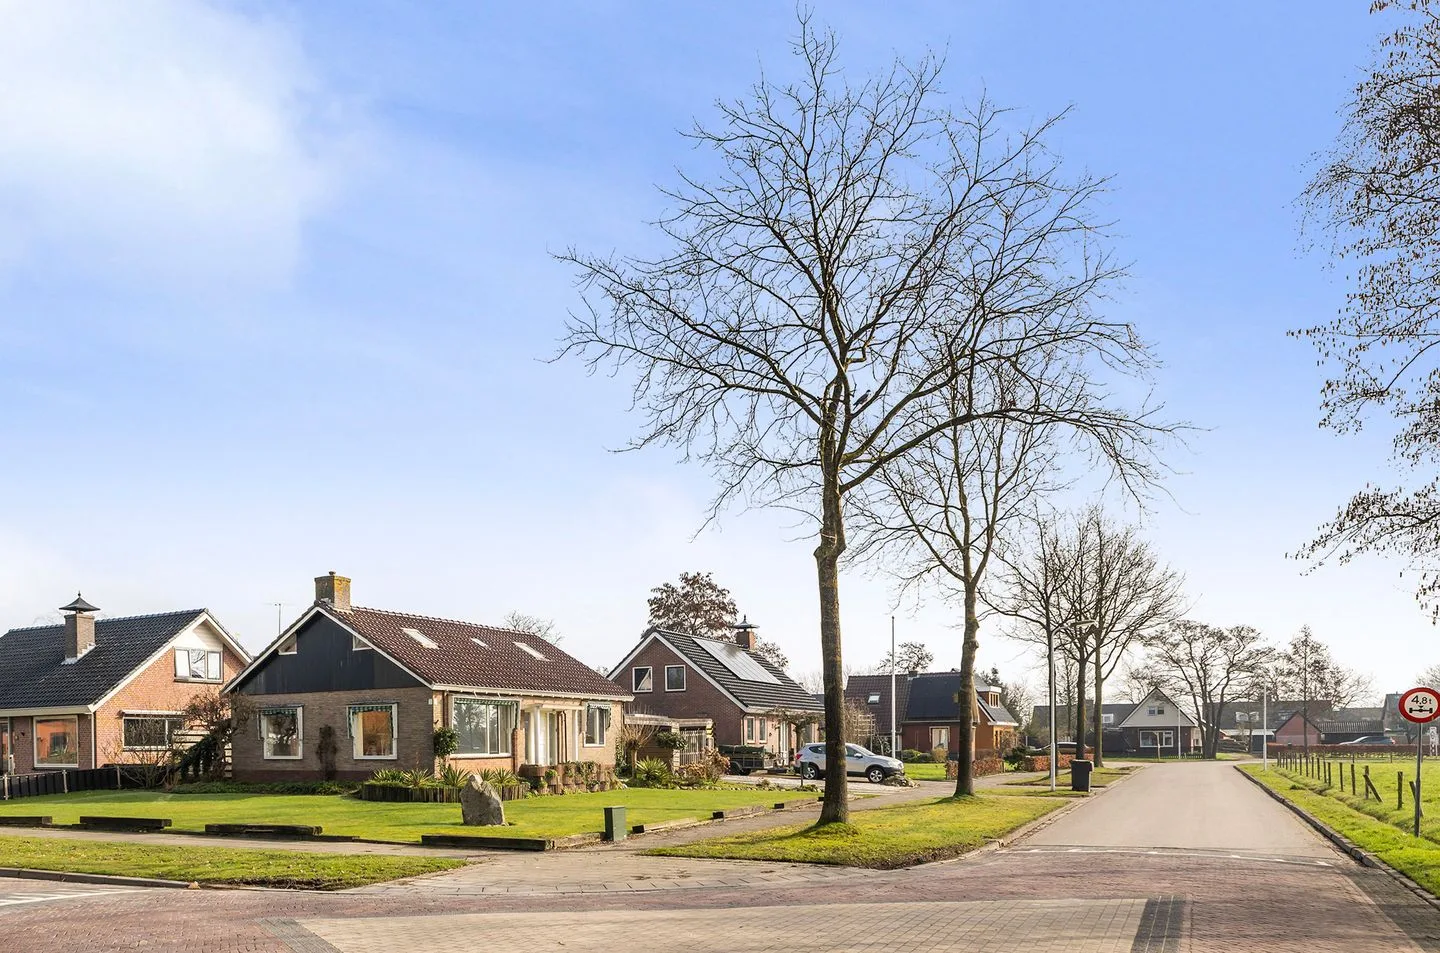
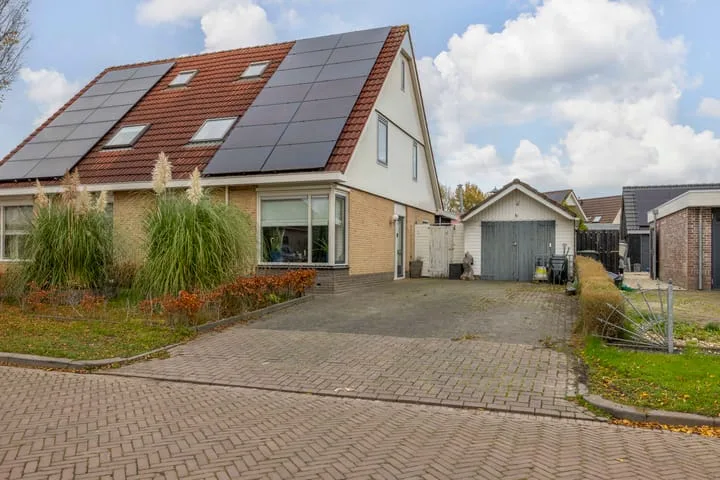
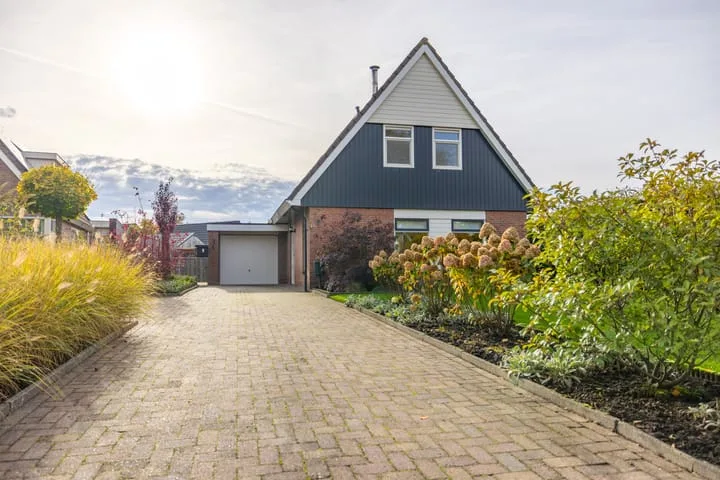
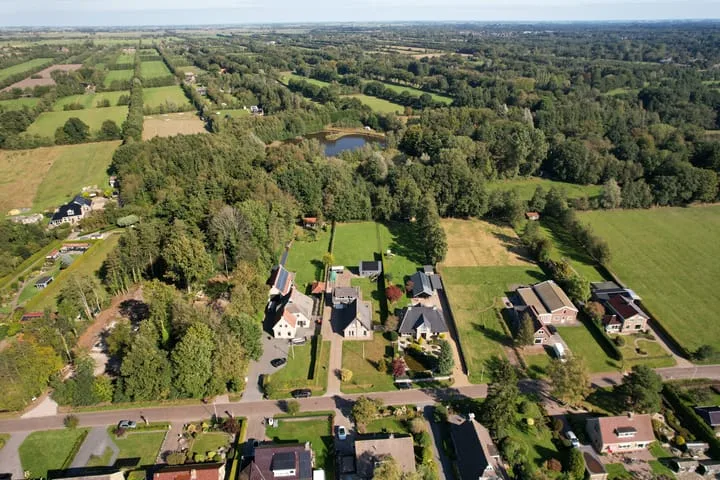
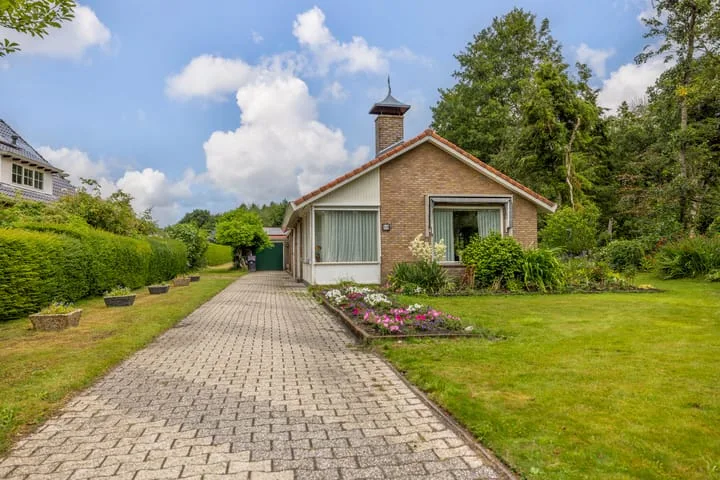
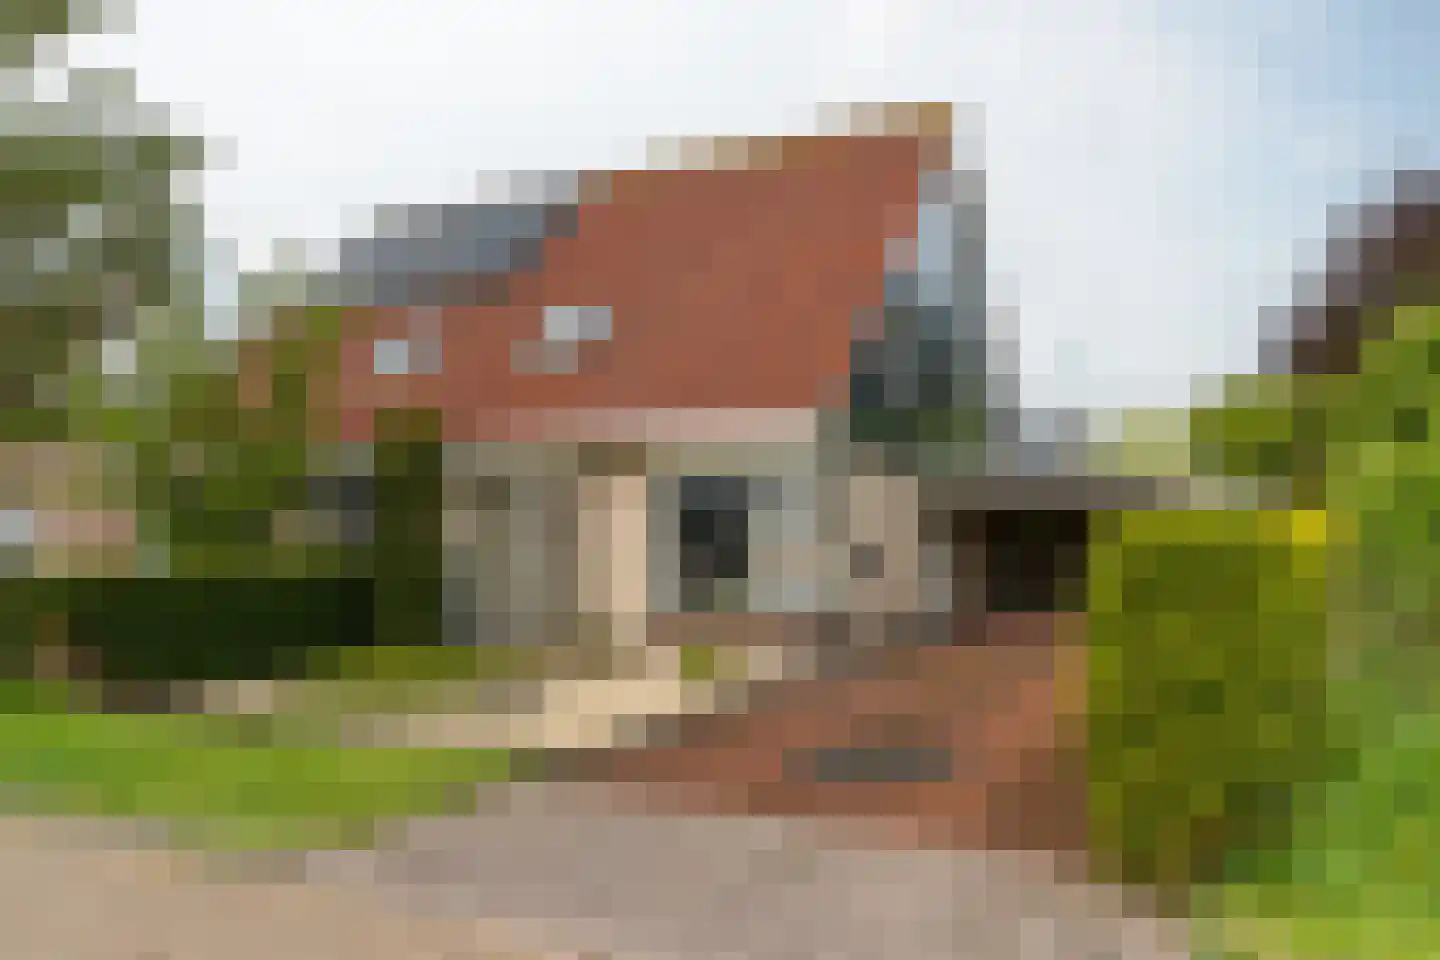
Housing offer in Twijzelerheide

Searching in 19 houses in Twijzelerheide

Connected to: Vastgoed Nederland NVM Makelaars

View the current housing stock in Twijzelerheide and quickly filter by price, living area, rooms and more. There are currently 19 houses in this place within our selection. View also 13 sold houses in Twijzelerheide for extra insight into the local housing market.

Selection

Search and filter homes

Set your preferences and discover homes that suit you.

Total supply 242.904
Filters

Set price, area and other characteristics. Adjust a filter or click on Show homes. Location changes directly above.

Reset filters

You search for

  • Place Twijzelerheide

Selling a home in Twijzelerheide? Compare realtor offers

Get free quotes from real estate agents with local market knowledge. Compare more than 17 real estate agents in Twijzelerheide.

Free request a quote

  • Quotes in Twijzelerheide
  • Non-binding
  • Personal
  • Compare free rates

Selling a home in Twijzelerheide? Compare all real estate agents in Twijzelerheide or view the top 10 real estate agents in Twijzelerheide for extra context for your choice.

Compare multiple quotes

Real estate agents make sharper offers when they know you're comparing — ask for quotes for sale or purchase.

Frequently asked questions about homes in Twijzelerheide

Practical answers about housing supply, sales and comparing real estate agents in Twijzelerheide.

Residential and neighborhood statistics in Twijzelerheide

View current location data on residents, WOZ development, housing stock, energy consumption, business activity and safety in Twijzelerheide. In 2026 were there 1.828 residents. The average WOZ value in 2025 is EUR 294.981.

These figures help to better assess and compare the housing stock in Twijzelerheide with recent sold homes. Orient yourself then on suitable top real estate agents in Twijzelerheide for sales advice in this region.

Residents

1.828

Last year: 2026

Average WOZ

EUR 294.981

Last year: 2025

Average income per person.

EUR 23.890

Source: AllNumbers

Crimes (current year)

24

Total registered

Demographics and WOZ development

Inhabitants per year

Inhabitants per year in Twijzelerheide
Year Residents
2021 1.780
2022 1.800
2023 1.795
2024 1.815
2025 1.830
2026 1.828

Annual WOZ value

WOZ value per year in Twijzelerheide
Year Average WOZ
2021 EUR 200.895
2022 EUR 217.500
2023 EUR 246.515
2024 EUR 268.235
2025 EUR 294.981

Composition of residents

Age build-up

65+: 350 0-15: 305 15-25: 225 25-45: 440 45-65: 510

Education level

Hoger

170

Praktisch

520

Middelbaar

730

Origin of residents (2025)

Europa

45

Nederland

1.750

Buiten Europa

40

Housing stock and construction periods

Types of homes

Hoekwoningen 93
Appartementen 39
Tussenwoningen 115
Vrijstaande woningen 409
Twee-onder-één-kap woningen 123

Construction period of buildings

Voor 1700 0
1700 tot 1900 4
1900 tot 1925 45
1925 tot 1950 119
1950 tot 1970 155
1970 tot 1980 204
1980 tot 1990 66
1990 tot 2000 85
2000 tot 2010 51
2010 tot 2020 17
2020 en later 25

Energy and sustainability

Energy label distribution

Label C

210

Label B

144

Label G

131

Label A

97

Label D

87

Label E

47

Label F

41

Label A+++

15

Label A++

5

Label A+

1

Label A++++

0

Label A+++++

0

Average energy consumption per year

Average energy consumption per year in Twijzelerheide
Year Gas (m3) Electricity (kWh)
2020 1.531 2.901
2021 1.713 3.039
2022 1.310 2.838
2023 1.052 2.657
2024 1.023 2.825

Consumption per house type

Hoekwoning

Gas: 928 • Electricity: 2.006

Huurwoning

Gas: 990 • Electricity: 2.360

Koopwoning

Gas: 1.090 • Electricity: 2.868

Appartement

Gas: 683 • Electricity: 1.375

Tussenwoning

Gas: 771 • Electricity: 1.813

Vrijstaande woning

Gas: 1.106 • Electricity: 2.966

Twee-onder-één-kap woning

Gas: 1.064 • Electricity: 2.700

Business activity in Twijzelerheide (2025)

Handel en HORECA 55
Nijverheid en energie 65
Zakelijke dienstverlening 25
Overheid, onderwijs en zorg 25
Landbouw, bosbouw en visserij 20
Vervoer, informatie en communicatie 5
Financiele diensten en onroerendgoed 0
Cultuur, recreatie en overige diensten 25

Total number of company establishments: 220

Recent crime statistics

Recent crime statistics in Twijzelerheide
Period Crimes
jan 2026 3
jul 2025 2
jun 2025 2
mei 2025 3
mrt 2025 2
mrt 2026 2
nov 2024 2
nov 2025 1
okt 2024 1
okt 2025 3
sep 2024 3
sep 2025 0

These figures give an indicative picture of safety trends in the living environment of Twijzelerheide.

Frequently asked questions about living in Twijzelerheide

Short answers based on current local statistics, handy for a quick comparison of the living environment.

Hoeveel inwoners heeft Twijzelerheide?

Twijzelerheide telt in 2026 ongeveer 1.828 inwoners.

Wat is de gemiddelde WOZ-waarde in Twijzelerheide?

De gemiddelde WOZ-waarde in Twijzelerheide is in 2025 circa € 294.981.

Wat is het gemiddelde inkomen per inwoner in Twijzelerheide?

Het gemiddelde inkomen per inwoner in Twijzelerheide ligt rond € 23.890 per jaar.

Hoe veilig is wonen in Twijzelerheide?

Voor het huidige jaar gaat het om ongeveer 24 geregistreerde misdrijven. Gebruik deze cijfers als indicatie en vergelijk trends per periode.

Welke woningtypen komen het meest voor in Twijzelerheide?

In Twijzelerheide komt vooral "Vrijstaande woningen" veel voor, met ongeveer 409 woningen.

Receive free, non-binding quotes

Compare multiple real estate agents and choose the best match.