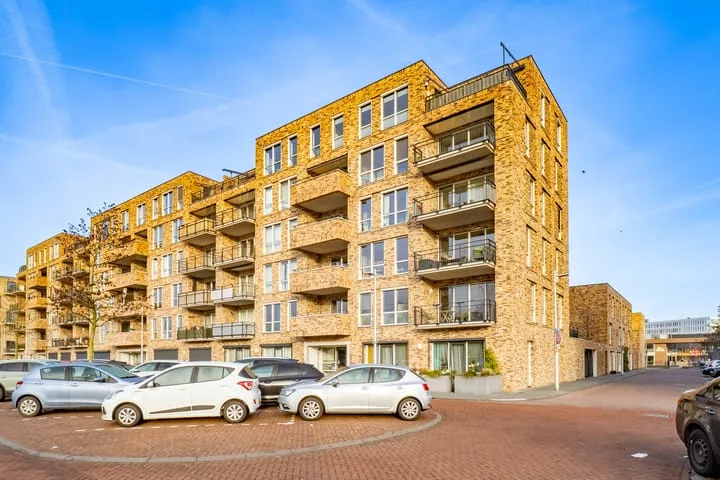
- Sold
Padangstraat 18
3531TC Utrecht
€ 625.000 k.k.
€ 5.841/m²
- Living area
- 107 m²
- Land area
- 68 m²
- Bedrooms
- 4
Searching in 5.071 houses in Utrecht
Type to search. Use arrow down and arrow up to navigate through results and press Enter to open.
Hidden search suggestions.
View current properties in Utrecht or search targeted on street, postal code and property characteristics.
View the current housing stock in Utrecht and quickly filter by price, living area, rooms and more. There are currently 5.071 houses in this place within our selection. View also 3.928 sold houses in Utrecht for extra insight into the local housing market.
3531TC Utrecht
€ 625.000 k.k.
€ 5.841/m²
3552AJ Utrecht
€ 550.000 k.k.
€ 5.555/m²
3531CZ Utrecht
€ 515.000 k.k.
€ 7.054/m²
3527RA Utrecht
€ 375.000 k.k.
€ 4.870/m²
3544SC Utrecht
€ 475.000 k.k.
€ 5.523/m²
3544VP Utrecht
€ 615.000 k.k.
€ 4.522/m²
3583EB Utrecht
€ 450.000 k.k.
€ 8.490/m²
3582VA Utrecht
€ 249.000 k.k.
€ 8.586/m²
3545CK Utrecht
€ 995.000 k.k.
€ 5.887/m²
3581TW Utrecht
€ 595.000 k.k.
€ 7.727/m²
3582PL Utrecht
€ 700.000 k.k.
€ 5.833/m²
3555CW Utrecht
€ 275.000 k.k.
€ 8.088/m²
3531EZ Utrecht
€ 495.000 k.k.
€ 6.265/m²
3571PC Utrecht
€ 395.000 k.k.
€ 5.896/m²
3551EN Utrecht
€ 525.000 k.k.
€ 6.481/m²
3512EV Utrecht
€ 495.000 k.k.
€ 8.839/m²
3553BL Utrecht
€ 589.000 k.k.
€ 5.663/m²
3511VZ Utrecht
€ 345.000 k.k.
€ 7.500/m²
3511MT Utrecht
€ 525.000 k.k.
€ 6.481/m²
3553RG Utrecht
€ 369.000 k.k.
€ 7.851/m²
3581LS Utrecht
€ 675.000 k.k.
€ 7.031/m²
3533CG Utrecht
€ 650.000 k.k.
€ 5.701/m²
3543EB Utrecht
€ 430.000 k.k.
€ 6.718/m²
3581SB Utrecht
€ 599.000 k.k.
€ 6.175/m²
3512EA Utrecht
€ 525.000 k.k.
€ 6.034/m²
3524CT Utrecht
€ 419.000 k.k.
€ 3.708/m²
3553HX Utrecht
€ 400.000 k.k.
€ 5.063/m²
3512LS Utrecht
€ 400.000 k.k.
€ 7.843/m²
Get free quotes from realtors with local market knowledge in Utrecht.
Woning verkopen in Utrecht? Bekijk de verkoopgerichte gids huis verkopen in Utrecht, vergelijk alle makelaars in Utrecht of bekijk de top 10 makelaars in Utrecht voor extra context bij je keuze.
Makelaars maken scherpere voorstellen als ze weten dat je vergelijkt — vraag offertes aan voor verkoop of aankoop.
Practical answers about housing supply, sales and comparing real estate agents in Utrecht.
The costs of a real estate agent in Utrecht depend on commission, start-up costs, property presentation and the chosen service. View the real estate agents in Utrecht and request multiple quotes to compare rates and approach properly.
Within our selection, we are currently showing 5.071 houses in Utrecht. View also the sold houses in Utrecht to compare the current offering with recent transactions.
Take into account not only price and living area but also maintenance, energy label, location, outdoor space and sales status. This way you compare houses in Utrecht on more than just the asking price.
A local real estate agent knows the neighborhoods, recent transactions and demand in Utrecht. By comparing agents you get a better insight into fees, sales strategy and expected yield; the top 10 in Utrecht gives a handy starting point.
Yes, when making a sales plan, a valuation in Utrecht is wise. You gain insight into a realistic asking price and can then compare offers from real estate agents specifically.
View current location data on residents, WOZ development, housing stock, energy consumption, business activity and safety in Utrecht. In 2025 were there 325.510 residents. The average WOZ value in 2025 is EUR 474.416.
These figures help to better assess and compare the housing stock in Utrecht with recent sold homes. Orient yourself then on suitable top real estate agents in Utrecht for sales advice in this region.
Residents
325.510
Last year: 2025
Average WOZ
EUR 474.416
Last year: 2025
Average income per person.
EUR 38.255
Source: AllNumbers
Crimes (current year)
25.985
Total registered
| Year | Residents |
|---|---|
| 2021 | 308.685 |
| 2022 | 310.610 |
| 2023 | 316.460 |
| 2024 | 323.020 |
| 2025 | 325.510 |
| Year | Average WOZ |
|---|---|
| 2021 | EUR 349.277 |
| 2022 | EUR 381.193 |
| 2023 | EUR 442.579 |
| 2024 | EUR 435.454 |
| 2025 | EUR 474.416 |
Hoger
148.860
Praktisch
45.840
Middelbaar
67.680
Europa
37.515
Nederland
186.915
Buiten Europa
101.045
Label A
47.799
Label C
25.699
Label B
17.523
Label D
13.066
Label F
12.655
Label G
11.728
Label E
11.306
Label A+
9.677
Label A++
5.013
Label A+++
4.232
Label A++++
725
Label A+++++
21
| Year | Gas (m3) | Electricity (kWh) |
|---|---|---|
| 2020 | 664 | 2.253 |
| 2021 | 740 | 2.328 |
| 2022 | 572 | 2.170 |
| 2023 | 484 | 2.028 |
| 2024 | 468 | 2.042 |
Hoekwoning
Gas: 791 • Electricity: 2.601
Huurwoning
Gas: 421 • Electricity: 1.821
Koopwoning
Gas: 587 • Electricity: 2.316
Appartement
Gas: 368 • Electricity: 1.760
Tussenwoning
Gas: 700 • Electricity: 2.361
Vrijstaande woning
Gas: 1.325 • Electricity: 3.953
Twee-onder-één-kap woning
Gas: 898 • Electricity: 3.142
Total number of company establishments: 55.750
| Period | Crimes |
|---|---|
| jan 2025 | 1.938 |
| jan 2026 | 2.042 |
| jul 2025 | 2.284 |
| jun 2025 | 2.296 |
| mei 2025 | 2.085 |
| mrt 2025 | 2.095 |
| nov 2024 | 2.183 |
| nov 2025 | 2.313 |
| okt 2024 | 2.124 |
| okt 2025 | 2.340 |
| sep 2024 | 1.881 |
| sep 2025 | 2.221 |
These figures give an indicative picture of safety trends in the living environment of Utrecht.
Short answers based on current local statistics, handy for a quick comparison of the living environment.
Utrecht telt in 2025 ongeveer 325.510 inwoners.
De gemiddelde WOZ-waarde in Utrecht is in 2025 circa € 474.416.
Het gemiddelde inkomen per inwoner in Utrecht ligt rond € 38.255 per jaar.
Voor het huidige jaar gaat het om ongeveer 25.985 geregistreerde misdrijven. Gebruik deze cijfers als indicatie en vergelijk trends per periode.
In Utrecht komt vooral "Appartementen" veel voor, met ongeveer 108.137 woningen.