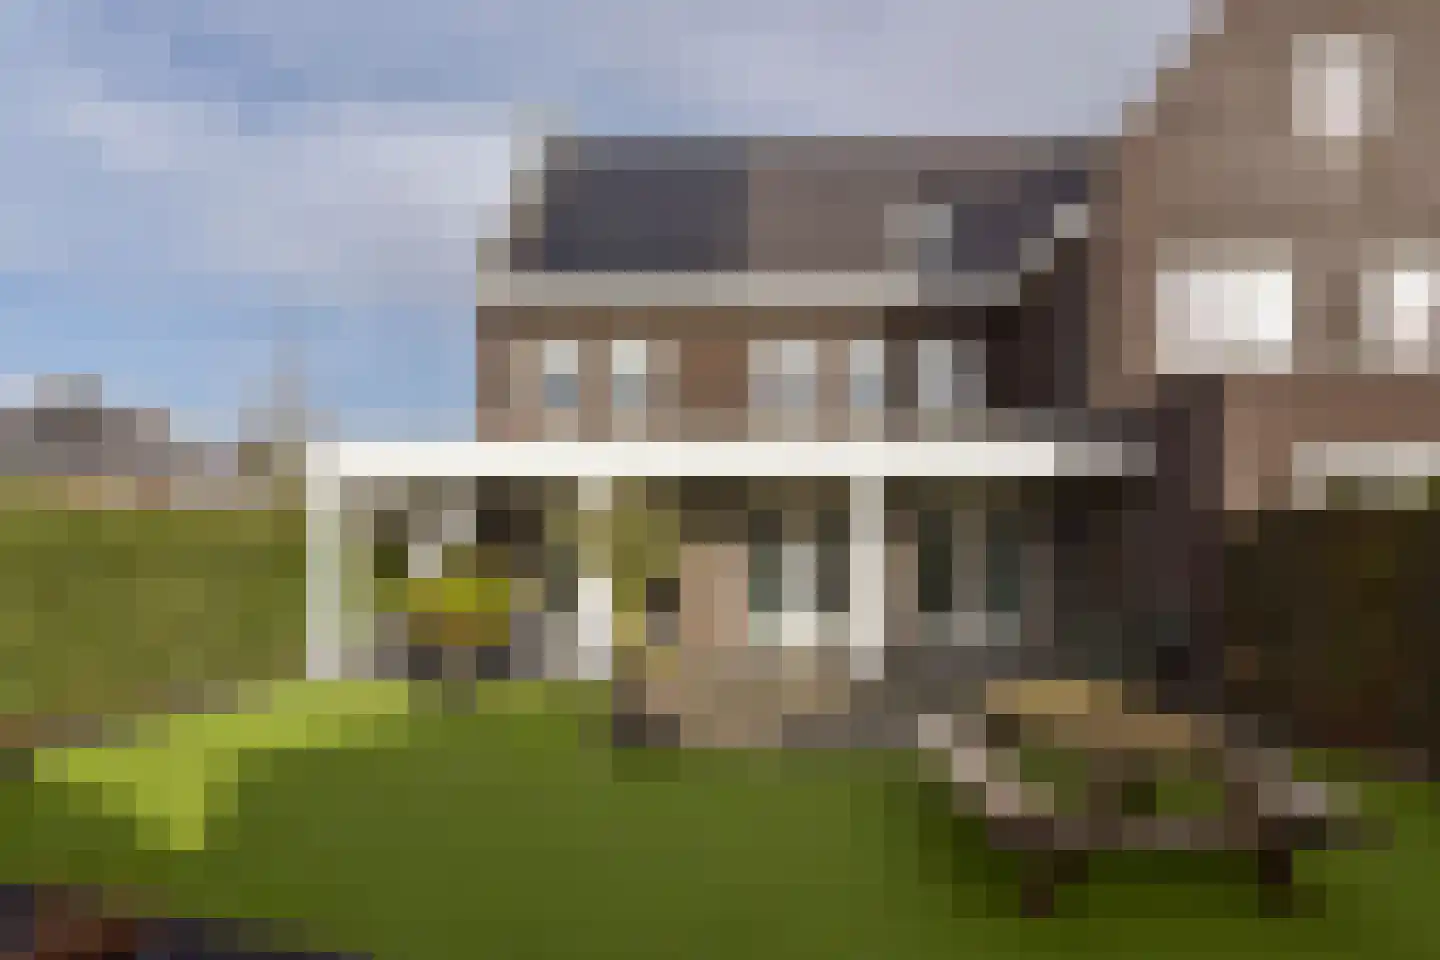
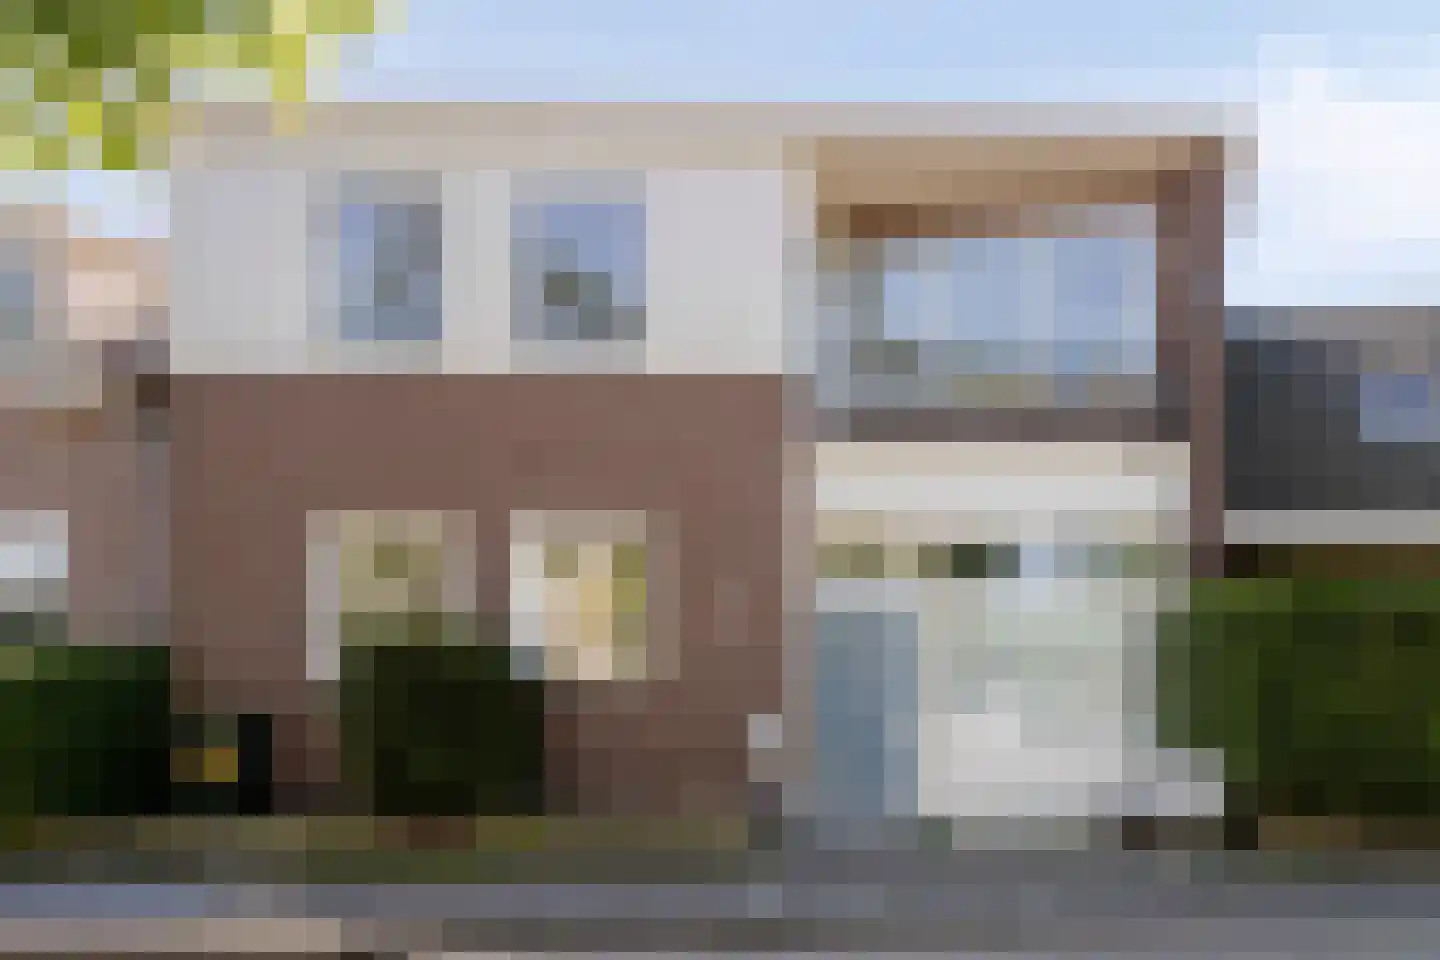
Houses sold in Vinkeveen

View 83 sold houses in Vinkeveen

Connected to: Vastgoed Nederland NVM Makelaars

On this page you will find recently sold homes in Vinkeveen. Use this overview to better estimate selling prices, popular neighborhoods, and the local housing supply before you choose a real estate agent. Also view the current housing supply with 165 houses in Vinkeveen.

Selection

Search and filter homes

Set your preferences and discover homes that suit you.

Total supply 242.379
Filters

Set price, area and other characteristics. Adjust a filter or click on Show homes. Location changes directly above.

Reset filters

You search for

  • Place Vinkeveen
  • Status Sold

Huis verkopen in Vinkeveen? Vergelijk verkoopmakelaars

Bekijk recente verkopen en ontvang gratis offertes van lokale makelaars. Vergelijk meer dan 37 makelaars in Vinkeveen.

Free request a quote

  • Quotes in Vinkeveen
  • Non-binding
  • Personal
  • Compare free rates

Recent verkocht in Vinkeveen? Lees de verkoopgerichte gids huis verkopen in Vinkeveen, vergelijk verkoopmakelaars in Vinkeveen of bekijk de beste verkoopmakelaars in Vinkeveen voor referentie bij jouw keuze.

Vergelijk meerdere offertes

Makelaars maken scherpere voorstellen als ze weten dat je vergelijkt — vraag offertes aan voor verkoop of aankoop.

Frequently asked questions about sold homes in Vinkeveen

Short answers about housing prices, sold homes and comparing real estate agents in Vinkeveen.

Residential and neighborhood statistics in Vinkeveen

View current location data on residents, WOZ development, housing stock, energy consumption, business activity and safety in Vinkeveen. In 2025 were there 9.710 residents. The average WOZ value in 2025 is EUR 583.000.

These figures help to better assess and compare the housing stock in Vinkeveen with recent sold homes. Orient yourself then on suitable top real estate agents in Vinkeveen for sales advice in this region.

Residents

9.710

Last year: 2025

Average WOZ

EUR 583.000

Last year: 2025

Average income per person.

EUR 42.100

Source: AllNumbers

Crimes (current year)

224

Total registered

Demographics and WOZ development

Inhabitants per year

Inhabitants per year in Vinkeveen
Year Residents
2021 9.490
2022 9.480
2023 9.545
2024 9.600
2025 9.710

Annual WOZ value

WOZ value per year in Vinkeveen
Year Average WOZ
2021 EUR 434.000
2022 EUR 474.000
2023 EUR 557.000
2024 EUR 555.000
2025 EUR 583.000

Composition of residents

Age build-up

65+: 2.240 0-15: 1.395 15-25: 1.020 25-45: 2.120 45-65: 2.935

Education level

Hoger

2.660

Praktisch

1.560

Middelbaar

2.960

Origin of residents (2025)

Europa

630

Nederland

7.920

Buiten Europa

1.160

Housing stock and construction periods

Types of homes

Hoekwoningen 487
Appartementen 762
Tussenwoningen 1.429
Vrijstaande woningen 830
Twee-onder-één-kap woningen 364

Construction period of buildings

Voor 1700 1
1700 tot 1900 81
1900 tot 1925 56
1925 tot 1950 222
1950 tot 1970 1.133
1970 tot 1980 1.037
1980 tot 1990 616
1990 tot 2000 335
2000 tot 2010 487
2010 tot 2020 350
2020 en later 104

Energy and sustainability

Energy label distribution

Label C

1.232

Label A

1.193

Label B

745

Label D

336

Label G

243

Label F

195

Label E

179

Label A+

39

Label A+++

30

Label A++

24

Label A++++

6

Label A+++++

1

Average energy consumption per year

Average energy consumption per year in Vinkeveen
Year Gas (m3) Electricity (kWh)
2020 1.320 3.070
2021 1.500 3.210
2022 1.170 3.000
2023 1.010 2.850
2024 970 2.900

Consumption per house type

Hoekwoning

Gas: 1.010 • Electricity: 2.570

Huurwoning

Gas: 820 • Electricity: 1.950

Koopwoning

Gas: 1.100 • Electricity: 3.290

Appartement

Gas: 650 • Electricity: 1.850

Tussenwoning

Gas: 850 • Electricity: 2.540

Vrijstaande woning

Gas: 1.520 • Electricity: 4.250

Twee-onder-één-kap woning

Gas: 1.200 • Electricity: 3.360

Business activity in Vinkeveen (2025)

Handel en HORECA 280
Nijverheid en energie 270
Zakelijke dienstverlening 545
Overheid, onderwijs en zorg 235
Landbouw, bosbouw en visserij 35
Vervoer, informatie en communicatie 120
Financiele diensten en onroerendgoed 160
Cultuur, recreatie en overige diensten 185

Total number of company establishments: 1.825

Recent crime statistics

Recent crime statistics in Vinkeveen
Period Crimes
jan 2025 25
jan 2026 9
jul 2025 26
jun 2025 21
mei 2025 19
mrt 2025 12
nov 2024 26
nov 2025 19
okt 2024 17
okt 2025 18
sep 2024 19
sep 2025 19

These figures give an indicative picture of safety trends in the living environment of Vinkeveen.

Frequently asked questions about living in Vinkeveen

Short answers based on current local statistics, handy for a quick comparison of the living environment.

Hoeveel inwoners heeft Vinkeveen?

Vinkeveen telt in 2025 ongeveer 9.710 inwoners.

Wat is de gemiddelde WOZ-waarde in Vinkeveen?

De gemiddelde WOZ-waarde in Vinkeveen is in 2025 circa € 583.000.

Wat is het gemiddelde inkomen per inwoner in Vinkeveen?

Het gemiddelde inkomen per inwoner in Vinkeveen ligt rond € 42.100 per jaar.

Hoe veilig is wonen in Vinkeveen?

Voor het huidige jaar gaat het om ongeveer 224 geregistreerde misdrijven. Gebruik deze cijfers als indicatie en vergelijk trends per periode.

Welke woningtypen komen het meest voor in Vinkeveen?

In Vinkeveen komt vooral "Tussenwoningen" veel voor, met ongeveer 1.429 woningen.

Receive free, non-binding quotes

Compare multiple real estate agents and choose the best match.