- Sold
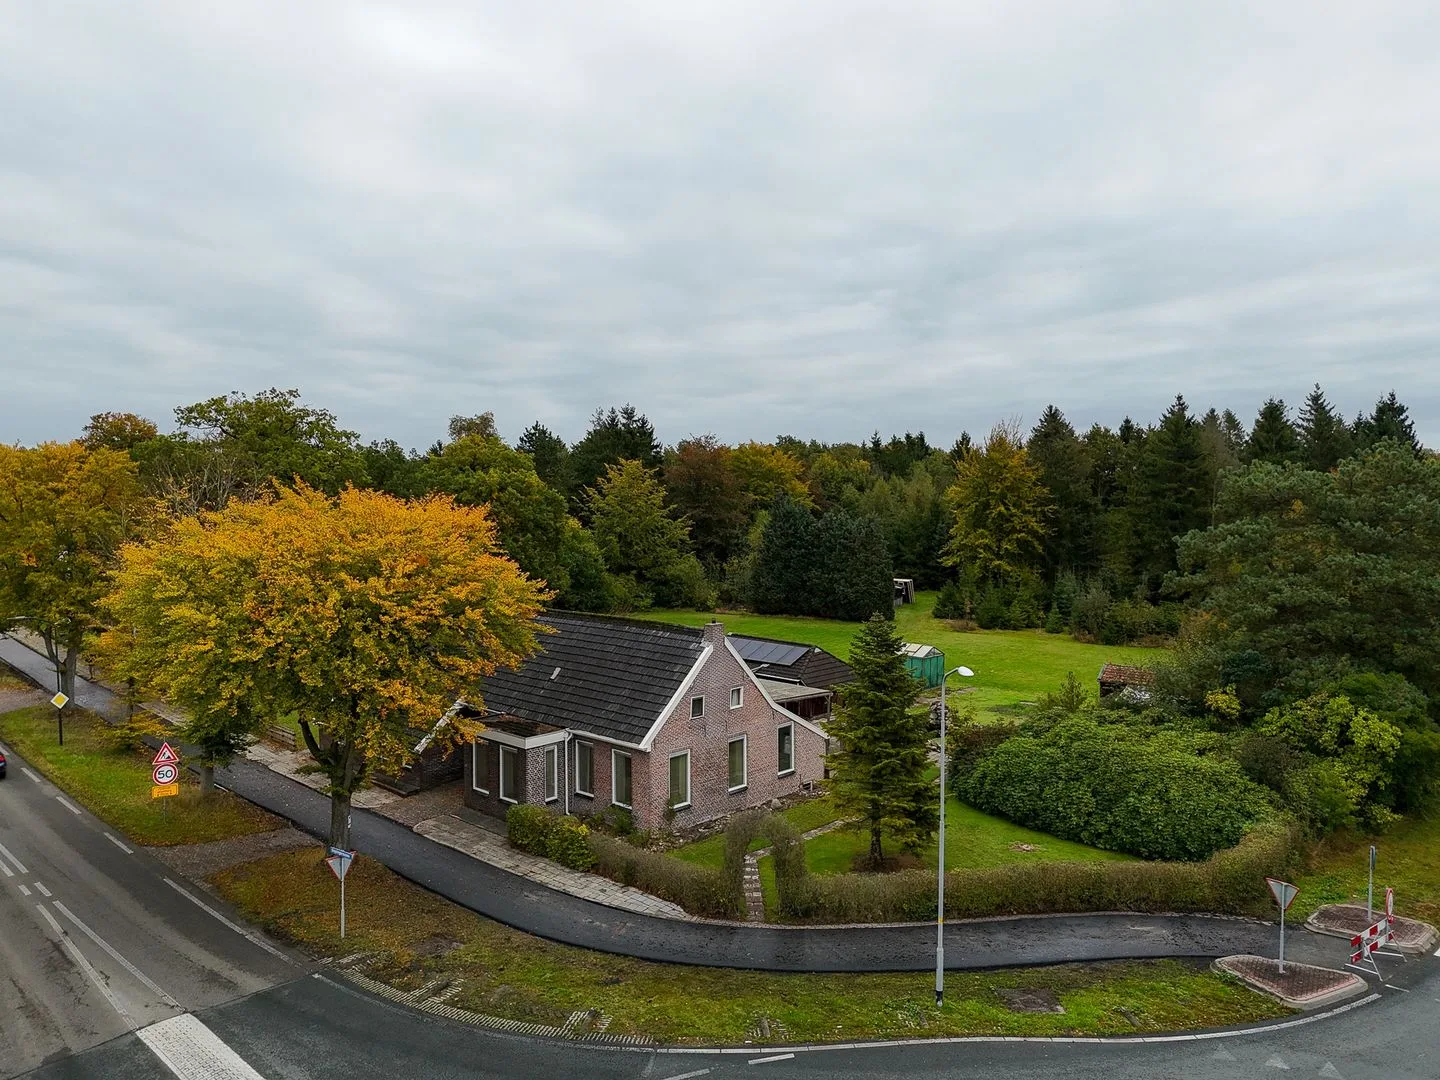
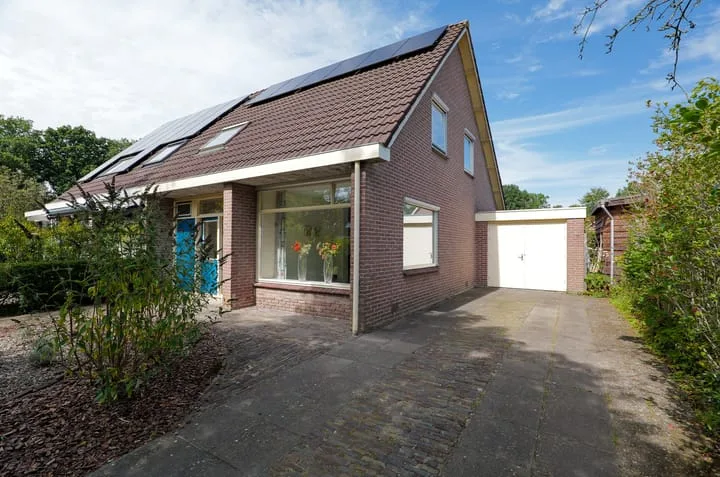
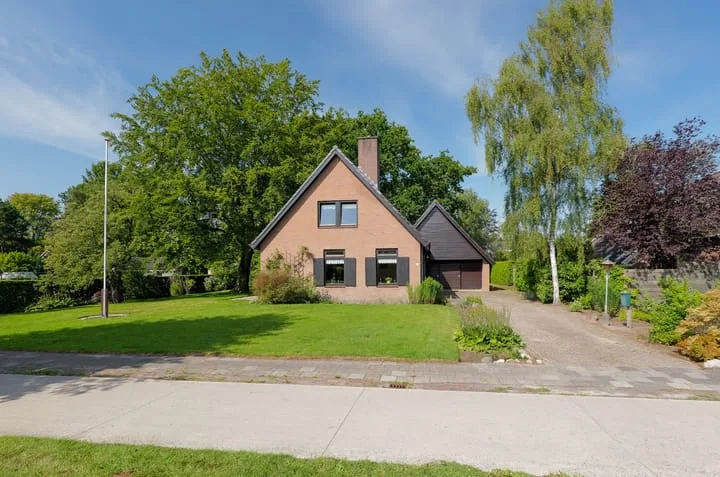
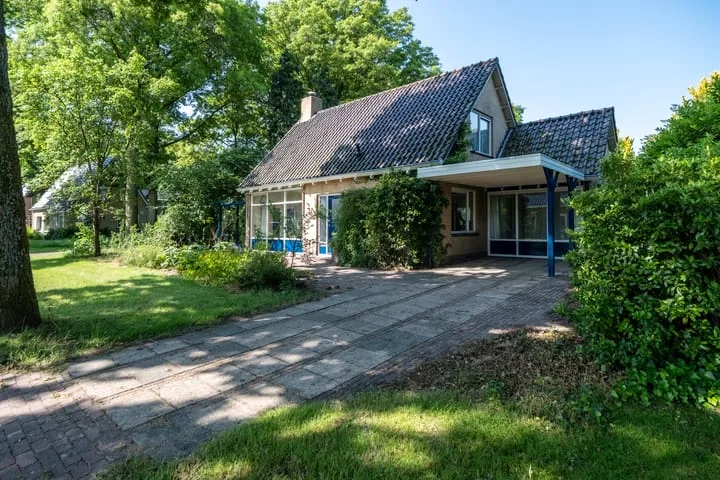
Tynaarlosestraat 49 a
9481AB Vries
€ 525.000 k.k.
€ 3.387/m²
- Living area
- 155 m²
- Land area
- 735 m²
- Bedrooms
- 6
Searching in 54 houses in Vries
Type to search. Use arrow down and arrow up to navigate through results and press Enter to open.
Hidden search suggestions.
View current properties in Vries or search targeted on street, postal code and property characteristics.
View the current housing stock in Vries and quickly filter by price, living area, rooms and more. There are currently 54 houses in this place within our selection. View also 42 sold houses in Vries for extra insight into the local housing market.
9481AB Vries
€ 525.000 k.k.
€ 3.387/m²
9481GV Vries
€ 375.000 k.k.
€ 2.586/m²
9481CH Vries
€ 475.000 k.k.
€ 4.797/m²
9481JH Vries
€ 425.000 k.k.
€ 3.102/m²
9481HP Vries
€ 275.000 k.k.
€ 2.619/m²
9481BJ Vries
€ 1.245.000 k.k.
€ 2.168/m²
9481AT Vries
€ 700.000 k.k.
€ 2.811/m²
9481GV Vries
€ 325.000 k.k.
€ 2.480/m²
9481HH Vries
€ 375.000 k.k.
€ 4.076/m²
9481EP Vries
€ 895.000 k.k.
€ 4.013/m²
9481EK Vries
€ 299.000 k.k.
€ 4.333/m²
9481AH Vries
€ 325.000 k.k.
€ 3.651/m²
9481GP Vries
€ 385.000 k.k.
€ 3.318/m²
9481GJ Vries
€ 295.000 k.k.
€ 2.418/m²
9481GN Vries
€ 375.000 k.k.
€ 3.504/m²
9481BP Vries
€ 600.000 k.k.
€ 0/m²
9481JG Vries
€ 450.000 k.k.
€ 0/m²
9481CL Vries
€ 400.000 k.k.
€ 0/m²
9481GV Vries
€ 435.000 k.k.
€ 0/m²
9481AR Vries
€ 495.000 k.k.
€ 3.414/m²
9481AR Vries
€ 369.000 k.k.
€ 3.024/m²
9481GA Vries
€ 425.000 k.k.
€ 3.935/m²
9481HE Vries
€ 299.000 k.k.
€ 3.646/m²
9481JH Vries
€ 650.000 k.k.
€ 3.611/m²
9481JD Vries
€ 495.000 k.k.
€ 3.960/m²
9481CK Vries
€ 415.000 k.k.
€ 3.401/m²
Get free quotes from real estate agents with local market knowledge. Compare more than 44 real estate agents in Vries.
Selling a home in Vries? Compare all real estate agents in Vries or view the top 10 real estate agents in Vries for extra context for your choice.
Real estate agents make sharper offers when they know you're comparing — ask for quotes for sale or purchase.
Practical answers about housing supply, sales and comparing real estate agents in Vries.
The costs of a real estate agent in Vries depend on commission, setup costs, property presentation and the chosen service. Compare the 44 real estate agents in Vries via the real estate agent page and request multiple quotes to compare rates and approach well.
Within our selection, we are currently showing 54 houses in Vries. View also the sold houses in Vries to compare the current offering with recent transactions.
Take into account not only price and living area but also maintenance, energy label, location, outdoor space and sales status. This way you compare houses in Vries on more than just the asking price.
A local real estate agent knows the neighborhoods, recent transactions and demand in Vries. By comparing 44 real estate agents in the region you get a better insight into prices, sales strategy and expected yield; the top 10 in Vries provides a useful starting point.
Yes, when making a sales plan, a valuation in Vries is wise. You gain insight into a realistic asking price and can then compare offers from real estate agents specifically.
View current location data on residents, WOZ development, housing stock, energy consumption, business activity and safety in Vries. In 2025 were there 4.180 residents. The average WOZ value in 2025 is EUR 365.000.
These figures help to better assess and compare the housing stock in Vries with recent sold homes. Orient yourself then on suitable top real estate agents in Vries for sales advice in this region.
Residents
4.180
Last year: 2025
Average WOZ
EUR 365.000
Last year: 2025
Average income per person.
EUR 35.200
Source: AllNumbers
Crimes (current year)
81
Total registered
| Year | Residents |
|---|---|
| 2021 | 4.045 |
| 2022 | 4.045 |
| 2023 | 4.125 |
| 2024 | 4.210 |
| 2025 | 4.180 |
| Year | Average WOZ |
|---|---|
| 2021 | EUR 266.000 |
| 2022 | EUR 296.000 |
| 2023 | EUR 337.000 |
| 2024 | EUR 347.000 |
| 2025 | EUR 365.000 |
Hoger
1.070
Praktisch
810
Middelbaar
1.140
Europa
205
Nederland
3.710
Buiten Europa
270
Label C
603
Label A
359
Label B
355
Label D
169
Label G
143
Label F
101
Label E
76
Label A++++
51
Label A+++
30
Label A++
22
Label A+
21
Label A+++++
1
| Year | Gas (m3) | Electricity (kWh) |
|---|---|---|
| 2020 | 1.560 | 2.790 |
| 2021 | 1.770 | 2.850 |
| 2022 | 1.380 | 2.630 |
| 2023 | 1.130 | 2.470 |
| 2024 | 1.060 | 2.620 |
Hoekwoning
Gas: 1.010 • Electricity: 1.870
Huurwoning
Gas: 920 • Electricity: 1.900
Koopwoning
Gas: 1.200 • Electricity: 2.680
Appartement
Gas: 790 • Electricity: 2.000
Tussenwoning
Gas: 920 • Electricity: 1.810
Vrijstaande woning
Gas: 1.410 • Electricity: 3.170
Twee-onder-één-kap woning
Gas: 1.120 • Electricity: 2.730
Total number of company establishments: 445
| Period | Crimes |
|---|---|
| jan 2025 | 8 |
| jan 2026 | 4 |
| jul 2025 | 12 |
| jun 2025 | 12 |
| mei 2025 | 5 |
| mrt 2025 | 7 |
| nov 2024 | 7 |
| nov 2025 | 5 |
| okt 2024 | 7 |
| okt 2025 | 8 |
| sep 2024 | 5 |
| sep 2025 | 8 |
These figures give an indicative picture of safety trends in the living environment of Vries.
Short answers based on current local statistics, handy for a quick comparison of the living environment.
Vries telt in 2025 ongeveer 4.180 inwoners.
De gemiddelde WOZ-waarde in Vries is in 2025 circa € 365.000.
Het gemiddelde inkomen per inwoner in Vries ligt rond € 35.200 per jaar.
Voor het huidige jaar gaat het om ongeveer 81 geregistreerde misdrijven. Gebruik deze cijfers als indicatie en vergelijk trends per periode.
In Vries komt vooral "Vrijstaande woningen" veel voor, met ongeveer 644 woningen.