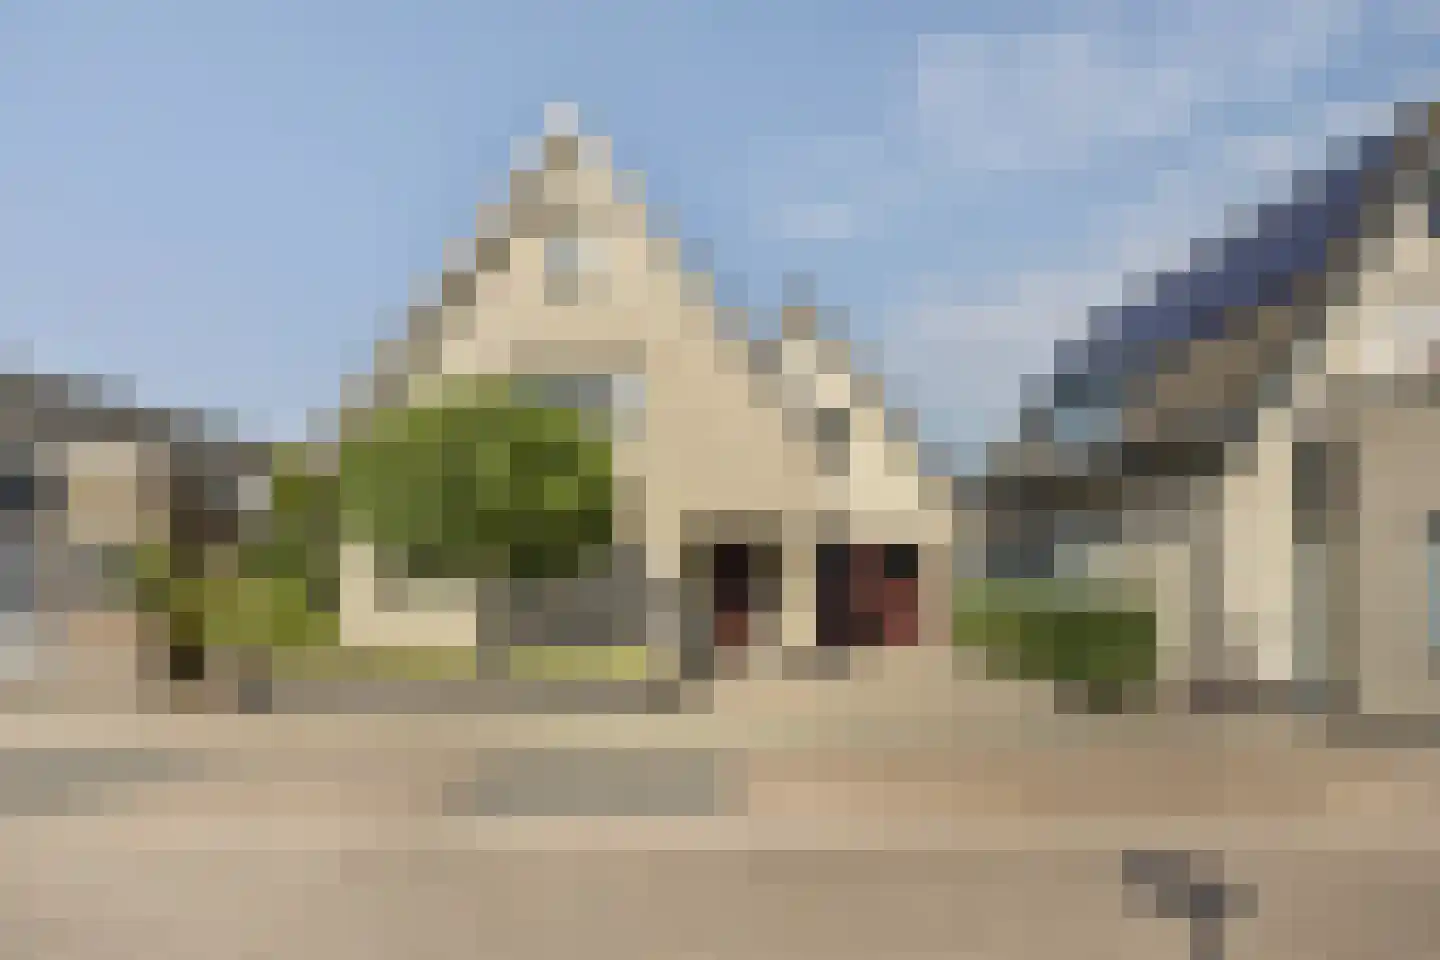
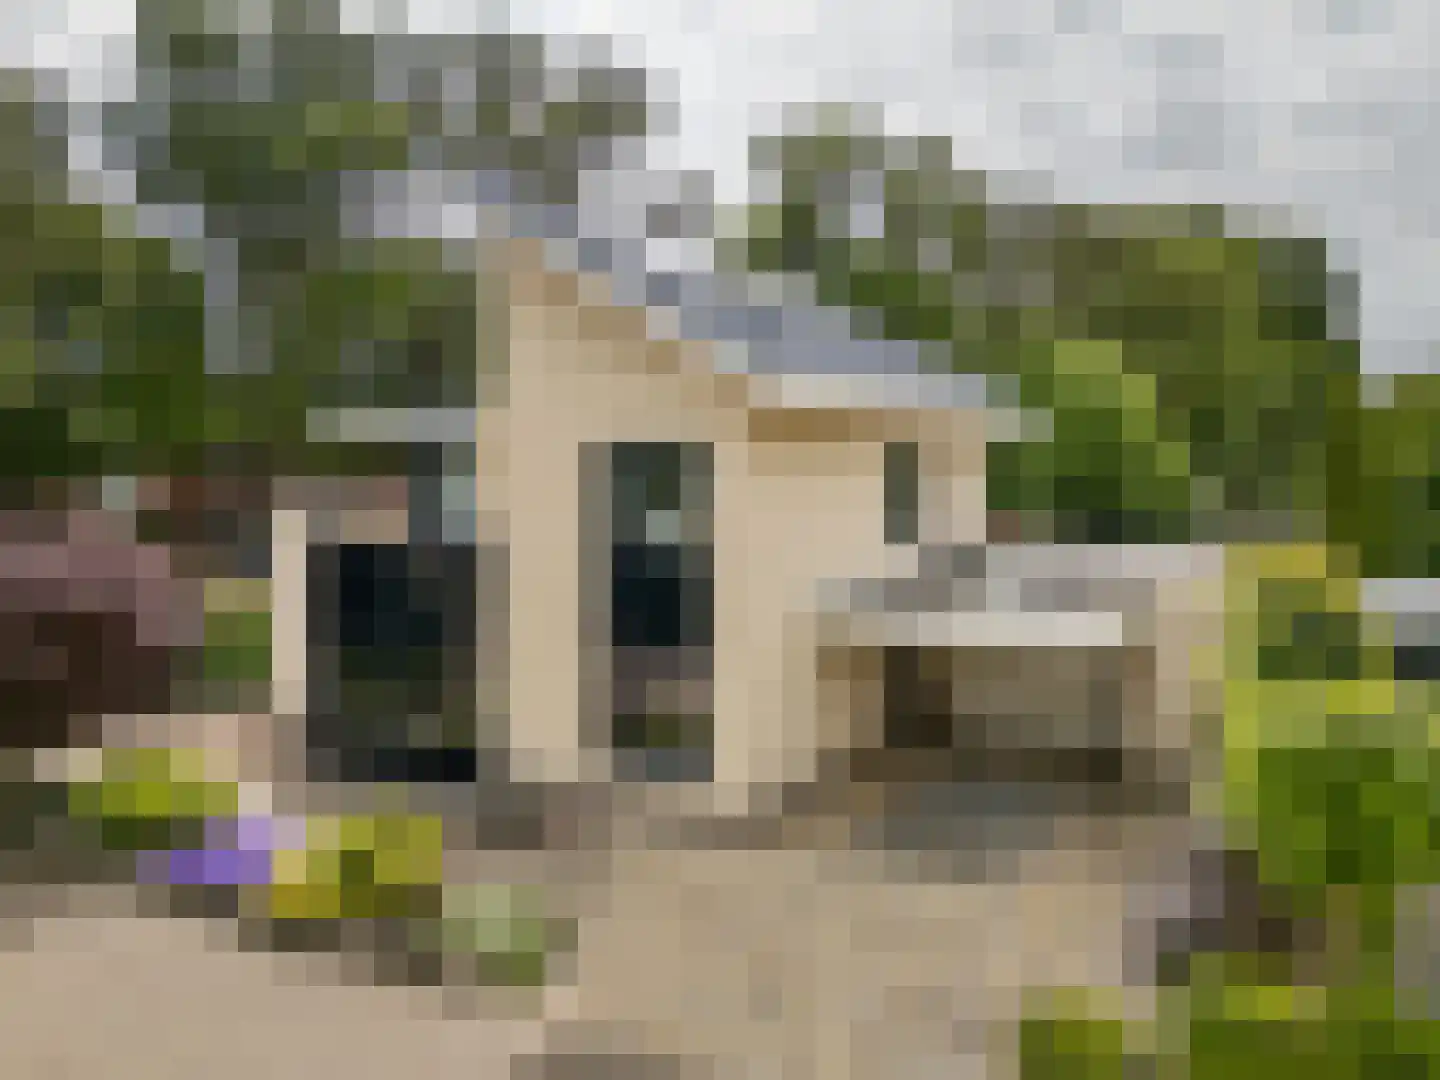
- Available
Mussenlaan 28
4214EH Vuren
€ 385.000 k.k.
€ 4.278/m²
- Living area
- 90 m²
- Land area
- 150 m²
- Bedrooms
- 3
Searching in 24 houses in Vuren
Type to search. Use arrow down and arrow up to navigate through results and press Enter to open.
Hidden search suggestions.
View current properties in Vuren or search targeted on street, postal code and property characteristics.
View the current housing stock in Vuren and quickly filter by price, living area, rooms and more. There are currently 24 houses in this place within our selection. View also 17 sold houses in Vuren for extra insight into the local housing market.
4214EH Vuren
€ 385.000 k.k.
€ 4.278/m²
4214GE Vuren
€ 895.000 k.k.
4214GA Vuren
€ 950.000 k.k.
€ 4.847/m²
4214LC Vuren
€ 1.045.000 k.k.
€ 3.567/m²
4214LN Vuren
€ 3.450.000 k.k.
€ 8.892/m²
4214GA Vuren
€ 670.000 k.k.
€ 3.681/m²
4214DA Vuren
€ 500.000 k.k.
€ 4.065/m²
4214LB Vuren
Price upon request
4214EJ Vuren
€ 485.000 k.k.
€ 3.849/m²
4214GC Vuren
€ 695.000 k.k.
€ 4.088/m²
4214DG Vuren
€ 450.000 k.k.
€ 4.054/m²
4214DV Vuren
€ 440.000 k.k.
€ 4.400/m²
4214DG Vuren
€ 400.000 k.k.
€ 4.000/m²
4214DM Vuren
€ 775.000 k.k.
€ 3.836/m²
4214DS Vuren
€ 525.000 k.k.
€ 3.804/m²
4214GG Vuren
€ 415.000 k.k.
€ 3.952/m²
4214DV Vuren
€ 450.000 k.k.
€ 3.515/m²
4214DX Vuren
€ 535.000 k.k.
€ 0/m²
4214EJ Vuren
€ 485.000 k.k.
€ 4.449/m²
4214DB Vuren
€ 515.000 k.k.
€ 4.401/m²
4214EE Vuren
€ 310.000 k.k.
€ 3.780/m²
4214LC Vuren
€ 450.000 k.k.
€ 6.081/m²
4214LE Vuren
€ 875.000 k.k.
€ 4.419/m²
4214DK Vuren
€ 385.000 k.k.
€ 3.811/m²
Get free quotes from real estate agents with local market knowledge. Compare more than 30 real estate agents in Vuren.
Selling a home in Vuren? Compare all real estate agents in Vuren or view the top 10 real estate agents in Vuren for extra context for your choice.
Real estate agents make sharper offers when they know you're comparing — ask for quotes for sale or purchase.
Practical answers about housing supply, sales and comparing real estate agents in Vuren.
The costs of a real estate agent in Vuren depend on commission, setup costs, property presentation and the chosen service. Compare the 30 real estate agents in Vuren via the real estate agent page and request multiple quotes to compare rates and approach well.
Within our selection, we are currently showing 24 houses in Vuren. View also the sold houses in Vuren to compare the current offering with recent transactions.
Take into account not only price and living area but also maintenance, energy label, location, outdoor space and sales status. This way you compare houses in Vuren on more than just the asking price.
A local real estate agent knows the neighborhoods, recent transactions and demand in Vuren. By comparing 30 real estate agents in the region you get a better insight into prices, sales strategy and expected yield; the top 10 in Vuren provides a useful starting point.
Yes, when making a sales plan, a valuation in Vuren is wise. You gain insight into a realistic asking price and can then compare offers from real estate agents specifically.
View current location data on residents, WOZ development, housing stock, energy consumption, business activity and safety in Vuren. In 2025 were there 2.158 residents. The average WOZ value in 2025 is EUR 422.252.
These figures help to better assess and compare the housing stock in Vuren with recent sold homes. Orient yourself then on suitable top real estate agents in Vuren for sales advice in this region.
Residents
2.158
Last year: 2025
Average WOZ
EUR 422.252
Last year: 2025
Average income per person.
EUR 32.238
Source: AllNumbers
Crimes (current year)
58
Total registered
| Year | Residents |
|---|---|
| 2021 | 2.082 |
| 2022 | 2.137 |
| 2023 | 2.134 |
| 2024 | 2.149 |
| 2025 | 2.158 |
| Year | Average WOZ |
|---|---|
| 2021 | EUR 288.028 |
| 2022 | EUR 317.819 |
| 2023 | EUR 370.825 |
| 2024 | EUR 390.508 |
| 2025 | EUR 422.252 |
Hoger
331
Praktisch
400
Middelbaar
711
Europa
117
Nederland
1.887
Buiten Europa
158
Label A
314
Label C
227
Label B
126
Label D
126
Label A+
59
Label F
50
Label G
32
Label E
14
Label A++
6
Label A+++
3
Label A+++++
1
Label A++++
0
| Year | Gas (m3) | Electricity (kWh) |
|---|---|---|
| 2020 | 1.239 | 3.211 |
| 2021 | 1.427 | 3.219 |
| 2022 | 1.043 | 3.016 |
| 2023 | 891 | 2.896 |
| 2024 | 867 | 2.958 |
Hoekwoning
Gas: 763 • Electricity: 2.409
Huurwoning
Gas: 785 • Electricity: 2.022
Koopwoning
Gas: 943 • Electricity: 3.246
Appartement
Gas: 552 • Electricity: 1.500
Tussenwoning
Gas: 671 • Electricity: 2.170
Vrijstaande woning
Gas: 1.195 • Electricity: 4.249
Twee-onder-één-kap woning
Gas: 965 • Electricity: 2.860
Total number of company establishments: 377
| Period | Crimes |
|---|---|
| jan 2026 | 4 |
| jul 2025 | 9 |
| jun 2025 | 4 |
| mei 2025 | 6 |
| mrt 2025 | 1 |
| mrt 2026 | 9 |
| nov 2024 | 10 |
| nov 2025 | 5 |
| okt 2024 | 5 |
| okt 2025 | 6 |
| sep 2024 | 4 |
| sep 2025 | 1 |
These figures give an indicative picture of safety trends in the living environment of Vuren.
Short answers based on current local statistics, handy for a quick comparison of the living environment.
Vuren telt in 2025 ongeveer 2.158 inwoners.
De gemiddelde WOZ-waarde in Vuren is in 2025 circa € 422.252.
Het gemiddelde inkomen per inwoner in Vuren ligt rond € 32.238 per jaar.
Voor het huidige jaar gaat het om ongeveer 58 geregistreerde misdrijven. Gebruik deze cijfers als indicatie en vergelijk trends per periode.
In Vuren komt vooral "Tussenwoningen" veel voor, met ongeveer 319 woningen.