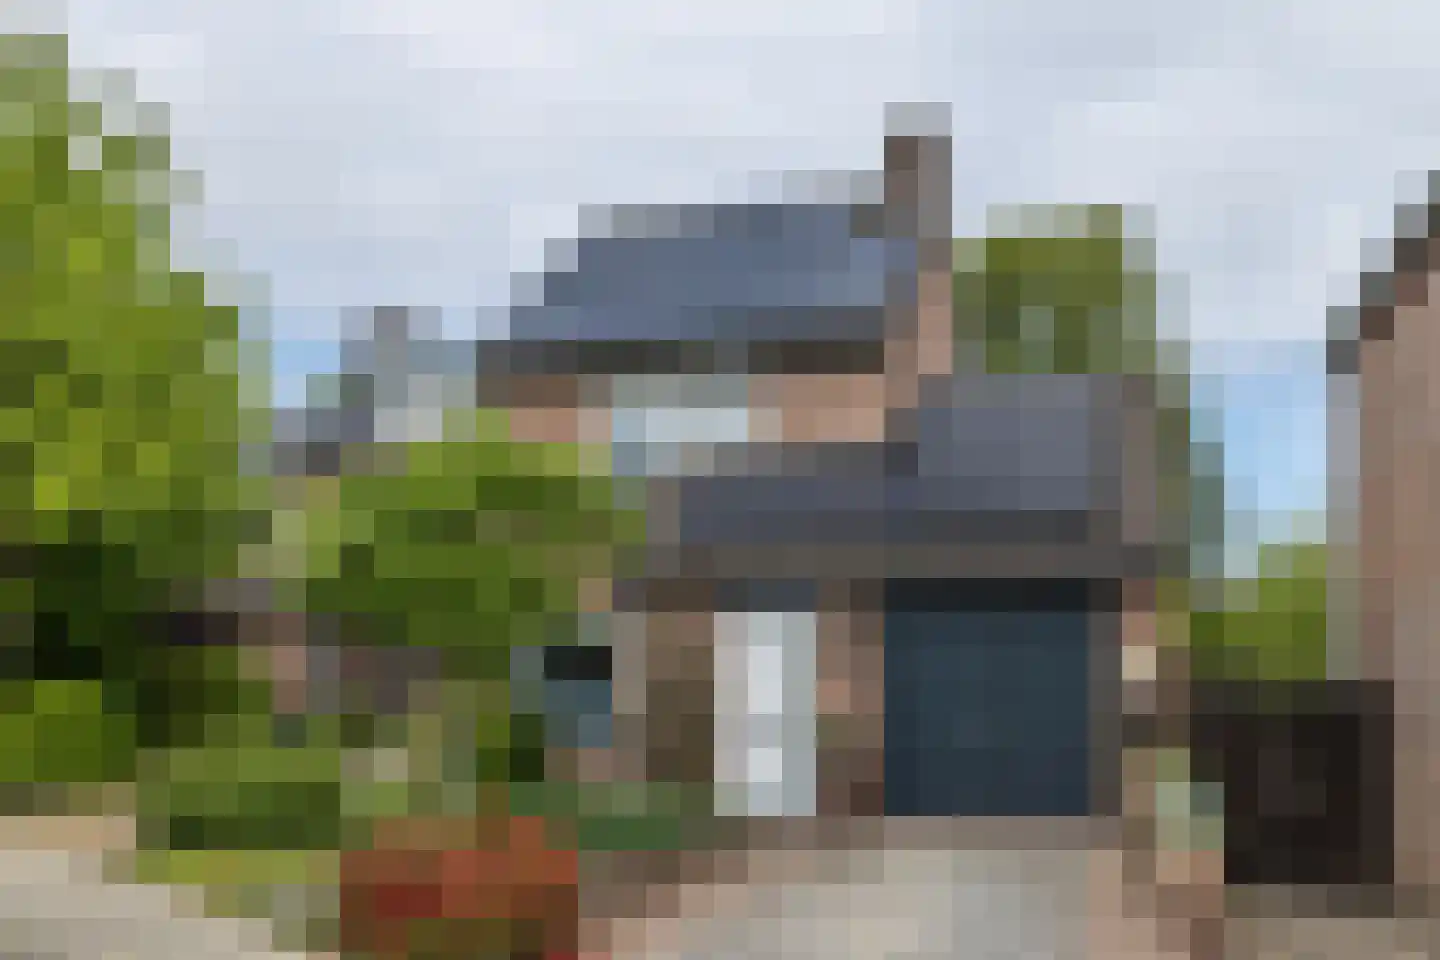
- Available
Rhodestraat 33
6363AX Wijnandsrade
€ 498.000 k.k.
€ 3.037/m²
- Living area
- 164 m²
- Land area
- 430 m²
- Bedrooms
- 5
Searching in 18 houses in Wijnandsrade
Type to search. Use arrow down and arrow up to navigate through results and press Enter to open.
Hidden search suggestions.
View current properties in Wijnandsrade or search targeted on street, postal code and property characteristics.
View the current housing stock in Wijnandsrade and quickly filter by price, living area, rooms and more. There are currently 18 houses in this place within our selection. View also 13 sold houses in Wijnandsrade for extra insight into the local housing market.
6363AX Wijnandsrade
€ 498.000 k.k.
€ 3.037/m²
6363BX Wijnandsrade
€ 2.745 p/m
€ 12/m²
6363BX Wijnandsrade
€ 1.750 p/m
€ 13/m²
6363CT Wijnandsrade
€ 600.000 k.k.
€ 2.135/m²
6363AE Wijnandsrade
€ 399.000 k.k.
€ 3.410/m²
6363CM Wijnandsrade
€ 348.000 k.k.
€ 1.861/m²
6363AT Wijnandsrade
€ 360.000 k.k.
€ 2.250/m²
6363CS Wijnandsrade
€ 275.000 k.k.
€ 1.598/m²
6363BW Wijnandsrade
€ 579.500 k.k.
€ 3.219/m²
6363AE Wijnandsrade
€ 368.000 k.k.
€ 3.092/m²
6363BJ Wijnandsrade
€ 365.000 k.k.
€ 3.543/m²
6363CK Wijnandsrade
€ 795.000 k.k.
€ 3.878/m²
6363AV Wijnandsrade
€ 388.000 k.k.
€ 3.373/m²
6363BR Wijnandsrade
€ 310.000 k.k.
€ 3.483/m²
6363BV Wijnandsrade
€ 349.000 k.k.
€ 3.490/m²
6363BV Wijnandsrade
€ 285.000 k.k.
€ 2.766/m²
6363BG Wijnandsrade
€ 449.000 k.k.
€ 2.721/m²
6363BV Wijnandsrade
€ 400.000 k.k.
€ 0/m²
Get free quotes from real estate agents with local market knowledge. Compare more than 91 real estate agents in Wijnandsrade.
Selling a home in Wijnandsrade? Compare all real estate agents in Wijnandsrade or view the top 10 real estate agents in Wijnandsrade for extra context for your choice.
Real estate agents make sharper offers when they know you're comparing — ask for quotes for sale or purchase.
Practical answers about housing supply, sales and comparing real estate agents in Wijnandsrade.
The costs of a real estate agent in Wijnandsrade depend on commission, setup costs, property presentation and the chosen service. Compare the 91 real estate agents in Wijnandsrade via the real estate agent page and request multiple quotes to compare rates and approach well.
Within our selection, we are currently showing 18 houses in Wijnandsrade. View also the sold houses in Wijnandsrade to compare the current offering with recent transactions.
Take into account not only price and living area but also maintenance, energy label, location, outdoor space and sales status. This way you compare houses in Wijnandsrade on more than just the asking price.
A local real estate agent knows the neighborhoods, recent transactions and demand in Wijnandsrade. By comparing 91 real estate agents in the region you get a better insight into prices, sales strategy and expected yield; the top 10 in Wijnandsrade provides a useful starting point.
Yes, when making a sales plan, a valuation in Wijnandsrade is wise. You gain insight into a realistic asking price and can then compare offers from real estate agents specifically.
View current location data on residents, WOZ development, housing stock, energy consumption, business activity and safety in Wijnandsrade. In 2026 were there 1.608 residents. The average WOZ value in 2025 is EUR 372.000.
These figures help to better assess and compare the housing stock in Wijnandsrade with recent sold homes. Orient yourself then on suitable top real estate agents in Wijnandsrade for sales advice in this region.
Residents
1.608
Last year: 2026
Average WOZ
EUR 372.000
Last year: 2025
Average income per person.
EUR 35.300
Source: AllNumbers
Crimes (current year)
34
Total registered
| Year | Residents |
|---|---|
| 2021 | 1.635 |
| 2022 | 1.630 |
| 2023 | 1.620 |
| 2024 | 1.620 |
| 2025 | 1.615 |
| 2026 | 1.608 |
| Year | Average WOZ |
|---|---|
| 2021 | EUR 275.000 |
| 2022 | EUR 292.000 |
| 2023 | EUR 340.000 |
| 2024 | EUR 340.000 |
| 2025 | EUR 372.000 |
Hoger
450
Praktisch
240
Middelbaar
520
Europa
165
Nederland
1.390
Buiten Europa
60
Label D
201
Label C
195
Label G
78
Label B
76
Label F
69
Label A
62
Label E
44
Label A++
4
Label A+++
3
Label A+
2
Label A++++
1
Label A+++++
0
| Year | Gas (m3) | Electricity (kWh) |
|---|---|---|
| 2020 | 1.620 | 3.300 |
| 2021 | 1.830 | 3.430 |
| 2022 | 1.390 | 3.260 |
| 2023 | 1.130 | 3.120 |
| 2024 | 1.100 | 3.230 |
Hoekwoning
Gas: 990 • Electricity: 2.690
Huurwoning
Gas: 940 • Electricity: 2.170
Koopwoning
Gas: 1.180 • Electricity: 3.360
Appartement
Gas: 930 • Electricity: 1.950
Tussenwoning
Gas: 930 • Electricity: 2.520
Vrijstaande woning
Gas: 1.340 • Electricity: 3.840
Twee-onder-één-kap woning
Gas: 1.090 • Electricity: 2.970
Total number of company establishments: 185
| Period | Crimes |
|---|---|
| jan 2026 | 1 |
| jul 2025 | 5 |
| jun 2025 | 4 |
| mei 2025 | 2 |
| mrt 2025 | 5 |
| mrt 2026 | 1 |
| nov 2024 | 1 |
| nov 2025 | 4 |
| okt 2024 | 6 |
| okt 2025 | 2 |
| sep 2024 | 1 |
| sep 2025 | 4 |
These figures give an indicative picture of safety trends in the living environment of Wijnandsrade.
Short answers based on current local statistics, handy for a quick comparison of the living environment.
Wijnandsrade telt in 2026 ongeveer 1.608 inwoners.
De gemiddelde WOZ-waarde in Wijnandsrade is in 2025 circa € 372.000.
Het gemiddelde inkomen per inwoner in Wijnandsrade ligt rond € 35.300 per jaar.
Voor het huidige jaar gaat het om ongeveer 34 geregistreerde misdrijven. Gebruik deze cijfers als indicatie en vergelijk trends per periode.
In Wijnandsrade komt vooral "Vrijstaande woningen" veel voor, met ongeveer 281 woningen.