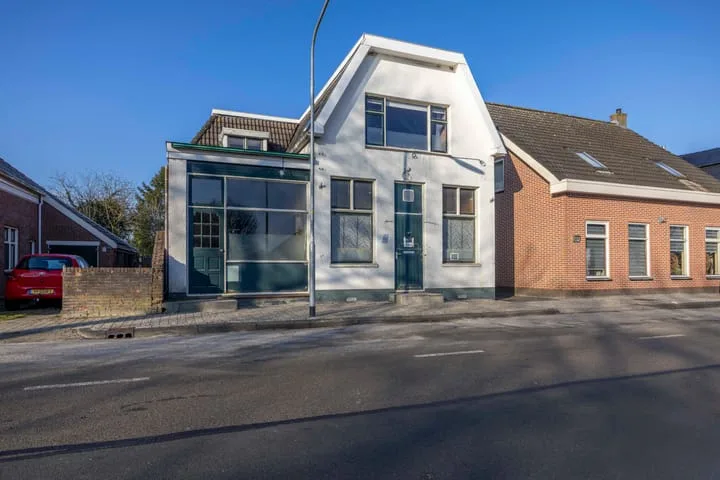
- Sold
Torenstraat 14
9648CT Wildervank
€ 299.500 k.k.
€ 3.291/m²
- Living area
- 91 m²
- Land area
- 366 m²
- Bedrooms
- 4
View 56 sold houses in Wildervank
Type to search. Use arrow down and arrow up to navigate through results and press Enter to open.
Hidden search suggestions.
Compare sold homes in Wildervank or view the current offering in this location directly.
On this page you will find recently sold homes in Wildervank. Use this overview to better estimate selling prices, popular neighborhoods, and the local housing supply before you choose a real estate agent. Also view the current housing supply with 90 houses in Wildervank.
9648CT Wildervank
€ 299.500 k.k.
€ 3.291/m²
9648GG Wildervank
€ 259.500 k.k.
€ 2.595/m²
9648DM Wildervank
€ 499.500 k.k.
€ 3.201/m²
9648GT Wildervank
€ 239.000 k.k.
€ 1.091/m²
9648GL Wildervank
€ 529.500 k.k.
€ 2.877/m²
9648DH Wildervank
€ 549.500 k.k.
€ 4.100/m²
9648LW Wildervank
€ 345.000 k.k.
€ 3.194/m²
9648KL Wildervank
€ 249.500 k.k.
€ 2.741/m²
9648JC Wildervank
€ 189.500 k.k.
€ 1.738/m²
9648KL Wildervank
€ 199.500 k.k.
€ 2.168/m²
9648CM Wildervank
€ 330.000 k.k.
€ 2.357/m²
9648AP Wildervank
€ 235.000 k.k.
€ 2.447/m²
9648CH Wildervank
€ 269.500 k.k.
€ 3.368/m²
9648GV Wildervank
€ 250.000 k.k.
€ 1.436/m²
9648GK Wildervank
€ 225.000 k.k.
€ 2.528/m²
9648AL Wildervank
Price upon request
9648AV Wildervank
€ 259.500 k.k.
€ 1.965/m²
9648AP Wildervank
€ 255.000 k.k.
€ 2.712/m²
9648JL Wildervank
€ 250.000 k.k.
€ 2.747/m²
9648BM Wildervank
Price upon request
9648DW Wildervank
€ 499.500 k.k.
€ 3.567/m²
9648CB Wildervank
€ 250.000 k.k.
€ 2.777/m²
9648KL Wildervank
€ 319.500 k.k.
€ 2.576/m²
9648BC Wildervank
€ 359.000 k.k.
€ 2.804/m²
9648JE Wildervank
€ 449.500 k.k.
€ 1.555/m²
9648JK Wildervank
€ 425.000 k.k.
€ 3.632/m²
9648DA Wildervank
€ 989.500 k.k.
€ 4.006/m²
9648ME Wildervank
€ 519.500 k.k.
€ 3.965/m²
View recent sales and receive free quotes from local real estate agents. Compare more than 17 real estate agents in Wildervank.
Selling your own home in Wildervank? Compare real estate agents in Wildervank or view the best real estate agents in Wildervank as a reference for your choice.
Real estate agents make sharper offers when they know you're comparing — ask for quotes for sale or purchase.
Short answers about housing prices, sold homes and comparing real estate agents in Wildervank.
The costs of a real estate agent in Wildervank vary per office, property type and sales approach. In Wildervank you can compare 17 real estate agents; therefore also look at the real estate agents in Wildervank to better compare fees, presentation and local experience.
On this page we currently show 56 sold houses in Wildervank from our selection. This helps you to better assess recent transactions and the local housing market.
Houses sold in Wildervank give insight into asking prices, house types and neighborhoods where recent transactions have taken place. Compare this also with the current housing stock in Wildervank to better understand the market.
You can use sold homes as a first market indication, but a local real estate agent can better take into account finishing, location, maintenance and current demand in Wildervank.
Compare the 17 real estate agents in Wildervank on local sales experience, reviews, expected yield, commission and marketing approach. View real estate agents in Wildervank or the top 10 agents in Wildervank to quickly discover strong offices.
View current location data on residents, WOZ development, housing stock, energy consumption, business activity and safety in Wildervank. In 2025 were there 5.495 residents. The average WOZ value in 2025 is EUR 287.000.
These figures help to better assess and compare the housing stock in Wildervank with recent sold homes. Orient yourself then on suitable top real estate agents in Wildervank for sales advice in this region.
Residents
5.495
Last year: 2025
Average WOZ
EUR 287.000
Last year: 2025
Average income per person.
EUR 32.400
Source: AllNumbers
Crimes (current year)
143
Total registered
| Year | Residents |
|---|---|
| 2021 | 5.455 |
| 2022 | 5.440 |
| 2023 | 5.505 |
| 2024 | 5.475 |
| 2025 | 5.495 |
| Year | Average WOZ |
|---|---|
| 2021 | EUR 195.000 |
| 2022 | EUR 215.000 |
| 2023 | EUR 250.000 |
| 2024 | EUR 273.000 |
| 2025 | EUR 287.000 |
Hoger
1.050
Praktisch
1.130
Middelbaar
2.140
Europa
300
Nederland
4.905
Buiten Europa
285
Label G
533
Label A
507
Label B
420
Label C
393
Label D
190
Label F
157
Label E
124
Label A+++
122
Label A+
35
Label A++++
24
Label A++
18
Label A+++++
0
| Year | Gas (m3) | Electricity (kWh) |
|---|---|---|
| 2020 | 1.630 | 3.020 |
| 2021 | 1.820 | 3.060 |
| 2022 | 1.400 | 2.820 |
| 2023 | 1.160 | 2.830 |
| 2024 | 1.060 | 3.020 |
Hoekwoning
Gas: 1.070 • Electricity: 2.420
Huurwoning
Gas: 1.060 • Electricity: 1.990
Koopwoning
Gas: 1.190 • Electricity: 3.100
Appartement
Gas: 940 • Electricity: 1.660
Tussenwoning
Gas: 950 • Electricity: 2.260
Vrijstaande woning
Gas: 1.320 • Electricity: 3.430
Twee-onder-één-kap woning
Gas: 1.060 • Electricity: 2.620
Total number of company establishments: 525
| Period | Crimes |
|---|---|
| jan 2025 | 15 |
| jan 2026 | 4 |
| jul 2025 | 14 |
| jun 2025 | 6 |
| mei 2025 | 11 |
| mrt 2025 | 19 |
| nov 2024 | 9 |
| nov 2025 | 12 |
| okt 2024 | 13 |
| okt 2025 | 20 |
| sep 2024 | 9 |
| sep 2025 | 4 |
These figures give an indicative picture of safety trends in the living environment of Wildervank.
Short answers based on current local statistics, handy for a quick comparison of the living environment.
Wildervank telt in 2025 ongeveer 5.495 inwoners.
De gemiddelde WOZ-waarde in Wildervank is in 2025 circa € 287.000.
Het gemiddelde inkomen per inwoner in Wildervank ligt rond € 32.400 per jaar.
Voor het huidige jaar gaat het om ongeveer 143 geregistreerde misdrijven. Gebruik deze cijfers als indicatie en vergelijk trends per periode.
In Wildervank komt vooral "Vrijstaande woningen" veel voor, met ongeveer 1.157 woningen.