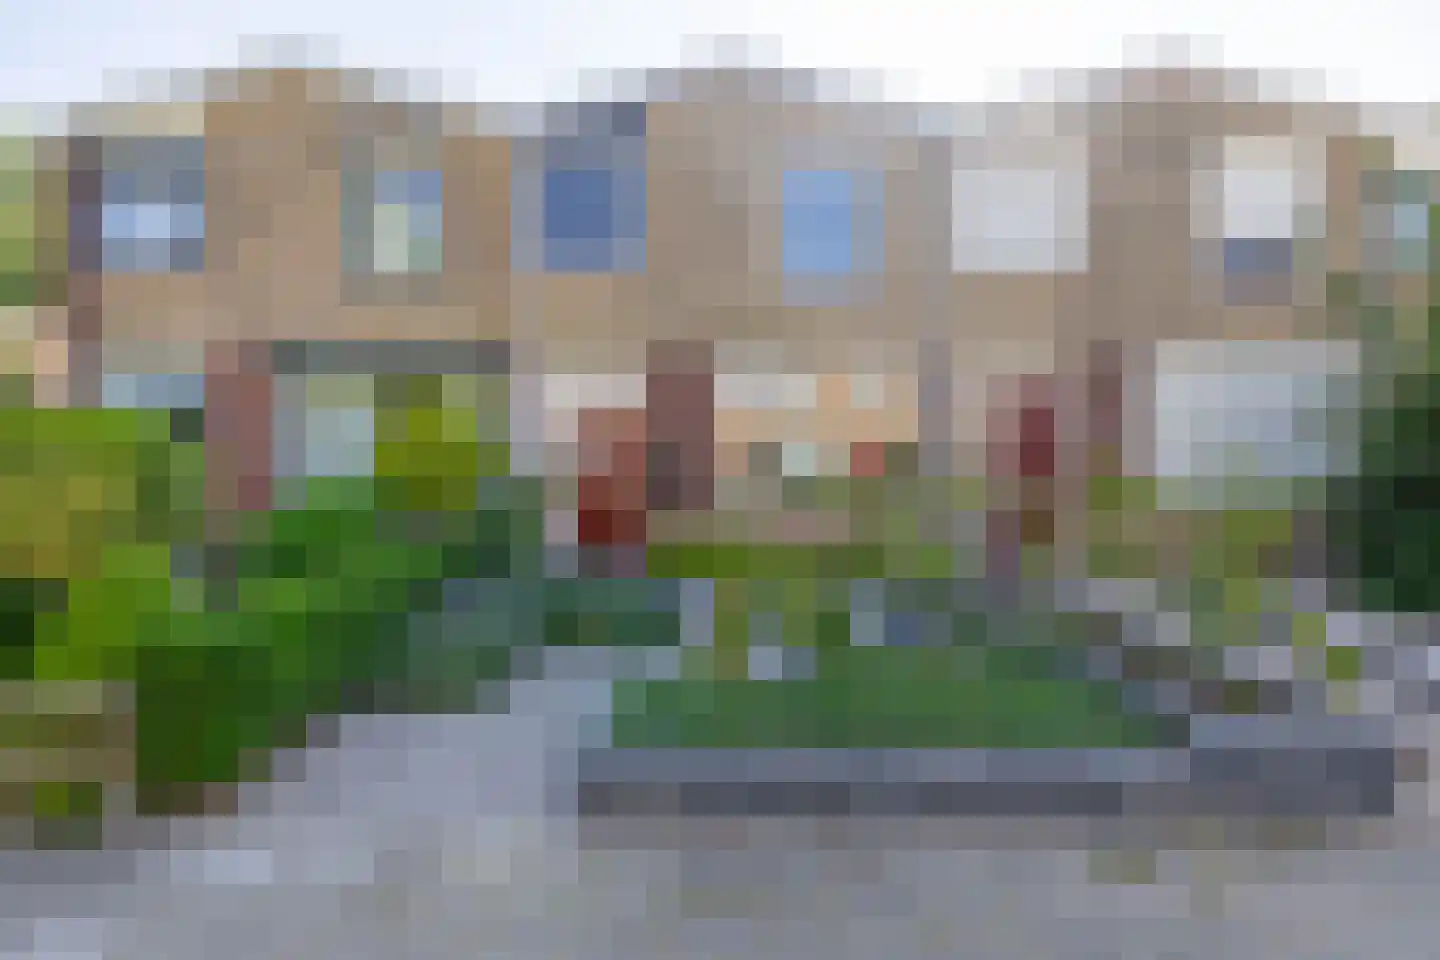
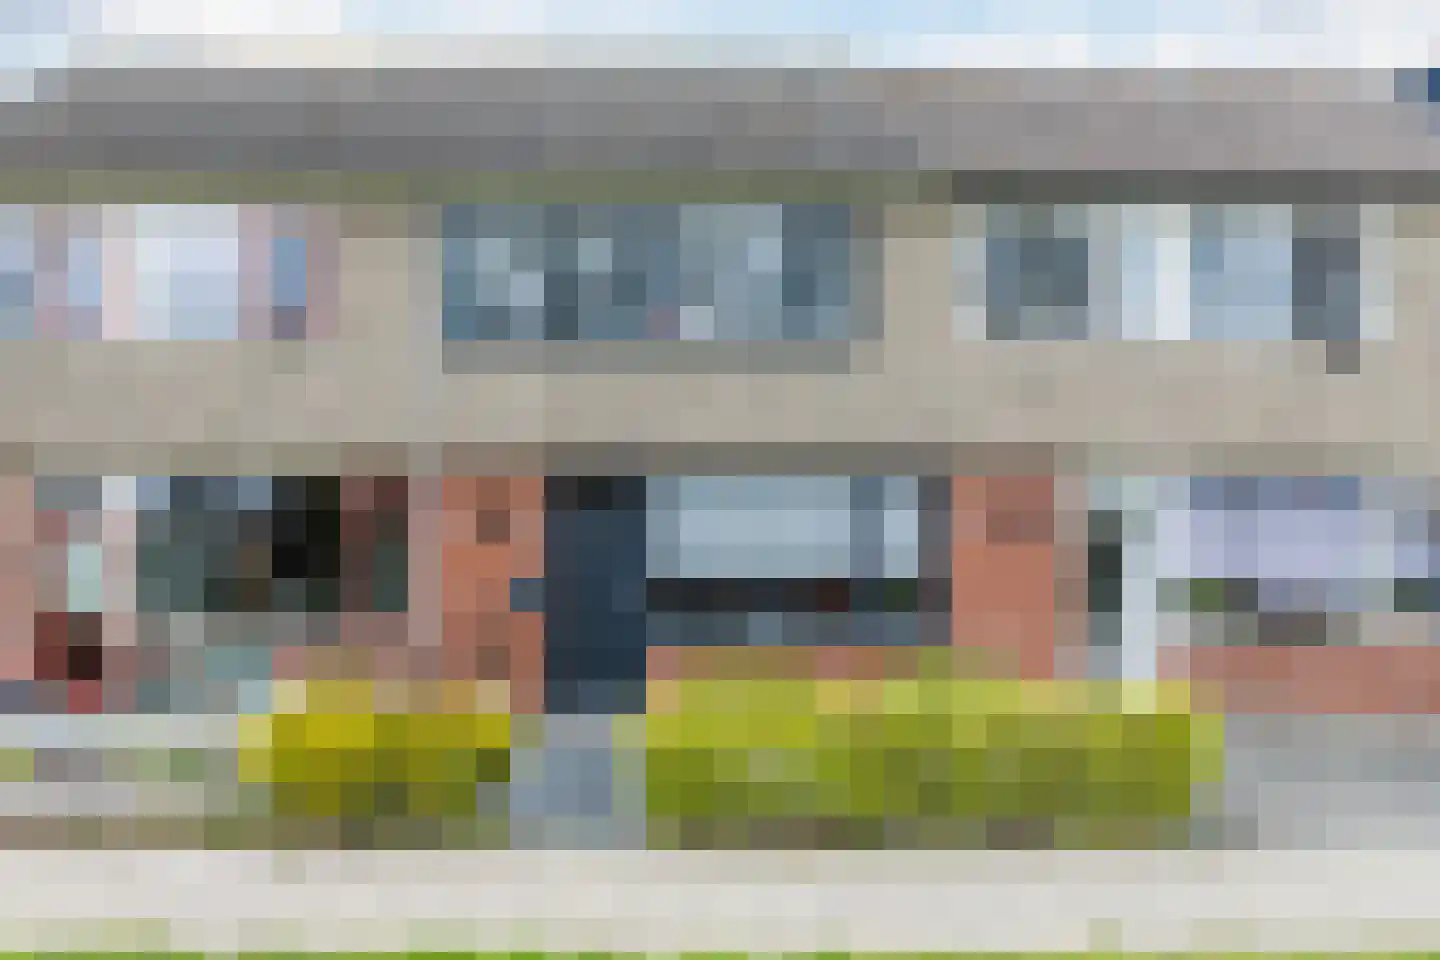
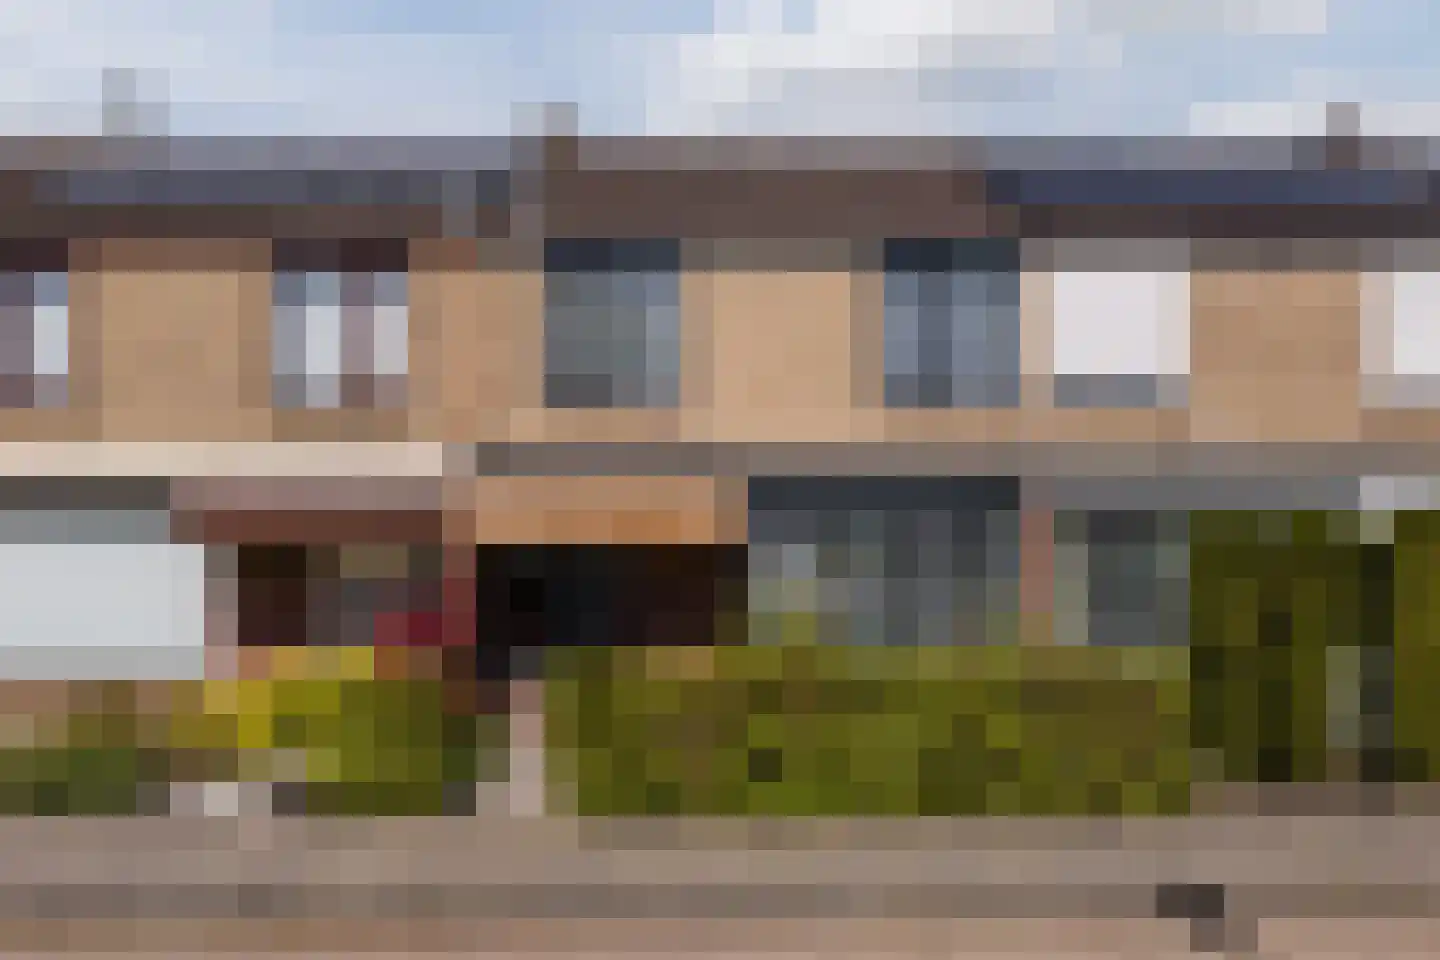
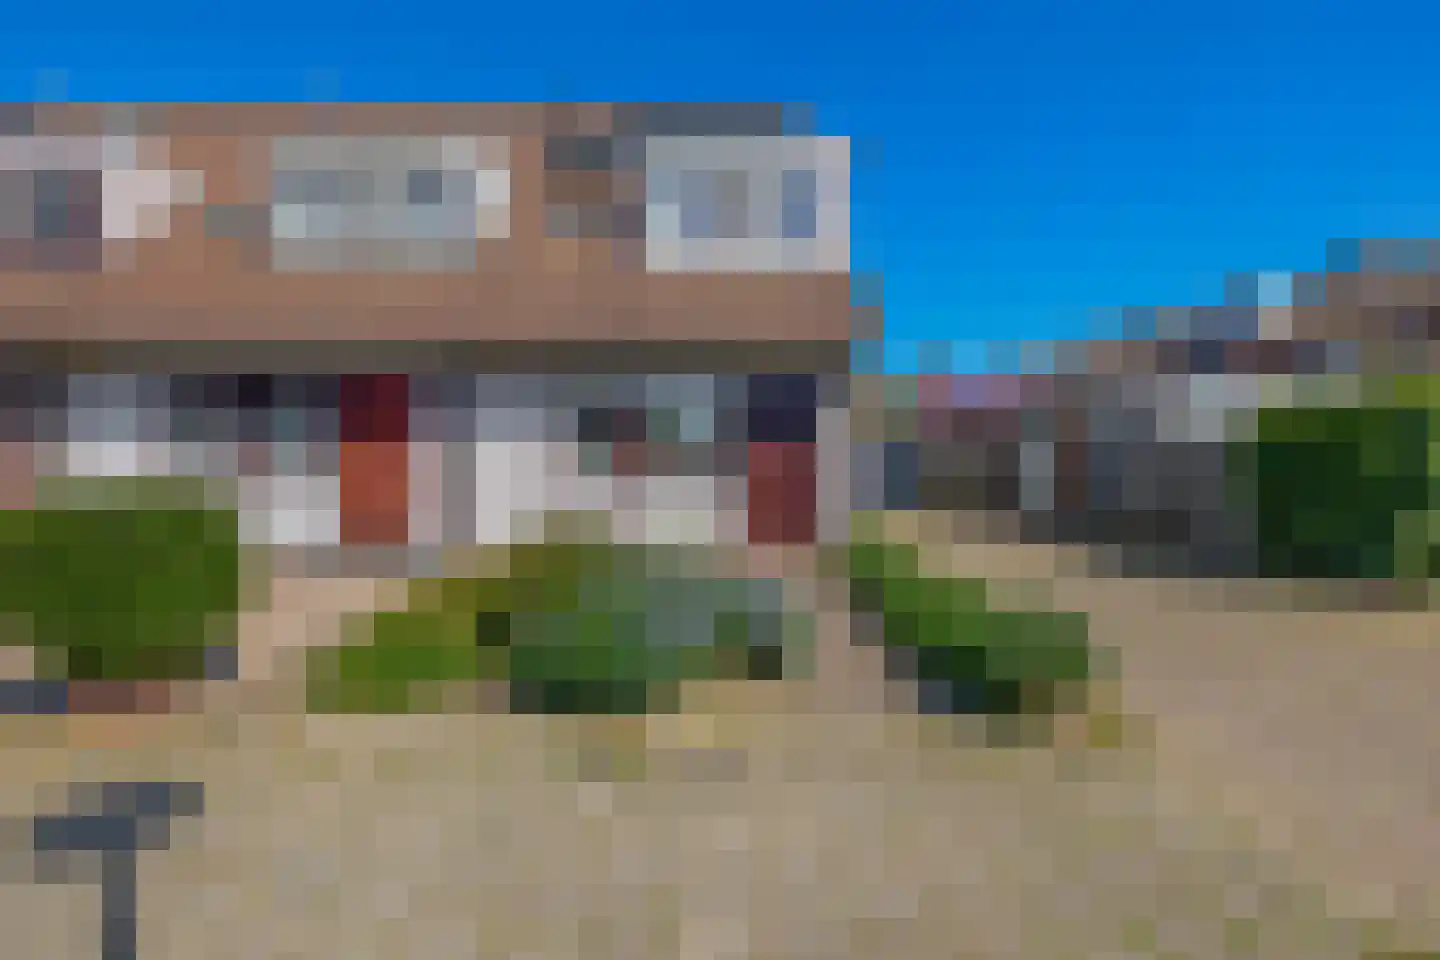
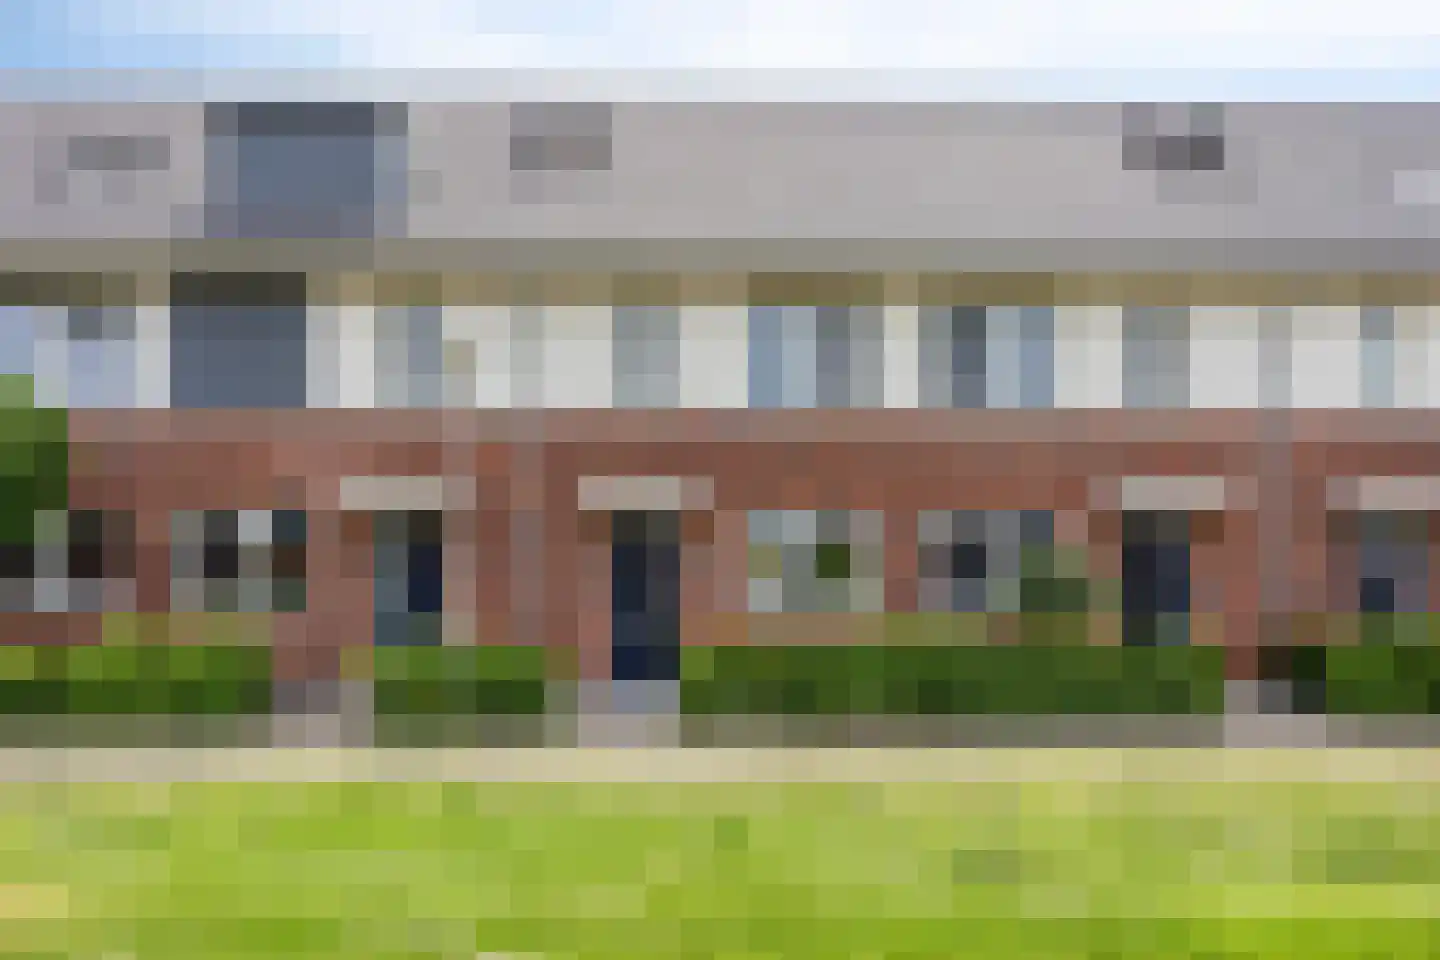
- Available
Kornalijn 11
4762CE Zevenbergen
€ 492.000 k.k.
€ 4.100/m²
- Living area
- 120 m²
- Land area
- 116 m²
- Bedrooms
- 4
Searching in 181 houses in Zevenbergen
Type to search. Use arrow down and arrow up to navigate through results and press Enter to open.
Hidden search suggestions.
View current properties in Zevenbergen or search targeted on street, postal code and property characteristics.
View the current housing stock in Zevenbergen and quickly filter by price, living area, rooms and more. There are currently 181 houses in this place within our selection. View also 130 sold houses in Zevenbergen for extra insight into the local housing market.
4762CE Zevenbergen
€ 492.000 k.k.
€ 4.100/m²
4761ST Zevenbergen
€ 739.000 k.k.
€ 3.732/m²
4761KM Zevenbergen
€ 395.000 k.k.
€ 3.319/m²
4761LD Zevenbergen
€ 343.800 k.k.
€ 3.619/m²
4761DE Zevenbergen
€ 599.800 k.k.
€ 5.404/m²
4761TJ Zevenbergen
€ 450.000 k.k.
€ 3.191/m²
4761HP Zevenbergen
€ 339.000 k.k.
€ 3.000/m²
4761XS Zevenbergen
€ 393.800 k.k.
€ 3.787/m²
4761GV Zevenbergen
€ 600.000 k.k.
€ 3.243/m²
4761PR Zevenbergen
€ 830.000 k.k.
€ 6.148/m²
4761EL Zevenbergen
€ 389.000 k.k.
€ 3.602/m²
4761MP Zevenbergen
€ 339.000 k.k.
€ 2.897/m²
4761LH Zevenbergen
€ 365.000 k.k.
€ 3.925/m²
4761RH Zevenbergen
€ 575.000
€ 4.675/m²
4761RH Zevenbergen
€ 587.300
€ 4.775/m²
4761RH Zevenbergen
€ 575.000
€ 4.675/m²
4761RH Zevenbergen
€ 582.200
€ 4.772/m²
4761RH Zevenbergen
€ 580.000
€ 4.677/m²
4761RH Zevenbergen
€ 533.300
€ 4.558/m²
4761RH Zevenbergen
€ 565.000
€ 4.593/m²
4761PV Zevenbergen
€ 395.000 k.k.
€ 5.000/m²
4762AB Zevenbergen
€ 500 p/m
€ 5/m²
4761DC Zevenbergen
€ 550.000 k.k.
€ 2.434/m²
4761BP Zevenbergen
€ 2.100.000 k.k.
€ 4.086/m²
4761CL Zevenbergen
€ 750.000 k.k.
€ 3.363/m²
4761DD Zevenbergen
€ 649.000 k.k.
€ 3.863/m²
4761GT Zevenbergen
€ 375.000 k.k.
€ 3.348/m²
4761XP Zevenbergen
€ 368.800 k.k.
Get free quotes from real estate agents with local market knowledge. Compare more than 34 real estate agents in Zevenbergen.
Selling a home in Zevenbergen? View the sales-oriented guide sell a house in Zevenbergen, compare all real estate agents in Zevenbergen or view the top 10 real estate agents in Zevenbergen for extra context to your choice.
Real estate agents make sharper offers when they know you're comparing — ask for quotes for sale or purchase.
Practical answers about housing supply, sales and comparing real estate agents in Zevenbergen.
The costs of a real estate agent in Zevenbergen depend on commission, setup costs, property presentation and the chosen service. Compare the 34 real estate agents in Zevenbergen via the real estate agent page and request multiple quotes to compare rates and approach well.
Within our selection, we are currently showing 181 houses in Zevenbergen. View also the sold houses in Zevenbergen to compare the current offering with recent transactions.
Take into account not only price and living area but also maintenance, energy label, location, outdoor space and sales status. This way you compare houses in Zevenbergen on more than just the asking price.
A local real estate agent knows the neighborhoods, recent transactions and demand in Zevenbergen. By comparing 34 real estate agents in the region you get a better insight into prices, sales strategy and expected yield; the top 10 in Zevenbergen provides a useful starting point.
Yes, when making a sales plan, a valuation in Zevenbergen is wise. You gain insight into a realistic asking price and can then compare offers from real estate agents specifically.
View current location data on residents, WOZ development, housing stock, energy consumption, business activity and safety in Zevenbergen. In 2025 were there 15.410 residents. The average WOZ value in 2025 is EUR 368.000.
These figures help to better assess and compare the housing stock in Zevenbergen with recent sold homes. Orient yourself then on suitable top real estate agents in Zevenbergen for sales advice in this region.
Residents
15.410
Last year: 2025
Average WOZ
EUR 368.000
Last year: 2025
Average income per person.
EUR 34.600
Source: AllNumbers
Crimes (current year)
553
Total registered
| Year | Residents |
|---|---|
| 2021 | 14.530 |
| 2022 | 14.540 |
| 2023 | 14.655 |
| 2024 | 15.245 |
| 2025 | 15.410 |
| Year | Average WOZ |
|---|---|
| 2021 | EUR 259.000 |
| 2022 | EUR 279.000 |
| 2023 | EUR 330.000 |
| 2024 | EUR 351.000 |
| 2025 | EUR 368.000 |
Hoger
2.740
Praktisch
3.330
Middelbaar
5.110
Europa
1.350
Nederland
12.380
Buiten Europa
1.680
Label C
2.410
Label A
1.555
Label B
1.274
Label D
701
Label A+++
290
Label F
223
Label G
222
Label E
220
Label A+
132
Label A++
69
Label A++++
22
Label A+++++
4
| Year | Gas (m3) | Electricity (kWh) |
|---|---|---|
| 2020 | 1.140 | 2.910 |
| 2021 | 1.270 | 2.920 |
| 2022 | 990 | 2.730 |
| 2023 | 860 | 2.570 |
| 2024 | 820 | 2.660 |
Hoekwoning
Gas: 940 • Electricity: 2.650
Huurwoning
Gas: 690 • Electricity: 1.920
Koopwoning
Gas: 950 • Electricity: 2.920
Appartement
Gas: 530 • Electricity: 1.730
Tussenwoning
Gas: 820 • Electricity: 2.500
Vrijstaande woning
Gas: 1.330 • Electricity: 3.910
Twee-onder-één-kap woning
Gas: 1.080 • Electricity: 2.960
Total number of company establishments: 1.880
| Period | Crimes |
|---|---|
| jan 2026 | 36 |
| jul 2025 | 60 |
| jun 2025 | 42 |
| mei 2025 | 38 |
| mrt 2025 | 49 |
| mrt 2026 | 48 |
| nov 2024 | 43 |
| nov 2025 | 59 |
| okt 2024 | 39 |
| okt 2025 | 35 |
| sep 2024 | 31 |
| sep 2025 | 44 |
These figures give an indicative picture of safety trends in the living environment of Zevenbergen.
Short answers based on current local statistics, handy for a quick comparison of the living environment.
Zevenbergen telt in 2025 ongeveer 15.410 inwoners.
De gemiddelde WOZ-waarde in Zevenbergen is in 2025 circa € 368.000.
Het gemiddelde inkomen per inwoner in Zevenbergen ligt rond € 34.600 per jaar.
Voor het huidige jaar gaat het om ongeveer 553 geregistreerde misdrijven. Gebruik deze cijfers als indicatie en vergelijk trends per periode.
In Zevenbergen komt vooral "Tussenwoningen" veel voor, met ongeveer 2.901 woningen.