
Een huis kopen of verkopen is een proces dat veel meer inhoudt dan alleen het vinden van de juiste woning. Het betreft een situatie waarin emotie, financiële overwegingen en soms lastige beslissingen een rol spelen. Bij Michiel van Maanen Makelaardij begrijpen we dat en helpen wij u daarbij met professionele begeleiding. Iedere situatie is uniek, net zoals elke woning en cliënt. Daarom leggen wij de nadruk op persoonlijke aandacht en ee...
Current housing stock
-

- Available
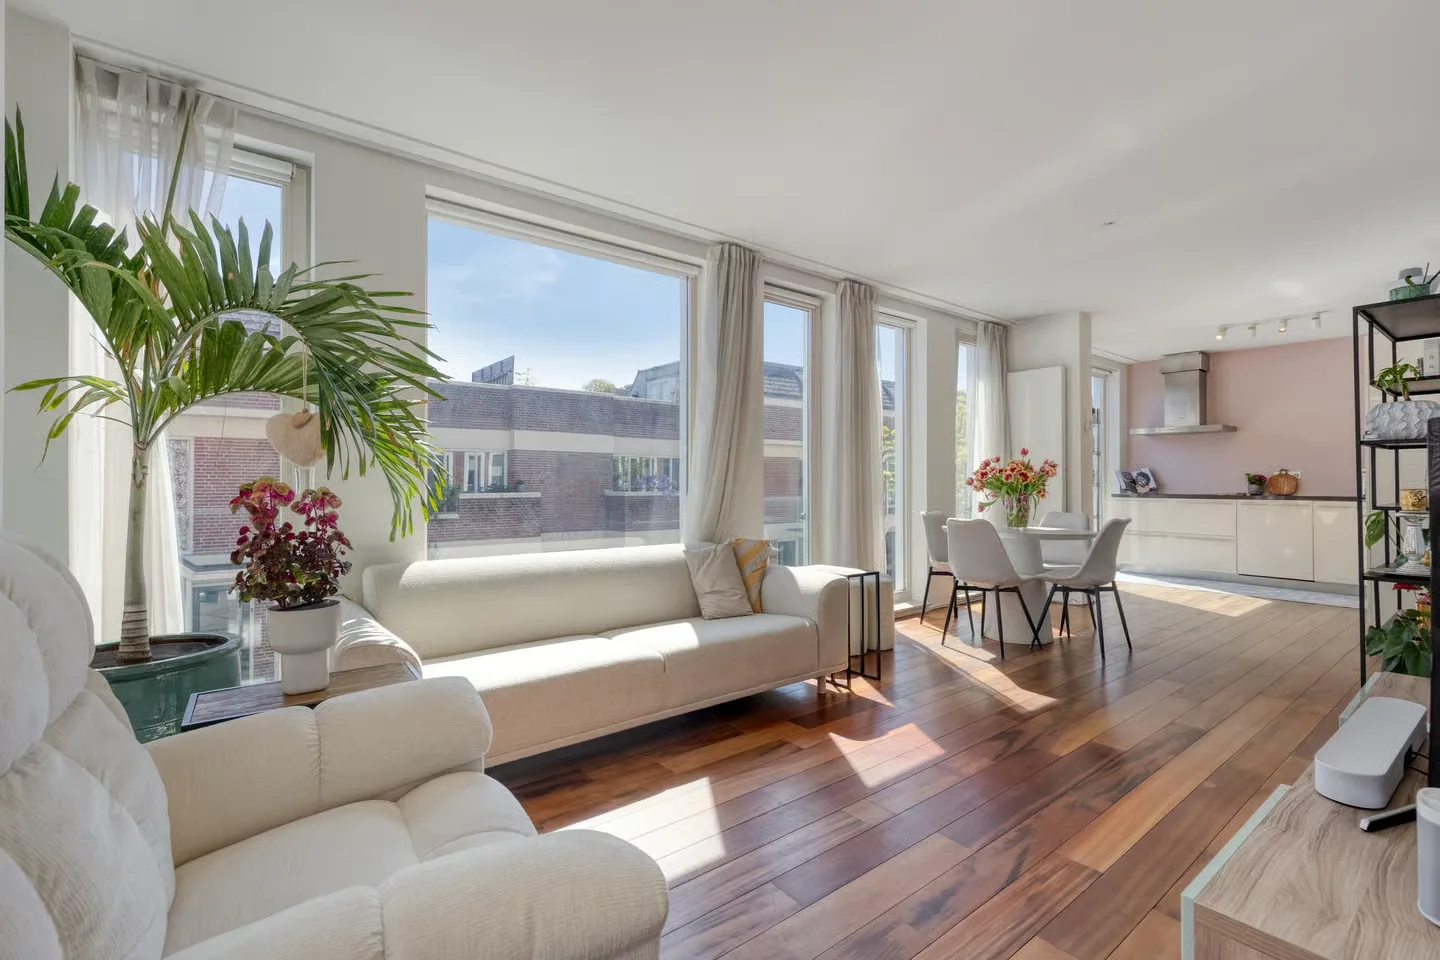
Prinsessekade 4
2012MA Haarlem
€ 1.250.000 k.k.
BSave as favorite- Living area
- 163 m²
- Land area
- 130 m²
- Bedrooms
- 4
-

- Available
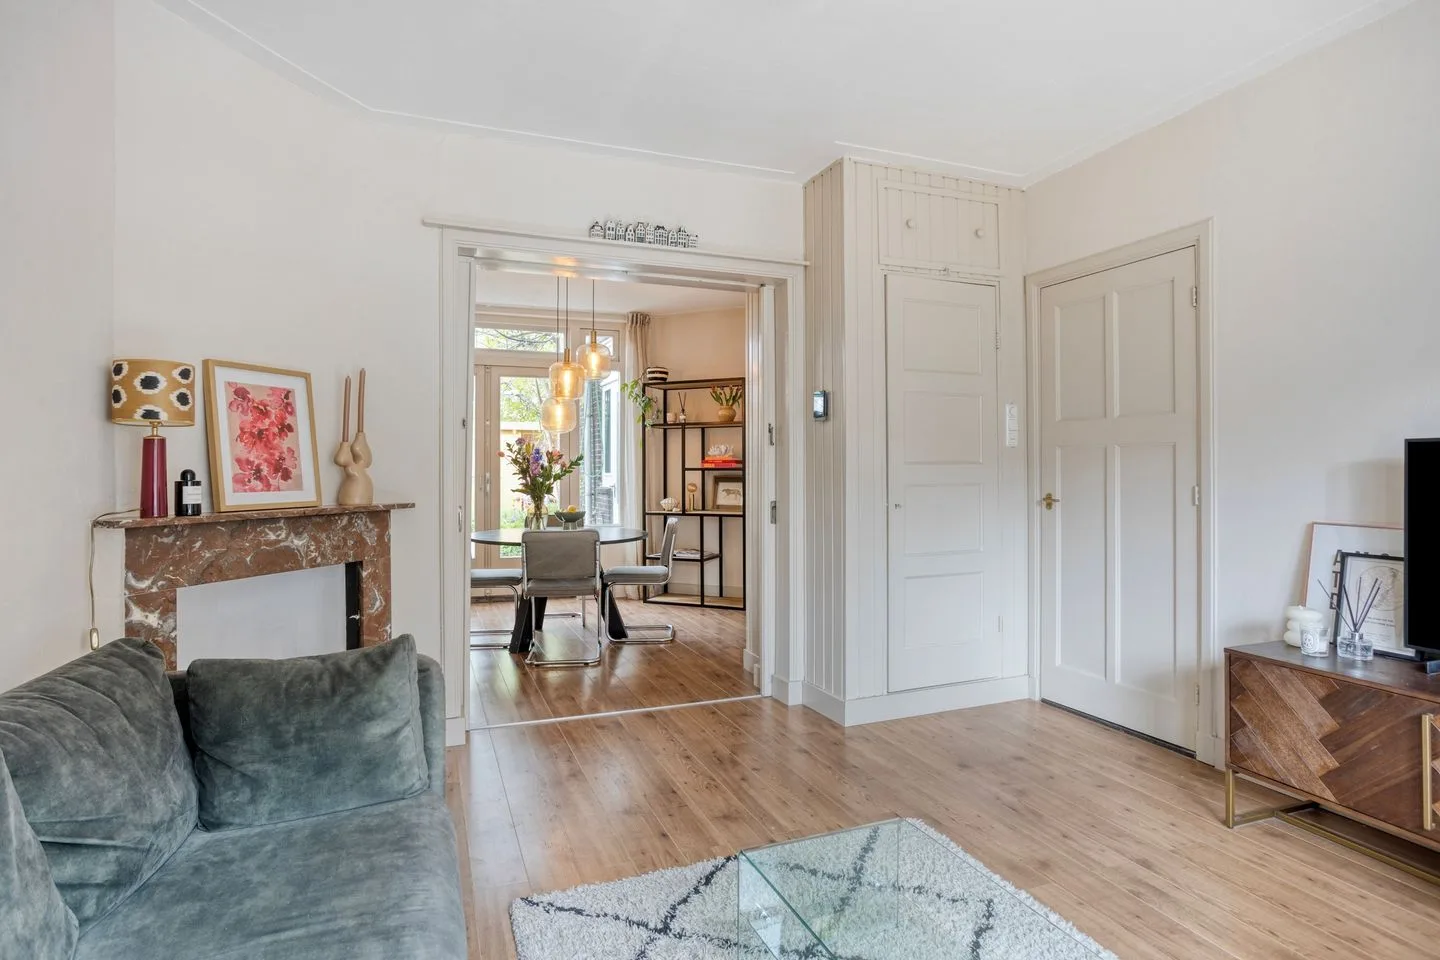
Prinsessenhof 36
2104AR Heemstede
€ 695.000 k.k.
CSave as favorite- Living area
- 121 m²
- Land area
- 196 m²
- Bedrooms
- 3
-

- Available
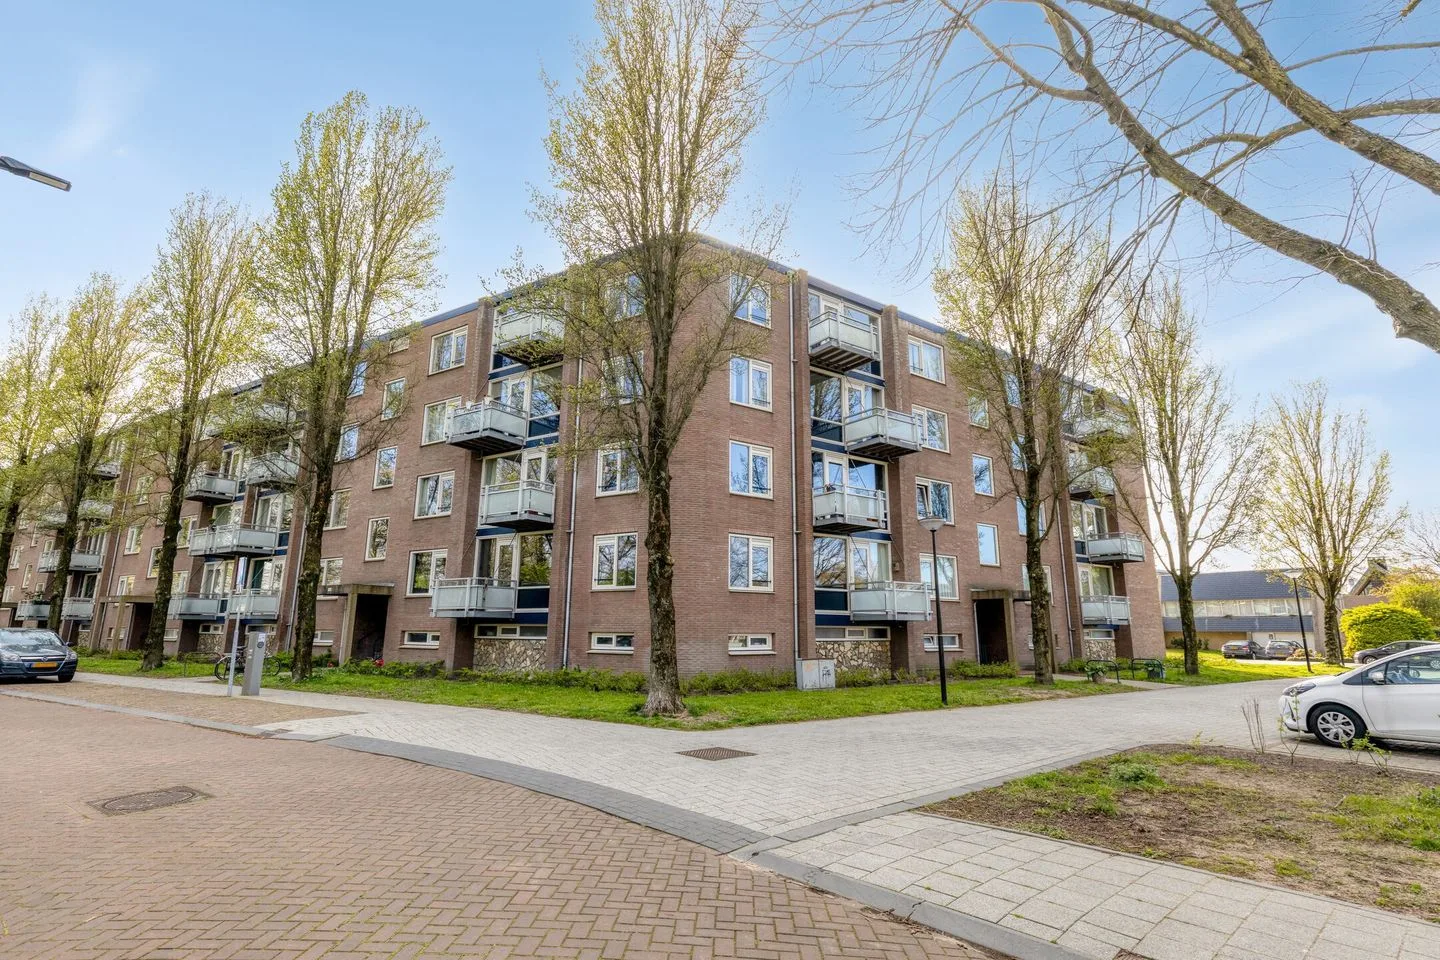
Klinkenbergstraat 163
2136AE Zwaanshoek
€ 515.000 k.k.
CSave as favorite- Living area
- 119 m²
- Land area
- 155 m²
- Bedrooms
- 4
-

- Available
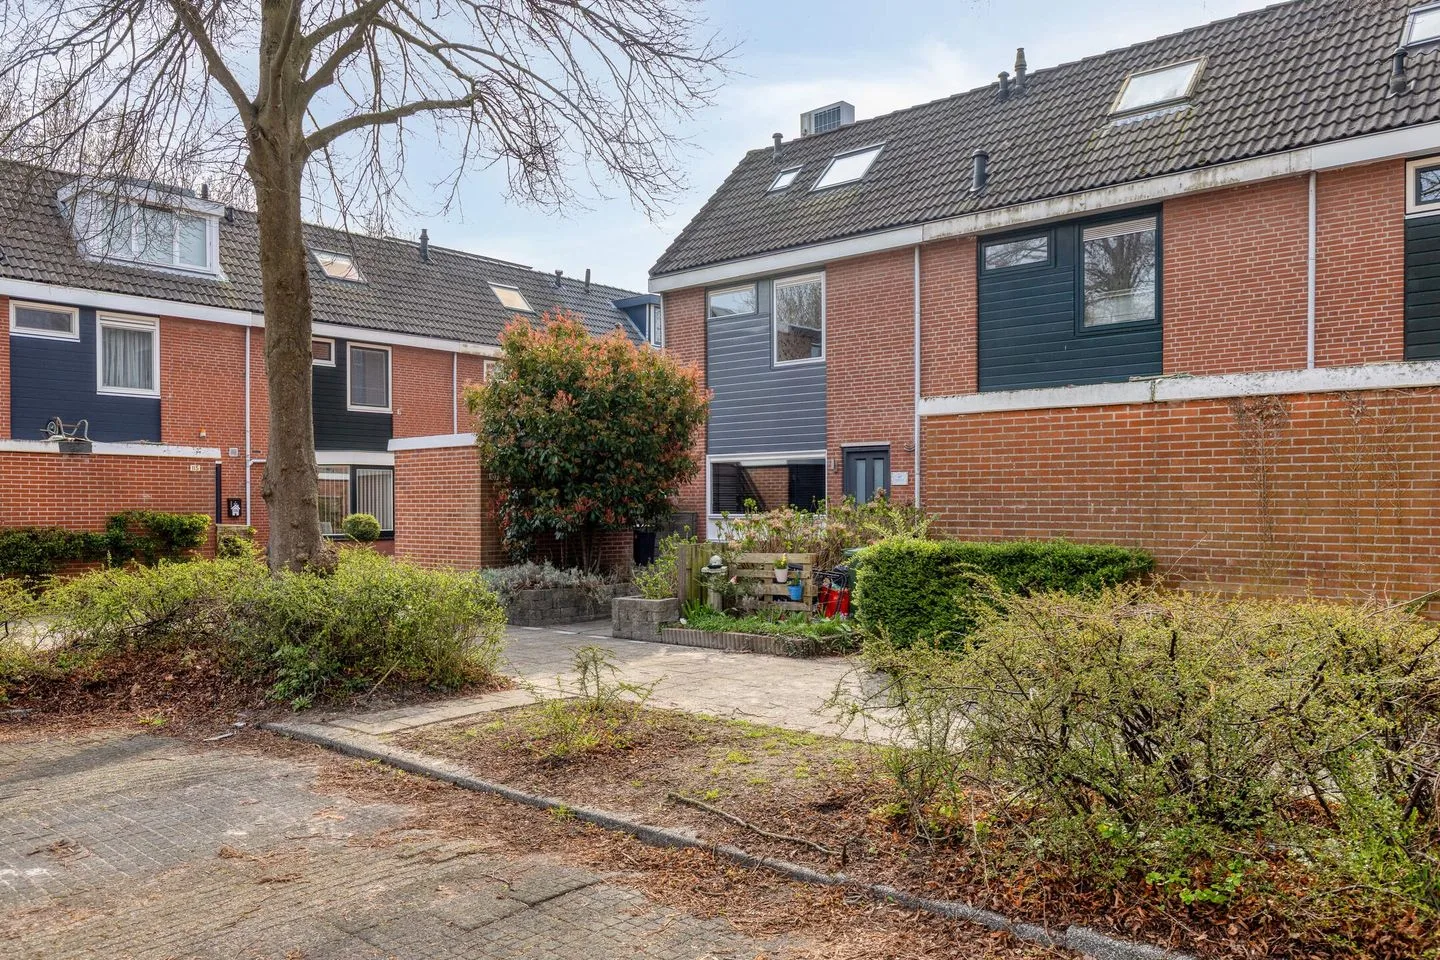
J.C. van Oostzanenlaan 17
2102AW Heemstede
€ 965.000 k.k.
BSave as favorite- Living area
- 170 m²
- Land area
- 167 m²
- Bedrooms
- 6
-

- Available
Voorzorgstraat 15
2013VM Haarlem
€ 950.000 k.k.
ESave as favorite- Living area
- 152 m²
- Land area
- 119 m²
- Bedrooms
- 5
-

- Available
Jacob van Heemskerklaan 8
2121XZ Bennebroek
€ 895.000 k.k.
BSave as favorite- Living area
- 158 m²
- Land area
- 340 m²
- Bedrooms
- 5
Reviews (108)
Review platforms
BronscoresTotal score
108 total reviews

Funda
100 reviews on Funda

8 reviews on Google
-
De Savornin Lohmanlaan 17
10Translated by AIWell supported from start to finish! Michiel van Maanen is both our purchase and sales agent and we are very satisfied.
-
Fazantenlaan 49
10Translated by AIWorking together with Van Maanen means working with a real team. People in the field and at the office contribute to the personal approach, which felt very good... lines are short and communication is excellent. I wholeheartedly recommend this office.
-
Hondsdraflaan 8
10Heel goed en iedereen heel vriendelijk. Je wordt goed op de hoogte gehouden en zijn makkelijk bereikbaar. Kortom een makelaar om aan te raden
-
Burgemeester Hermanslaan 11
10Super prettig geholpen van start tot eind, deskundigheid en extra informatie worden prettig gedeeld en meedenken zit in het bloed van alle medewerkers.
-
Crayenesterlaan 73
9Super betrokken , van begin tot einde een goede uitleg van de te nemen stappen en begeleiding. Wat ik het meeste waardeer is de tijd die ik kreeg om na te denken over een net uitgebracht bod. En de persoonlijke aandacht.
-
Watervliet 63
10Wij zijn ontzettend goed geholpen! Makelaarskantoor Michiel van Maanen kenmerkt zich door toegankelijkheid en een hele warme, persoonlijke benadering. Het dorpse karakter van Bennebroek is terug te vinden in de werkwijze. Gecombineerd met de kennis van zaken, geven wij dit kantoor een dikke 10!
-
Marsmanplein 192
10Translated by AIThe contact was very nice. It was professional and at the same time very personal. Since nowadays everything goes digital and I am not digitally skilled, they also helped me with that. If something didn't go as usual, I was immediately informed and it was resolved. Even on the weekend they are ready for you! A top team!!!
-
Prinsenlaan 75
10Translated by AIThe contact was very pleasant, direct and professional. The real estate agent was highly accessible and reported the status after each visit. I would certainly recommend Michiel in this region.
-
Kortenaerlaan 17
9Translated by AIvery service-oriented and friendly
-
Groot hoefbladlaan 48
10Translated by AIGood guidance and advice. Professional handling. Pleasant team to work with. Definitely recommend it!
-
Rijksstraatweg 68
9Translated by AIWe are very satisfied with the support provided by Michiel van Maanen's team. From the start, we were well informed about the progress of the sale. In particular, the empathy for our situation has done us a lot of good. Professional yet warm. Thanks to this team, and in particular to Renee.
-
Prinsenlaan 36
10Translated by AIThe contact was very pleasant, we were kept well informed about the viewings and their progress. The appointments are clear, also reachable outside office hours, stand ready for you and relieve us which is very pleasant for us. Very nice personal contact.
-
Schoollaan 8
9Translated by AIVery good contact with the real estate agent. All questions were answered directly and I was kept well informed.
-
Meerweg 52
9Translated by AIGood contact, regarding the progress of the sale, advises well and clearly on asking price, offers, and negotiations. Very satisfied with
-
Spaarne 121
10Translated by AIWe have engaged this office for the purchase and sale of our (new) home. In both transactions, we were excellently supported by Michiel van Maanen Real Estate. The contact went very smoothly and they achieved excellent results. Thank you!!
-
Jozef Israëlsweg 14
10Translated by AIExcellent experiences with real estate agents Michiel and René. Very knowledgeable, pleasant contact and thinking along!
-
Leidsevaart 158
10Translated by AIFrom the start a good explanation about how, what and when, always available to ask questions, kept well informed if there was a viewing. Very friendly! With a nice feeling we sold our parental home, which was almost 60 years in our family. All in all a nice cooperation!
-
Zwarteweg 60
8Translated by AII chose this real estate agent because he is familiar with the area and has a good foundation to arrive at the right asking price. A realistic look was taken at the house, the market and the surroundings. Also, there was good/fast switching when it turned out that the interest was very large. Furthermore, very friendly and helpful.
-
Andelhof 2
10We sold our property with Michiel van Maanen Makelaardij and had a great experience. They explained everything clearly, provided valuable advice, and always acted in our best interest. Professional, helpful, and easy to work with — we’d definitely recommend them!
-
Bijweglaan 7
10Translated by AIFrequent contact with the real estate agent who gave us good advice on, for example, styling and structural inspection. Good feedback regarding viewings, both before and after. Pleasant cooperation.