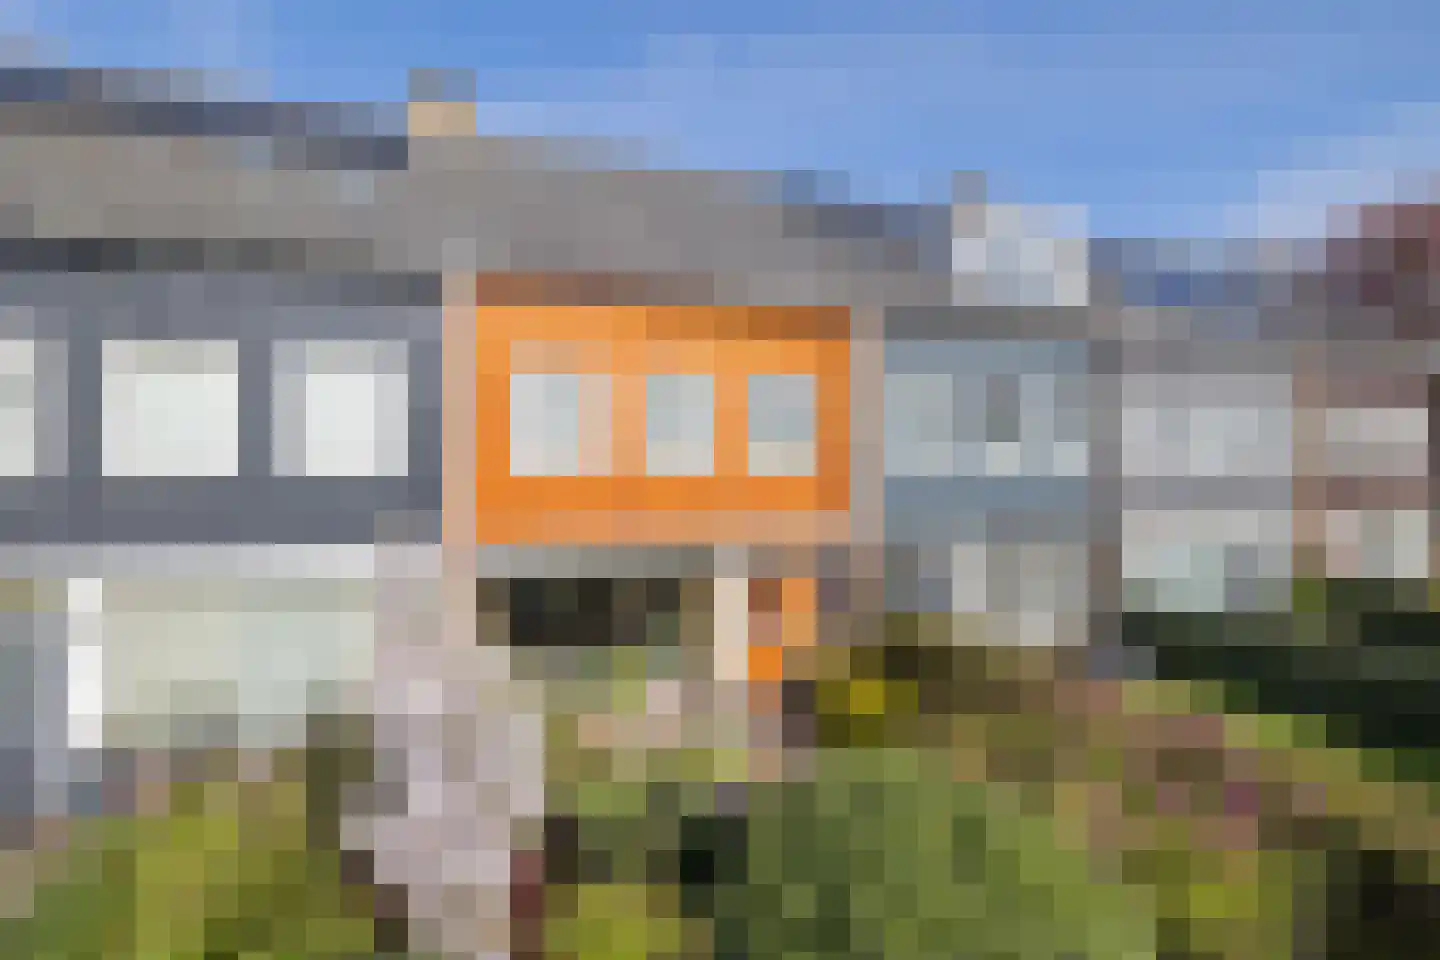
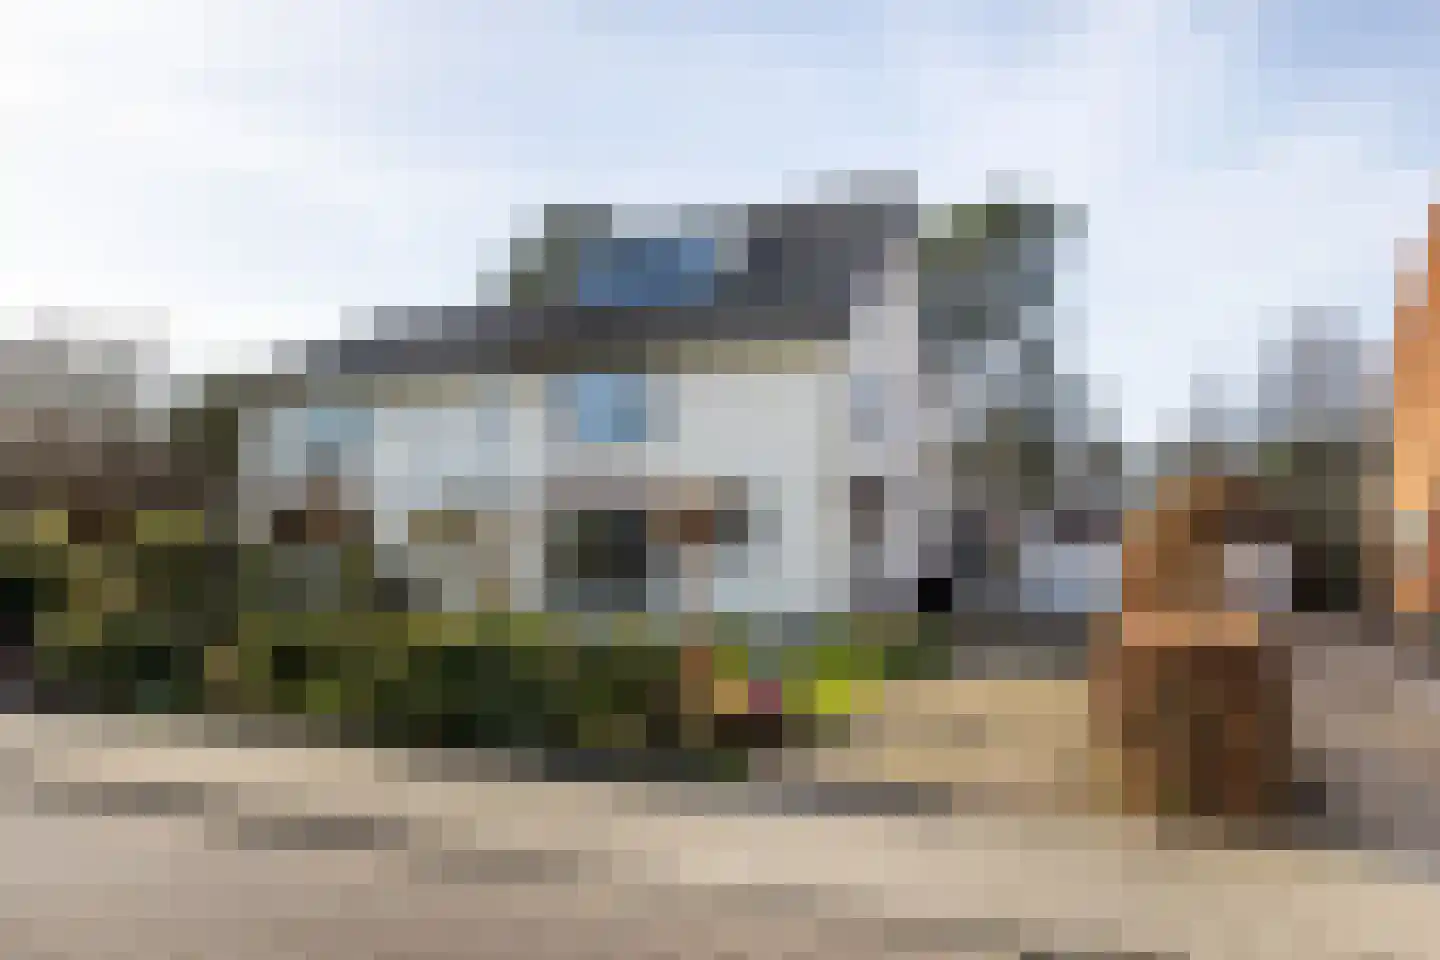
Housing offer in Bennebroek

Searching in 74 houses in Bennebroek

Connected to: Vastgoed Nederland NVM Makelaars

View the current housing stock in Bennebroek and quickly filter by price, living area, rooms and more. There are currently 74 houses in this place within our selection. View also 51 sold houses in Bennebroek for extra insight into the local housing market.

Selection

Search and filter homes

Set your preferences and discover homes that suit you.

Total supply 243.063
Filters

Set price, area and other characteristics. Adjust a filter or click on Show homes. Location changes directly above.

Reset filters

You search for

  • Place Bennebroek

Selling a home in Bennebroek? Compare realtor offers

Get free quotes from real estate agents with local market knowledge. Compare more than 179 real estate agents in Bennebroek.

Free request a quote

  • Quotes in Bennebroek
  • Non-binding
  • Personal
  • Compare free rates

Selling a home in Bennebroek? Compare all real estate agents in Bennebroek or view the top 10 real estate agents in Bennebroek for extra context for your choice.

Compare multiple quotes

Real estate agents make sharper offers when they know you're comparing — ask for quotes for sale or purchase.

Frequently asked questions about homes in Bennebroek

Practical answers about housing supply, sales and comparing real estate agents in Bennebroek.

Residential and neighborhood statistics in Bennebroek

View current location data on residents, WOZ development, housing stock, energy consumption, business activity and safety in Bennebroek. In 2025 were there 5.410 residents. The average WOZ value in 2025 is EUR 580.000.

These figures help to better assess and compare the housing stock in Bennebroek with recent sold homes. Orient yourself then on suitable top real estate agents in Bennebroek for sales advice in this region.

Residents

5.410

Last year: 2025

Average WOZ

EUR 580.000

Last year: 2025

Average income per person.

EUR 42.600

Source: AllNumbers

Crimes (current year)

113

Total registered

Demographics and WOZ development

Inhabitants per year

Inhabitants per year in Bennebroek
Year Residents
2021 5.275
2022 5.255
2023 5.460
2024 5.410
2025 5.410

Annual WOZ value

WOZ value per year in Bennebroek
Year Average WOZ
2021 EUR 475.000
2022 EUR 515.000
2023 EUR 574.000
2024 EUR 560.000
2025 EUR 580.000

Composition of residents

Age build-up

65+: 1.590 0-15: 855 15-25: 485 25-45: 980 45-65: 1.505

Education level

Hoger

1.800

Praktisch

770

Middelbaar

1.120

Origin of residents (2025)

Europa

515

Nederland

4.195

Buiten Europa

705

Housing stock and construction periods

Types of homes

Hoekwoningen 502
Appartementen 697
Tussenwoningen 811
Vrijstaande woningen 244
Twee-onder-één-kap woningen 348

Construction period of buildings

Voor 1700 3
1700 tot 1900 64
1900 tot 1925 73
1925 tot 1950 314
1950 tot 1970 798
1970 tot 1980 462
1980 tot 1990 124
1990 tot 2000 136
2000 tot 2010 120
2010 tot 2020 27
2020 en later 78

Energy and sustainability

Energy label distribution

Label C

573

Label A

383

Label D

320

Label F

289

Label B

265

Label E

257

Label G

188

Label A+

45

Label A++

16

Label A+++

5

Label A++++

0

Label A+++++

0

Average energy consumption per year

Average energy consumption per year in Bennebroek
Year Gas (m3) Electricity (kWh)
2020 1.480 3.010
2021 1.680 3.040
2022 1.300 2.810
2023 1.120 2.640
2024 1.070 2.690

Consumption per house type

Hoekwoning

Gas: 1.180 • Electricity: 2.770

Huurwoning

Gas: 770 • Electricity: 1.760

Koopwoning

Gas: 1.280 • Electricity: 3.040

Appartement

Gas: 780 • Electricity: 1.740

Tussenwoning

Gas: 990 • Electricity: 2.410

Vrijstaande woning

Gas: 1.900 • Electricity: 4.370

Twee-onder-één-kap woning

Gas: 1.460 • Electricity: 3.560

Business activity in Bennebroek (2025)

Handel en HORECA 90
Nijverheid en energie 60
Zakelijke dienstverlening 280
Overheid, onderwijs en zorg 130
Landbouw, bosbouw en visserij 0
Vervoer, informatie en communicatie 50
Financiele diensten en onroerendgoed 55
Cultuur, recreatie en overige diensten 70

Total number of company establishments: 745

Recent crime statistics

Recent crime statistics in Bennebroek
Period Crimes
jan 2025 7
jan 2026 5
jul 2025 8
jun 2025 13
mei 2025 15
mrt 2025 8
nov 2024 7
nov 2025 9
okt 2024 16
okt 2025 11
sep 2024 19
sep 2025 12

These figures give an indicative picture of safety trends in the living environment of Bennebroek.

Frequently asked questions about living in Bennebroek

Short answers based on current local statistics, handy for a quick comparison of the living environment.

Hoeveel inwoners heeft Bennebroek?

Bennebroek telt in 2025 ongeveer 5.410 inwoners.

Wat is de gemiddelde WOZ-waarde in Bennebroek?

De gemiddelde WOZ-waarde in Bennebroek is in 2025 circa € 580.000.

Wat is het gemiddelde inkomen per inwoner in Bennebroek?

Het gemiddelde inkomen per inwoner in Bennebroek ligt rond € 42.600 per jaar.

Hoe veilig is wonen in Bennebroek?

Voor het huidige jaar gaat het om ongeveer 113 geregistreerde misdrijven. Gebruik deze cijfers als indicatie en vergelijk trends per periode.

Welke woningtypen komen het meest voor in Bennebroek?

In Bennebroek komt vooral "Tussenwoningen" veel voor, met ongeveer 811 woningen.

Receive free, non-binding quotes

Compare multiple real estate agents and choose the best match.