Mijn kantoor staat voor een unieke uitstraling die de nadruk legt op kwaliteit. Elke detail is gekozen met zorg, zodat de sfeer direct aanspreekt. De keuze voor goud als huisstijlkeur benadrukt mijn focus op waardigheid en uitstekende kwaliteit. Binnen de ruimte ligt de nadruk op een stijlvolle, elegante omgeving die past bij mijn visie. De kleurkeuze en de uitstraling zijn zorgvuldig gecombineerd om een unieke sfeer te creëren. Ik ben...
Current housing stock
-

- Available
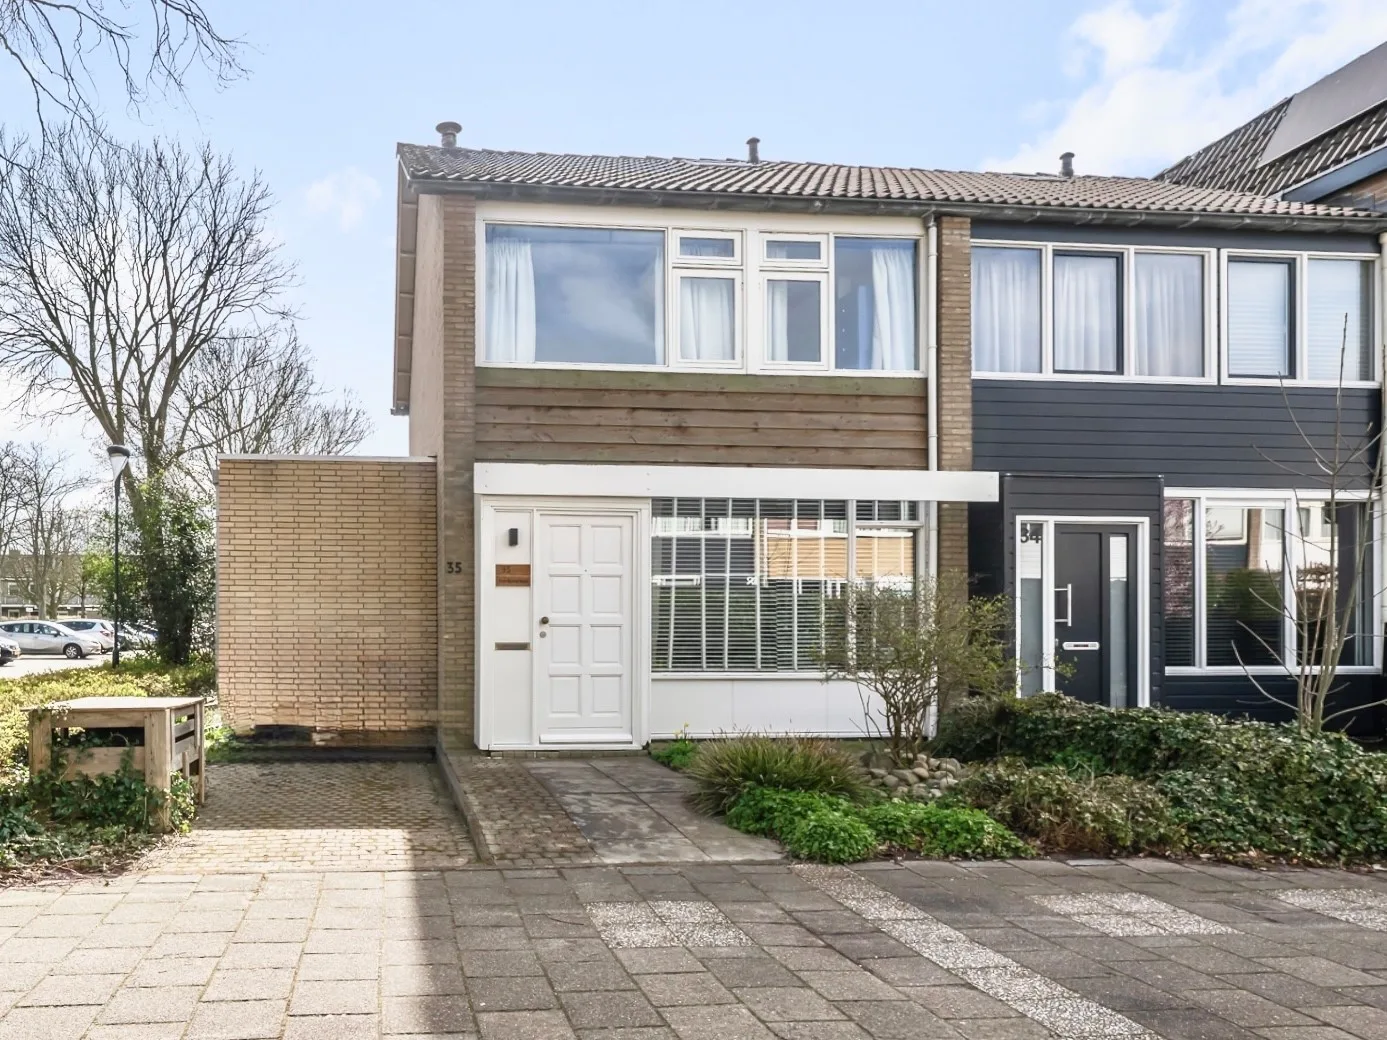
Koolzaad 39
1747EW Tuitjenhorn
€ 569.000 k.k.
A+++Save as favorite- Living area
- 125 m²
- Land area
- 173 m²
- Bedrooms
- 2
-

- Available
Koningstraat 30
1941BD Beverwijk
€ 250.000 k.k.
DSave as favorite- Living area
- 53 m²
- Land area
- —
- Bedrooms
- 1
-
- Available
Grote Belt 16
2133GA Hoofddorp
€ 500.000 k.k.
€ 4.854/m²
BSave as favorite- Living area
- 103 m²
- Land area
- 115 m²
- Bedrooms
- 3
-

- Available
Rossinistraat 440
1962PD Heemskerk
€ 495.000 k.k.
€ 4.670/m²
BSave as favorite- Living area
- 106 m²
- Land area
- 205 m²
- Bedrooms
- 2
-

- Under consideration
Trijntje Kemp-Haanstraat 34
1941HC Beverwijk
€ 350.000 k.k.
€ 3.333/m²
CSave as favorite- Living area
- 105 m²
- Land area
- —
- Bedrooms
- 3
-

- Purchased
van der Ploegstraat 9
1964SK Heemskerk
€ 298.000 k.k.
€ 4.138/m²
CSave as favorite- Living area
- 72 m²
- Land area
- —
- Bedrooms
- 3
Reviews (152)
Review platforms
BronscoresTotal score
152 total reviews

Funda
43 reviews on Funda

109 reviews on Google
-
Hevel 5
9Wat een fijne ervaring met Zoë! De begeleiding bij de verkoop van ons huis was top: duidelijk, professioneel en altijd bereikbaar voor vragen. Dankzij haar enthousiasme en inzet verliep alles heel soepel. We raden haar zeker aan!
-
Zeestraat 166
10Geweldige makelaar. Nog nooit iemand gehad die zo snel werk leverde! Van begin tot het eind leuk, makkelijk contact en zeer professioneel. We hadden veel vragen en bij bepaalde punten hulp nodig maar dit was voor Zoë allemaal geen probleem! Wij hebben nu onze droomwoning, bedankt!!
-
van der Ploegstraat 9
9Zoë staat altijd klaar om met je mee te denken. Er word een persoonlijke aanpak gehanteerd, wat maakt dat je gezien word als persoon. Snelle en duidelijke communicatie.
-
Bianca Nijman
10Translated by AIGreat real estate agent who explained everything well, had a sharp price and kept us informed throughout the entire process. Furthermore, very nice ladies in the office who also kept us informed of all developments.
-
Koningstraat 77 F
105 sterren – Echt een aanrader! Zoë heeft mij ontzettend goed geholpen bij het kopen van mijn huis. Geen gladde praatjes of standaardmakelaarsgedoe – gewoon eerlijk en recht voor z’n raap. Ze snapt precies waar je mee zit en denkt echt met je mee. Geen onzin, gewoon goed advies en duidelijke uitleg. Ik voelde me meteen op mijn gemak en wist: dit gaat goed komen. Ze is niet alleen slim, maar ook echt betrokken. Vragen? Ze had altijd tijd. Onderhandelingen? Ze regelde het. Kortom: …
-
Jordy Geel
10Translated by AIIn December my apartment was sold by van Gulik. Perfect service from real estate agent Jan. Clear guidance and sold for a nice price! Definitely a recommendation and open to repeat. Thick 5 stars.
-
Hien Nguyen
10Translated by AIWe would like to thank Jan sincerely for his great help. Always friendly, very involved, clear explanations and always available. Thank you very much for everything!
-
Gladiolenlaan 12
10Wij zijn erg blij met Zoë! Ze is enorm deskundig, kent de markt door en door en wist ons steeds van helder en eerlijk advies te voorzien. Daarnaast communiceert ze snel en op een heel fijne manier. We voelden ons gehoord en goed begeleid. Wij kunnen Uniek Makelaardij van harte aanbevelen!
-
Fidelishof 15
10Zoë is een hele fijne aankoop (en verkoop) makelaar. Professioneel, vlot en heel erg fijn en snel in de communicatie. Ze heeft heel veel kennis en zal altijd haar eerlijke mening geven, ook als dat niet is wat je wil horen, maar dan heb je wel het beste advies!! Zoë heeft me geweldig geholpen met zowel de bezichtigingen (gaat altijd mee als het kan), als de onderhandelingen. Met een hele goede aankoop als resultaat!
-
Iepenlaan 16
10Zoe is een professionele en vlotte makelaar. Ze heeft mij binnen één keer aan een huis geholpen en gaf daarbij goed en eerlijk advies. Ze kijkt actief mee, denkt mee in het proces en communiceert duidelijk en prettig. Ik heb de samenwerking als zeer positief ervaren.
-
Arnout Jansen
10 -
Julia Metselaar
10 -
Peter Dietz
10Translated by AII sold my home through Bakker Makelaardij and am very satisfied with it. Everything is taken care of by Wim and Lars. They know how it works...
-
Liese Vlas
10Translated by AIA really fine real estate agent who helped us sell our house in an incredibly smooth, professional and nice way! Definitely a recommendation!
-
Koningstraat 5 A
10Translated by AIWe have been super helped from start to finish and this real estate agent has been very transparent about everything! Very nice and a real recommendation. Also, our apartment was sold for a nice price, we are very satisfied.
-
Lange Nieuwstraat 431
10Translated by AIContact with Zoë was very nice and low-threshold! She has advised me very well and supported me. I am very happy with the house that I bought with her help!
-
Begijnenweide 3
10Translated by AII am very satisfied with the way Zoë from Uniek Makelaardij sold our home. Zoë has a lot of knowledge, communicates very nicely, listens to your wishes and thinks and helps along in a very nice way. I would recommend everyone to ask Zoë as a sales (and purchase) real estate agent. We have not come back to her for nothing, after the sale and purchase of our previous homes, and again very happy with how everything went.
-
Cynthia Pieket Weeserik
10Translated by AIIf you are looking for a very experienced real estate agent who knows the market well and communicates finely, call Mirjam and her team!!
-
Lisa
2Translated by AIMy friend and I went on our first ever viewing. You would think a nice experience, but that turned out to be the case. From the moment we walked in, we immediately got the comment: “First viewing for sure?” Subsequently, we were given a tour of at most three minutes, in which it became clear that we were not taken seriously. Nevertheless, we made an offer. After the bidding had closed, we were called that our bid was not accepted, because we “veeeer overbid”, in a way that came across as quite condescending. Fortunately, we are now the happy owners of a nice house through another real estate agent, where we had an excellent experience. Based on our experience, I can absolutely not recommend Van Gulik Makelaars. Should we ever need to move again, we will certainly not use them for viewings again.
-
Lagedijk 4 B
10Translated by AIZoé from Uniek Makelaardij has exceptionally well guided me in selling my apartment, I also find her very pleasant to deal with. Very satisfied with this real estate agent.