
Huizenbalie.nl
In Tilburg staat Huizenbalie.nl voor betrouwbare en persoonlijke makelaarsdienst. Wij helpen u zorgvuldig en met inzicht, zodat u zich kunt richten op wat werkelijk belangrijk is: de juiste woning of huurder. Onze ervaring en toewijding zorgen voor een rustige en transparante zoek- of verkoopproces. Wij bieden een breed aanbod op maat, van koop- tot huurwoningen en ondersteunen u met professionele adviezen. Onze werkwijze is gericht op...
Current housing stock
-
- Available
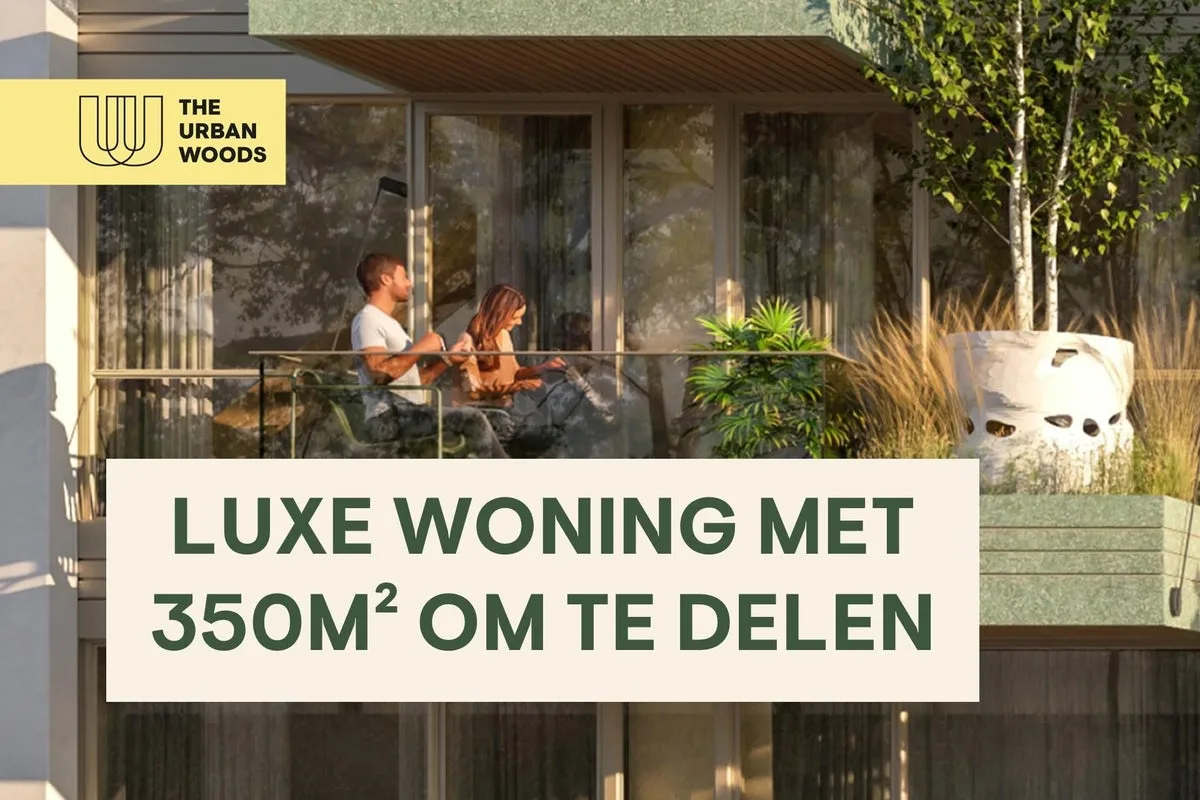
Tweemolentjeskade 75
2612XZ Delft
€ 1.320 p/m
€ 33/m²
A+++++Save as favorite- Living area
- 43 m²
- Land area
- —
- Bedrooms
- 1
-

- Available
Tweemolentjeskade 75
2612XZ Delft
€ 1.310 p/m
€ 34/m²
A+++++Save as favorite- Living area
- 42 m²
- Land area
- —
- Bedrooms
- 1
-

- Available
Tweemolentjeskade 75
2612XZ Delft
€ 1.296 p/m
€ 36/m²
A+++++Save as favorite- Living area
- 39 m²
- Land area
- —
- Bedrooms
- 1
-
- Available
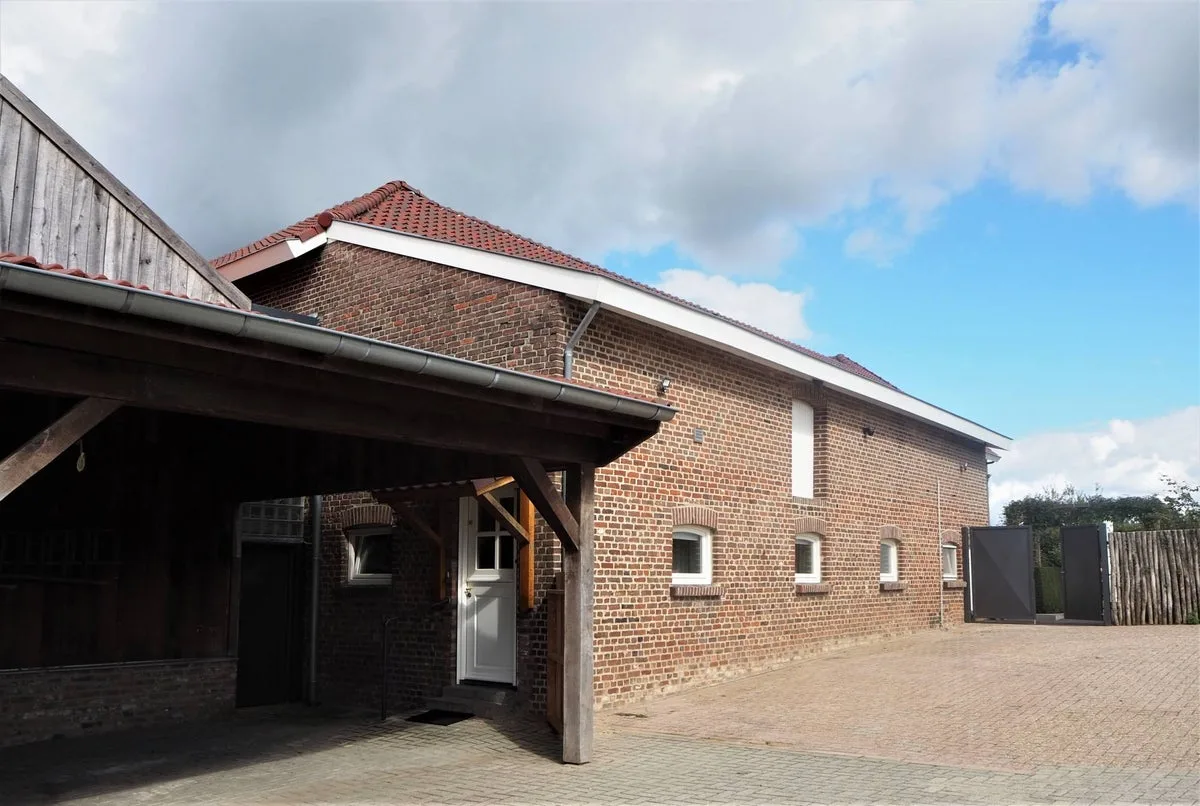
Moerslag 32
6265NC Sint Geertruid
€ 1.275 p/m
€ 18/m²
ASave as favorite- Living area
- 100 m²
- Land area
- —
- Bedrooms
- 2
-

- Available
Graaf Florisstraat 10 H
1091TG Amsterdam
€ 1.800 p/m
€ 45/m²
CSave as favorite- Living area
- 41 m²
- Land area
- —
- Bedrooms
- 1
-

- Available
Tamariskhof 5
1087SH Amsterdam
€ 2.150.000 k.k.
€ 8.740/m²
A+Save as favorite- Living area
- 246 m²
- Land area
- 389 m²
- Bedrooms
- 5
Reviews (26)
Review platforms
BronscoresTotal score
26 total reviews

26 reviews on Google
-
Justin Case
10Translated by AIVery good, fast and pleasant service as also our previous experience was. A real recommendation!
-
Ron Schuurman
10Translated by AIWe used the services of huizenbalie. Where in times of reduction, friendliness and helpfulness seems to be increasing everywhere, the organization 'de Huizenbalie' is a major exception to that. What fantastic customer focus and service. Quick adequate help and information, also the director is extremely friendly and problem-solving. We can really wholeheartedly recommend this organization.
-
Patryk Kawa
2Translated by AIIt is money waste.
-
Herwijnen
10Translated by AII wholeheartedly recommend this company. We advertised our apartment via Huizenbalie, after which it was listed on Funda and various other platforms. The communication was excellent. The apartment was rented out immediately. We also tried it ourselves via other platforms, but that was honestly a waste of time. We will certainly use their services again.
-
Mohammed Al Rubaiy
2Translated by AIWarning! Extremely bad company! - Do you call the central number for interest in a property? You are referred to an email address and the connection is disconnected. Telephone consultation is impossible. - Do you call the number of one of their branches (in my case Groningen)? You get a message that the phone number is not in service. - Once responded via email to a property? You initially receive an automatic 'Postmaster' email as if the email address is undeliverable. Then you get a person whose first and last name are listed in the note of the email. - In a rental process, you can have many questions as a candidate. These will not be answered. Not even by email. The contact person only wants you to respond to his/her questions and not the other way around. - Finally: the viewing itself. You get a nice property to view. Good housing stock. Only the process: no hand is shaken, there is no interest in getting to know you, you are questioned about why you want to move (even though you have already mentioned this via email) and what you earn. You can give answers, but because listening is selective, what you actually say is not processed. - Ask for a video viewing. This prevents you from having to drive a long way only to hear during the viewing that there are 10 other candidates and you shouldn't get your hopes up... - The worst thing of all: the attitude. Mrs. Geraldien Miedema couldn't resist saying that they 'granted' the property to someone else. It might also be 'rented' to someone else, Mrs. Miedema. In short: 1 star for the property itself. No stars for the service.
-
J P
2Translated by AIThe Huizenbalie is a bad party for potential renters. You are connected to an automated message. They ask if you send an email. Then you hear nothing more. The telephone service also tries to fob you off with an email. Very poorly organized!
-
Penny De Villiers
10Geweldige service! Altijd behulpzaam. Ze komen hun beloftes na! Een echte aanrader!!
-
Jan Ruben Sigger
10Translated by AIThe absolute best way to rent out your house via Funda/Pararius. My house was posted within 1 day, +150 responses within 24h. Handling it myself, but this saves me 1000+ Euro , especially compared to (expat) real estate agencies, which ask for 1 month's rent for this (?!). Contact person very friendly on the phone. Conclusion: the future of property rental in a company
-
Mark vanderweide
10Translated by AIJust SUPER in one word; FAST ADVICE AND PERSONAL!
-
simone kucki
2Translated by AIVery bad service, this morning my friend had an appointment for a viewing in Den Helder. He had to come from Hellevoetsluis, so he drove almost 2 hours. Upon arrival at the agreed time, no one was present. Repeatedly tried to call, only an answering machine that addresses you, now I understand why there is no voicemail. Ultimately, no one showed up and it cost him a lot of time and expensive fuel. Very customer unfriendly!!!!
-
Rakhal Heijtel
10Translated by AIVery good service. Always reachable, flexible and think along where needed. Success!
-
Bert Kamps
10Translated by AII rented out my apartment through huizenbalie. I was well helped and my questions were answered very quickly. I also received the requests for viewings directly via my email. Can really recommend huizenbalie if you want to rent out your home yourself. Update: A little over a year later, I placed another advertisement through huizenbalie. Now interested parties have to fill in a questionnaire with a motivation beforehand, which results in more serious reactions. Again, many responses in a short time. Huib is handling it well again just like last time.
-
Conno van Wijk
10Translated by AIGood agency to put a house for rent. No-nonsense, affordable and competent. They respond super quickly to questions and provide good advice. If you want to save yourself time and effort when renting out a property, I can wholeheartedly recommend Huizenbalie.
-
Sebastiaan
2Translated by AISuper bad company. You can't reach them by phone and if you do, you get someone on the line who is super arrogant and speaks to you rudely. This while the property I was calling about costs 2750 euros per month. Apparently, it’s too much to ask to call with a few questions about this.
-
Rob Braun
10Translated by AITop service! The personal contact makes working very pleasant!
-
Joël van Delden
10Translated by AIHuizenbalie is a pleasant partner to work with. The contact runs smoothly and pleasantly. In addition, appointments are kept. A partner you can build on, therefore!
-
Giulio H
10 -
Yoran Hensel
10 -
A. S
10Translated by AIReally a great company. My first experience and already very good. Fast, accurate, thinking along. I will definitely do more business with them here. Thanks Huib. Kind regards, Afra
-
Emile Bastings
8Translated by AIfast service!