REMAX Uw Makelaar
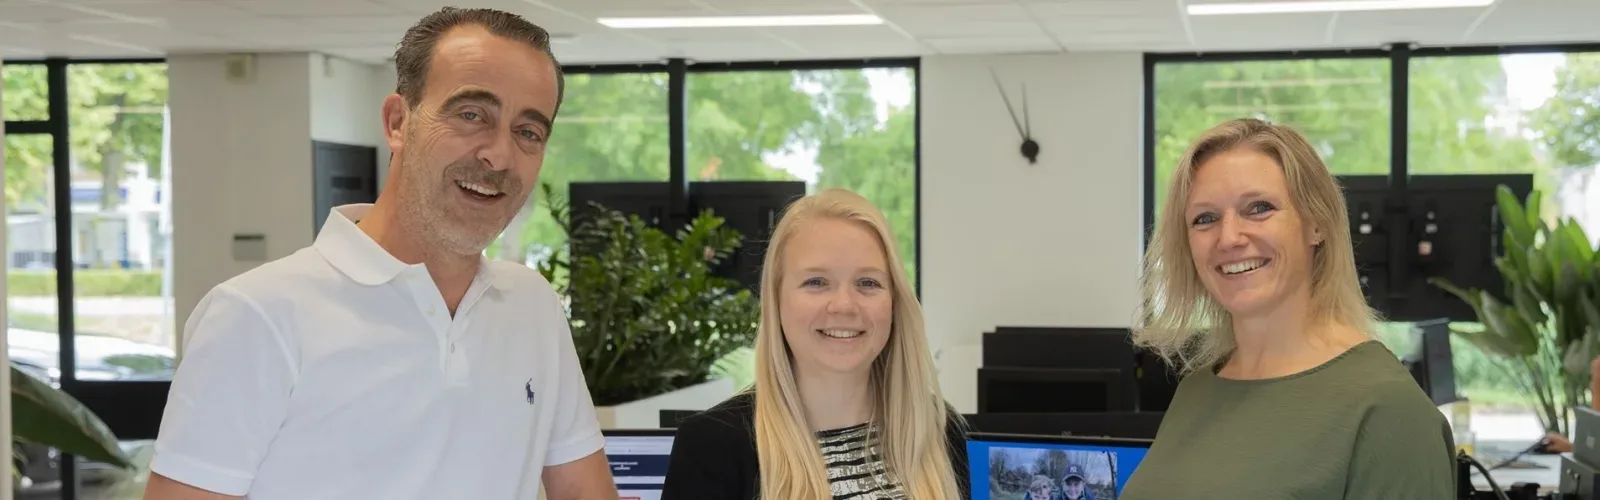
REMAX Your Real Estate Agent stands for a customer-oriented approach in the real estate industry. Our independent agents support each other to provide you with the highest possible service. We are well positioned in Haarlemmermeer and also have agents in Haarlem, which makes our service area broad and can provide you with many benefits. Our focus lies on your wishes, because we are not property-oriented but customer-oriented. Service is...
Current housing stock
-

- Available
Bridgemankade 146
2132HR Hoofddorp
€ 1.200.000 k.k.
€ 10.084/m²
A+Save as favorite- Living area
- 119 m²
- Land area
- —
- Bedrooms
- 2
-

- Available
Thoornpolder 24
2134WN Hoofddorp
€ 875.000 k.k.
A+Save as favorite- Living area
- 181 m²
- Land area
- 317 m²
- Bedrooms
- 5
-

- Available
Dassenbos 222
2134RK Hoofddorp
€ 500.000 k.k.
€ 4.587/m²
ASave as favorite- Living area
- 109 m²
- Land area
- 143 m²
- Bedrooms
- 4
-

- Available
Jane Addamsstraat 68
2131VV Hoofddorp
€ 560.000 k.k.
€ 4.118/m²
BSave as favorite- Living area
- 136 m²
- Land area
- 160 m²
- Bedrooms
- 4
-

- Available
Söderblomstraat 262
2131GS Hoofddorp
€ 615.000 k.k.
€ 4.805/m²
BSave as favorite- Living area
- 128 m²
- Land area
- 152 m²
- Bedrooms
- 4
-

- Available
Zuiddijk 75 A
1501CC Zaandam
€ 300.000 k.k.
€ 5.357/m²
CSave as favorite- Living area
- 56 m²
- Land area
- —
- Bedrooms
- 2
Reviews (224)
Review platforms
BronscoresTotal score
224 total reviews

Funda
81 reviews on Funda

143 reviews on Google
-
Maria Vallejos
10Als je een makelaar zoekt die je compleet ontzorgt ben je bij Daniëlle Damstra aan het goede adres. Zij is verantwoordelijk; scherp, proactief en meedenkend. Haar werk is haar passie en dat merk je. Een aanrader!
-
Skagerrak 9
10Translated by AITop real estate agent who takes care of you! Heart for the profession; sharp and proactive. She ensures a successful sales and purchase process. In short, a recommendation!
-
Neptunussingel 23
10Wij zijn erg tevreden over de begeleiding van onze makelaar Agnes Steinhaus bij de zoektocht en aankoop van ons huis. De communicatie verliep prettig en duidelijk, en we voelden ons goed geholpen tijdens het hele proces. Er werd goed meegedacht, snel geschakeld en deskundig advies gegeven. Dankzij de fijne begeleiding hebben wij met vertrouwen ons huis kunnen kopen. Agnes is zeker een aanrader!
-
Wayesteinsingel 69
9Agnes van ReMax Hoofddorp als aankoopmakelaar is altijd winst. In deze nog steeds overspannen markt is een aankoopmakelaar zowiezo effectief omdat het op de laatste biedwaarde aankomt of je het nét wel of nét niet haalt,en vooral niét teveel overbiedt. De contacten tussen de makelaars onderling betaalt zich terug. Die courtage win je dus altijd terug. Maar nu het plezier in de samenwerking; Agnes heeft humor en het maakt het avontuur in de interactie met 'weird' verkoopmakelaar…
-
Martijn Langeveld
10Translated by AIThe cooperation with Agnes was very nice. Good communication, considerate, easy to reach by phone and very social.
-
Paul van Tol
10 -
Seungjin
10Translated by AII can't thank Fleur (our fantastic real estate agent at RE/MAX) enough! She made the impossible possible by completing the purchase of our house within a month. The communication in English was seamless, and she guided us patiently through every step from A to Z, especially since we had no experience with the real estate market. If you're looking for a reliable real estate agent, then Fleur is the right person!
-
BC
10Translated by AIMartine is a top real estate agent! From the first moment professional, honest and always easy to reach. She really puts herself in your shoes and guides you step by step through the entire buying process. Thanks to her knowledge and advice, we were able to buy our house with a good feeling. Absolutely recommended for everyone looking for an involved and reliable real estate agent!
-
Kif Kif
10Translated by AIDaniëlle van Remax is a top professional. From the first contact with all information up to signing at the notary, perfect guidance on the way to finding a starter home for my son. Very satisfied.
-
Judith Boshamer
8Translated by AII am very satisfied with Mrs. Damstra, she has helped me a lot and ultimately found the best house for me. Tomorrow I will sign the purchase contract 🫶 …
-
Prinses Catharina-Amalialaan 35
8Translated by AIHandled quickly and appropriately. Always keeping our interests in mind, that felt very nice. Good communication, clear explanation of difficult issues/contracts. Nice cooperation!
-
Gita Jipat
10Translated by AIVery satisfied with the sale of my house in The Hague by Daniëlle Damstra from REMAX. Professional, involved and clear communication. Everything perfectly arranged and a top result! Definitely a recommendation!
-
benny de boer
10Translated by AINice person that Daniëlle Damstra Really top
-
Nijverheidsstraat 7 M
10Translated by AIThanks to the knowledge and professional attitude of Dennis, the apartment has been sold. We are more than satisfied with how he guided us and we recommend him 110%. Dennis, once again, thank you very much. And for everyone who reads this and wants to sell their house or buy one, you will not regret doing it with Dennis.
-
Sander de Vries
10Translated by AIExcellent real estate agent. Open and honest, great cooperation, really a recommendation!
-
Grebbebos 1
10Translated by AIDaniëlle guided us well through the purchase and sale of our house. Buying and selling a house is not something you do every day, and it's nice to have someone with experience who thinks along with you. We also found it very nice that she was available many weekends and evenings to answer questions. Top!
-
Schans 1 A
9Translated by AIIf you want to go through the buying process with a clear heart, I recommend Daniëlle Damstra to you. She is efficient; straightforward and professional. She helps you with all matters surrounding the purchase of a new home and takes care of them; which is very nice during a stressful period. Top real estate agent!
-
MJ Kim
10Translated by AII had a very pleasant experience with Fleur during the purchase of my apartment. She is young, energetic and extremely dedicated to her clients. From the very beginning she was friendly, responded quickly and acted immediately when needed. Fleur has an excellent knowledge of the Hoofddorp area and clearly maintains good relationships with local real estate agents. I really felt that she communicated very effectively and professionally with all parties involved, which made a big difference in the process. Her local expertise and network were a huge advantage and played an important role in finding the apartment that I really wanted. Throughout the entire process she was proactive, supportive and full of positive energy. I am very happy with my new home and sincerely grateful for Fleur's help. I wholeheartedly recommend her to anyone who wants to buy a property in Hoofddorp!
-
Rob de Groot
10Translated by AIDennis de Haan is a very sharp and professional real estate agent. The communication is fast and clear, which makes the entire process very pleasant. He has an eye for detail and really thinks with you. Moreover, he is a nice and approachable person to go house hunting with. Definitely recommended!
-
Klaterbos 96
10Translated by AIDennis has once again helped us very well with the purchase. Communicates smoothly and is very sharp. In short, TOP.