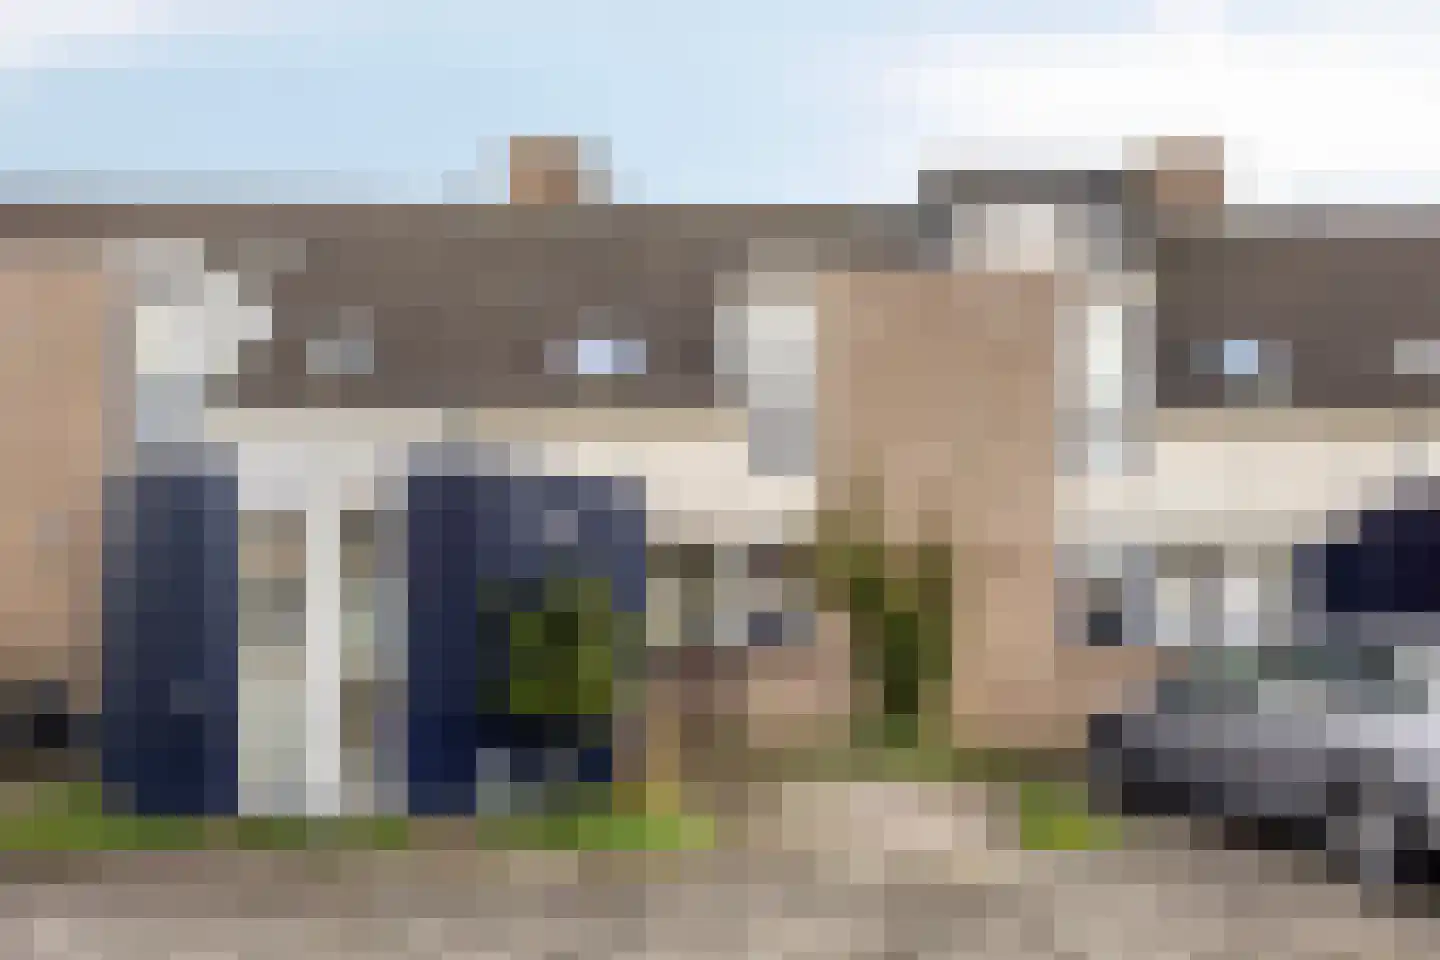
- Available
Landleeuw 55
2131HV Hoofddorp
€ 785.000 k.k.
€ 3.703/m²
- Living area
- 212 m²
- Land area
- 314 m²
- Bedrooms
- 7
Searching in 975 houses in Hoofddorp
Type to search. Use arrow down and arrow up to navigate through results and press Enter to open.
Hidden search suggestions.
View current properties in Hoofddorp or search targeted on street, postal code and property characteristics.
View the current housing stock in Hoofddorp and quickly filter by price, living area, rooms and more. There are currently 975 houses in this place within our selection. View also 635 sold houses in Hoofddorp for extra insight into the local housing market.
2131HV Hoofddorp
€ 785.000 k.k.
€ 3.703/m²
2133JG Hoofddorp
€ 500.000 k.k.
€ 4.167/m²
2131RX Hoofddorp
€ 525.000 k.k.
€ 5.250/m²
2134XB Hoofddorp
€ 1.200.000 k.k.
€ 6.186/m²
2132GX Hoofddorp
€ 2.550 p/m
€ 34/m²
2131BG Hoofddorp
€ 625.000 k.k.
€ 6.250/m²
2131VB Hoofddorp
€ 500.000 k.k.
€ 4.237/m²
2132HS Hoofddorp
€ 370.000 k.k.
€ 7.708/m²
2135VG Hoofddorp
€ 995.000 k.k.
€ 6.723/m²
2132RC Hoofddorp
€ 2.400 p/m
€ 22/m²
2134XS Hoofddorp
€ 899.000 k.k.
€ 4.833/m²
2135BN Hoofddorp
€ 745.000 k.k.
€ 5.138/m²
2133DW Hoofddorp
€ 425.000 k.k.
€ 5.380/m²
2132NZ Hoofddorp
€ 650.000 k.k.
€ 5.963/m²
2131GS Hoofddorp
€ 600.000 k.k.
€ 4.688/m²
2134ML Hoofddorp
€ 550.000 k.k.
€ 4.622/m²
2134BR Hoofddorp
€ 569.000 k.k.
€ 5.173/m²
2132HE Hoofddorp
€ 449.000 k.k.
€ 7.610/m²
2132GH Hoofddorp
€ 499.000 k.k.
€ 4.193/m²
2133KB Hoofddorp
€ 425.000 k.k.
€ 5.519/m²
2135ZB Hoofddorp
€ 1.045.000 k.k.
€ 5.529/m²
2131ZJ Hoofddorp
€ 495.000 k.k.
€ 4.541/m²
2132HX Hoofddorp
€ 3.220 p/m
€ 33/m²
2132CL Hoofddorp
€ 519.000 k.k.
€ 6.920/m²
2131GD Hoofddorp
€ 550.000 k.k.
€ 4.545/m²
2132HR Hoofddorp
€ 2.100 p/m
€ 35/m²
2135RD Hoofddorp
€ 490.000 k.k.
€ 7.313/m²
2132DK Hoofddorp
€ 409.000 k.k.
€ 5.112/m²
Get free quotes from real estate agents with local market knowledge. Compare more than 181 real estate agents in Hoofddorp.
Selling a home in Hoofddorp? View the sales-oriented guide sell a house in Hoofddorp, compare all real estate agents in Hoofddorp or view the top 10 real estate agents in Hoofddorp for extra context to your choice.
Real estate agents make sharper offers when they know you're comparing — ask for quotes for sale or purchase.
Practical answers about housing supply, sales and comparing real estate agents in Hoofddorp.
The costs of a real estate agent in Hoofddorp depend on commission, setup costs, property presentation and the chosen service. Compare the 181 real estate agents in Hoofddorp via the real estate agent page and request multiple quotes to compare rates and approach well.
Within our selection, we are currently showing 975 houses in Hoofddorp. View also the sold houses in Hoofddorp to compare the current offering with recent transactions.
Take into account not only price and living area but also maintenance, energy label, location, outdoor space and sales status. This way you compare houses in Hoofddorp on more than just the asking price.
A local real estate agent knows the neighborhoods, recent transactions and demand in Hoofddorp. By comparing 181 real estate agents in the region you get a better insight into prices, sales strategy and expected yield; the top 10 in Hoofddorp provides a useful starting point.
Yes, when making a sales plan, a valuation in Hoofddorp is wise. You gain insight into a realistic asking price and can then compare offers from real estate agents specifically.
View current location data on residents, WOZ development, housing stock, energy consumption, business activity and safety in Hoofddorp. In 2025 were there 80.905 residents. The average WOZ value in 2025 is EUR 490.000.
These figures help to better assess and compare the housing stock in Hoofddorp with recent sold homes. Orient yourself then on suitable top real estate agents in Hoofddorp for sales advice in this region.
Residents
80.905
Last year: 2025
Average WOZ
EUR 490.000
Last year: 2025
Average income per person.
EUR 38.000
Source: AllNumbers
Crimes (current year)
3.691
Total registered
| Year | Residents |
|---|---|
| 2021 | 77.890 |
| 2022 | 78.590 |
| 2023 | 79.650 |
| 2024 | 79.895 |
| 2025 | 80.905 |
| Year | Average WOZ |
|---|---|
| 2021 | EUR 352.000 |
| 2022 | EUR 384.000 |
| 2023 | EUR 458.000 |
| 2024 | EUR 462.000 |
| 2025 | EUR 490.000 |
Hoger
20.610
Praktisch
15.460
Middelbaar
25.410
Europa
7.615
Nederland
46.450
Buiten Europa
26.840
Label A
12.873
Label C
10.744
Label B
7.845
Label A+
1.259
Label D
850
Label A++
850
Label A+++
648
Label E
499
Label G
366
Label F
259
Label A++++
196
Label A+++++
40
| Year | Gas (m3) | Electricity (kWh) |
|---|---|---|
| 2020 | 1.000 | 2.880 |
| 2021 | 1.110 | 2.910 |
| 2022 | 860 | 2.720 |
| 2023 | 760 | 2.560 |
| 2024 | 740 | 2.600 |
Hoekwoning
Gas: 910 • Electricity: 2.860
Huurwoning
Gas: 620 • Electricity: 1.950
Koopwoning
Gas: 850 • Electricity: 2.930
Appartement
Gas: 530 • Electricity: 1.770
Tussenwoning
Gas: 790 • Electricity: 2.700
Vrijstaande woning
Gas: 1.420 • Electricity: 4.390
Twee-onder-één-kap woning
Gas: 1.040 • Electricity: 3.840
Total number of company establishments: 10.310
| Period | Crimes |
|---|---|
| jan 2025 | 269 |
| jan 2026 | 313 |
| jul 2025 | 310 |
| jun 2025 | 282 |
| mei 2025 | 277 |
| mrt 2025 | 327 |
| nov 2024 | 294 |
| nov 2025 | 328 |
| okt 2024 | 279 |
| okt 2025 | 358 |
| sep 2024 | 333 |
| sep 2025 | 332 |
These figures give an indicative picture of safety trends in the living environment of Hoofddorp.
Short answers based on current local statistics, handy for a quick comparison of the living environment.
Hoofddorp telt in 2025 ongeveer 80.905 inwoners.
De gemiddelde WOZ-waarde in Hoofddorp is in 2025 circa € 490.000.
Het gemiddelde inkomen per inwoner in Hoofddorp ligt rond € 38.000 per jaar.
Voor het huidige jaar gaat het om ongeveer 3.691 geregistreerde misdrijven. Gebruik deze cijfers als indicatie en vergelijk trends per periode.
In Hoofddorp komt vooral "Tussenwoningen" veel voor, met ongeveer 15.769 woningen.