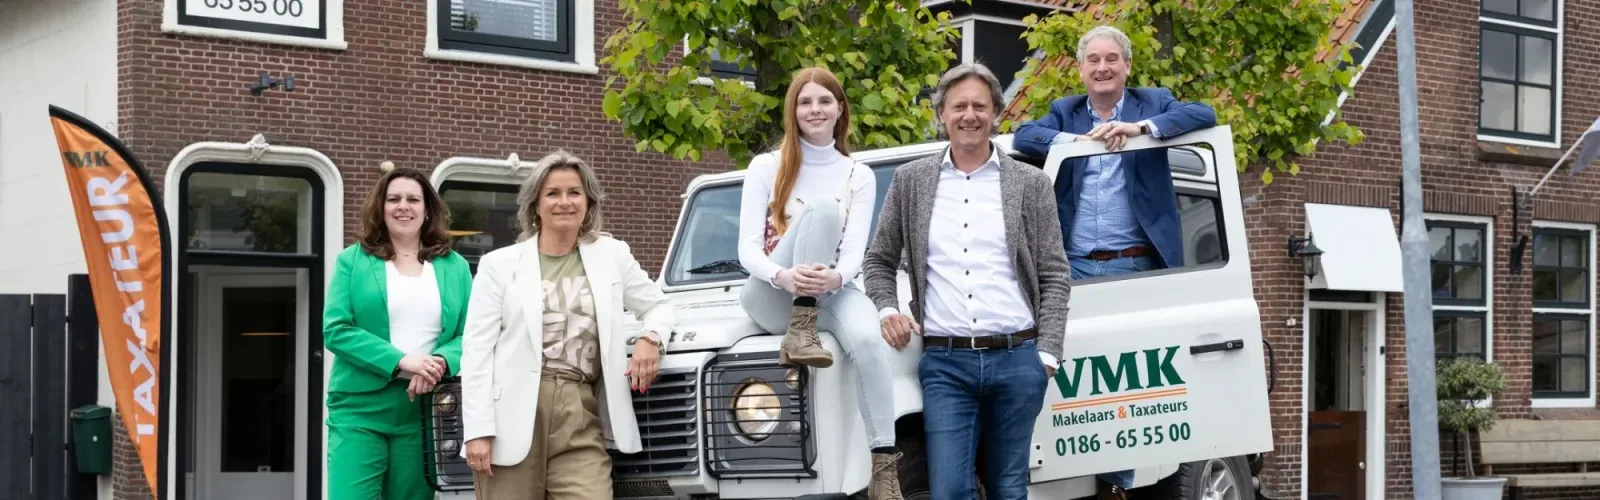

Bij VMK Makelaars & Taxateurs in Numansdorp is het doel om zowel klanten als medewerkers te laten genieten van de werkzaamheden. Meer dan 25 jaar staat het kantoor voor plezierige en betrouwbare makelaarsdienstverlening. Met een sterke focus op klantgerichtheid en kwaliteit, zorgen wij ervoor dat elke transactie soepel verloopt. Of het nu gaat om een waardebepaling, taxatie of de aankoop en verkoop van woningen en bedrijven, wij staan v...
Current housing stock
-

- Available
Schenkeldijk 80
3284LP Zuid-Beijerland
€ 928.500 k.k.
€ 4.836/m²
ASave as favorite- Living area
- 192 m²
- Land area
- 1550 m²
- Bedrooms
- 3
-

- Available
H.B.S.Laan 16
3262JB Oud-Beijerland
€ 750.000 k.k.
€ 5.319/m²
DSave as favorite- Living area
- 141 m²
- Land area
- —
- Bedrooms
- 2
-

- Available
van Hogendorplaan 11
3299AR Maasdam
€ 775.000 k.k.
ESave as favorite- Living area
- 126 m²
- Land area
- 990 m²
- Bedrooms
- 3
-

- Available
Zwaluwplaats 20
3281JN Numansdorp
€ 438.500 k.k.
BSave as favorite- Living area
- 112 m²
- Land area
- 213 m²
- Bedrooms
- 4
-

- Available
Kloosring 22
3261SB Oud-Beijerland
€ 1.500.000 k.k.
A+Save as favorite- Living area
- 266 m²
- Land area
- 1407 m²
- Bedrooms
- 5
-

- Available
Meerkoet 18
3263AD Oud-Beijerland
€ 438.500 k.k.
€ 4.137/m²
A+Save as favorite- Living area
- 106 m²
- Land area
- 154 m²
- Bedrooms
- 3
Reviews (142)
Review platforms
BronscoresTotal score
142 total reviews

Funda
46 reviews on Funda

96 reviews on Google
-
Groeneweg 24
10Deskundig en prettige samenwerking, en ons huis zeer snel verkocht. Als we ooit ons huis weer verkopen weten we wie te bellen.
-
juul peeman
10Translated by AIBarend is a real professional with lots of passion and business knowledge. He is friendly, professional and takes the time to explain everything clearly, which creates a pleasant and familiar feeling. VMK helped me quickly and expertly with the appraisal of my new home. The entire process went smoothly and efficiently, and the communication was clear and transparent. Appointments were neatly followed up on and I was kept well informed. I am very satisfied with the service and would definitely recommend VMK and Barend to anyone looking for a reliable and professional party.
-
Hans Reedijk
8Goed geholpen bij het taxeren van onze woning. Vlot en professioneel 👍 …
-
Dineke Schuurman
10 -
Pim Vieveen
10Barend kwam op ons verzoek langs voor een taxatie, dit om deze in te dienen bij onze hypotheek verstrekker. Barend is zeer deskundig en uiterst prettig in de omgang. Na een paar dagen al het rapport binnen, maarliefst 113 pagina's 😅. Dank Barend en collega's voor de snelle service! Pim Vieveen
-
Kwartslaan 39
10Zeer enthousiaste en sympathieke makelaar. Ralph heeft mij met twee huizen geholpen. Uitermate tevreden en aan te bevelen.
-
Mastland 22
9Fijn kantoor, dat ik al langer ken, betrokken mensen die hulpvaardig zijn en meedenken. Huis was snel verkocht. Goed advies en duidelijke afspraken.
-
Laurens Smits
10Translated by AIGreat contact! Quick responses, know exactly what's going on in the market. We definitely recommend VMK!
-
Sefa Kaya
10Translated by AIHad a very nice experience. The appraisal went very smoothly and we were accurately and quickly assisted. Nothing but praise for the way customers are treated here. The personal approach of Mr. van Marwijk Kooy made it complete. Definitely a recommendation!
-
marcel in`t Veld
10Translated by AINot the first time that Barend has appraised our house. Very friendly man with expertise.
-
Weth. Van der Veldenweg 9
10Translated by AIFor the sale of our parents' house, we chose VMK and we have never regretted that decision. Getting to know Ralph was very pleasant and we had an immediate good 'click'. Ralph has excellent knowledge of the market and can accurately assess potential buyers. Ralph thought very well with us and with a realistic, strategic asking price he managed to quickly sell an unusual property for a nice price. Prime, informal and correct communication. Oo…
-
Stougjesdijk 115
10Translated by AIAt the first meeting, Barend was the only one of 3 invited real estate agents who was well prepared. He knows the local market very well, which resulted in a somewhat later turned out to be an accurate advice on the asking price. The further processing of the process was done by Ralph. He did that neatly. Was accurate, informative and answered asked questions smoothly and well. Our house was sold within a few weeks for a good price. We can certainly recommend VMK.
-
de Heul 27
10Translated by AIThe contact with the real estate agent was very professional; yet personal. A very honest real estate agent who, by choosing the sales strategy and pricing, had sold our house within a very short period of time. VMK has a large number of houses in portfolio, but gives you the impression almost as if they are working exclusively for you. Super.
-
Karianne de Rave
10Translated by AIMr. van Marwijk Kooy has carried out the valuation of our home and we are very satisfied with it. The valuation went smoothly, the processing was quick and efficient and the result was very reasonable.
-
Kevin van Dam
10Translated by AIFast, professional and friendly real estate agents. Who always keep their appointments, definitely a recommendation.
-
Molendijk 130
10Translated by AIThe contact went smoothly. When I called, they reacted immediately or called back. I was well guided and it turned out to be satisfactory. The staff are reliable.
-
Kastanjestraat 5
10Translated by AIVery nice real estate agent, who has helped us with buying and selling in a very nice, very accessible way!
-
Maasdijk 17
10Translated by AIRalph has sold our house with full enthusiasm, doing everything from A to Z. Nothing was too much to ask. We find VMK a real recommendation and are more than satisfied, Super thanks.
-
Oostdijk 153
9Translated by AIEverything went top with Ralph from VMK. Nice communication and thinking along! We would sell our house again with VMK!
-
daniel austermann
10Translated by AIA comprehensive appraisal has been issued. With clear explanation and enough information.