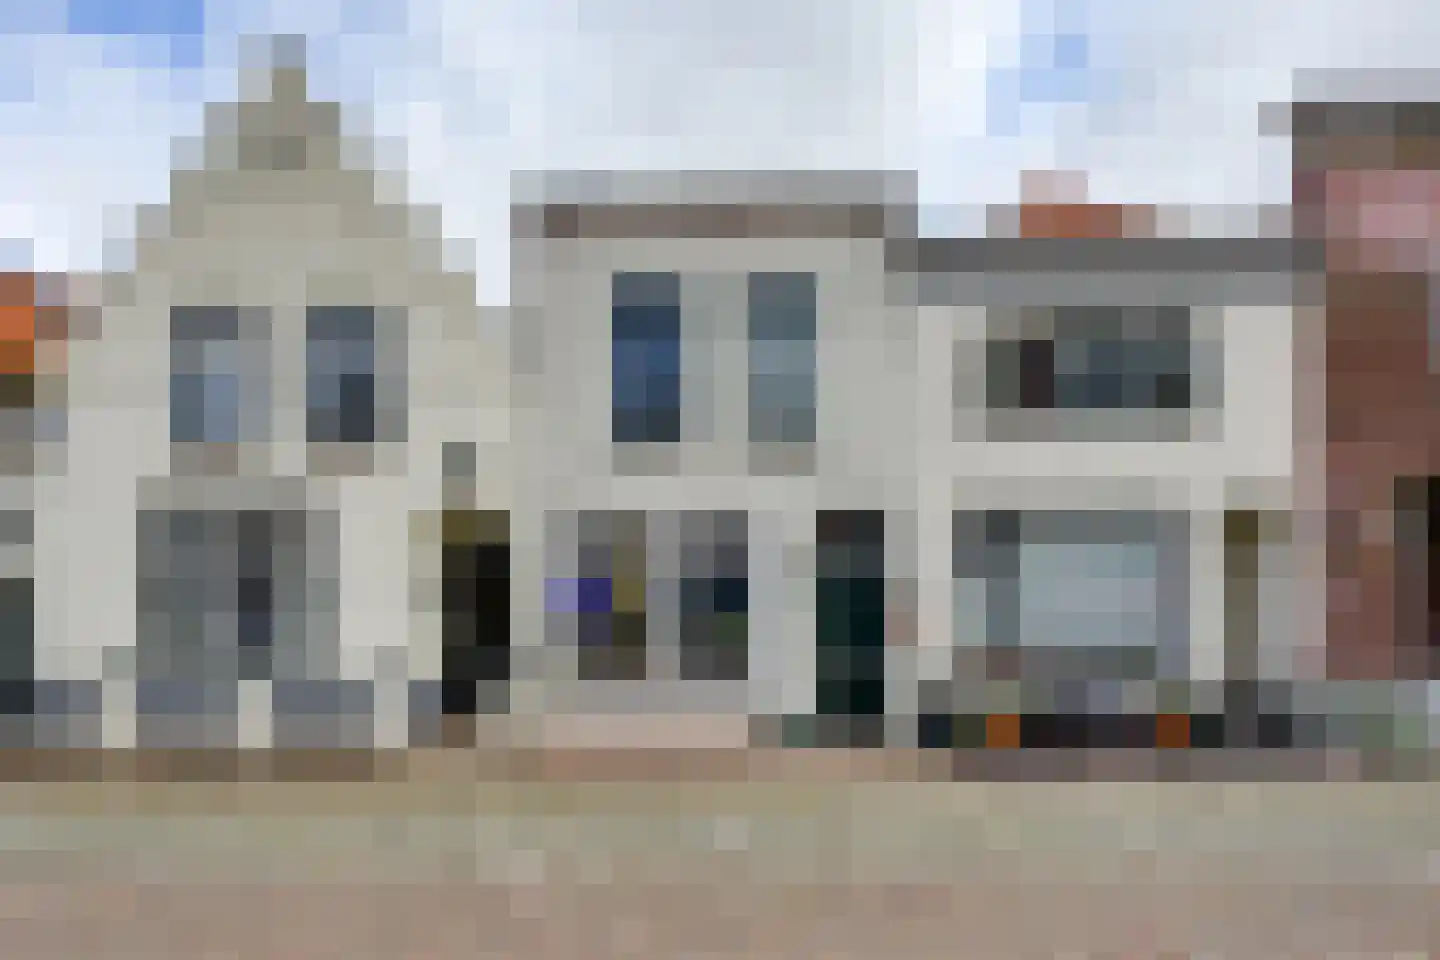
Housing offer in Ooltgensplaat

Searching in 35 houses in Ooltgensplaat

Connected to: Vastgoed Nederland NVM Makelaars

View the current housing stock in Ooltgensplaat and quickly filter by price, living area, rooms and more. There are currently 35 houses in this place within our selection. View also 18 sold houses in Ooltgensplaat for extra insight into the local housing market.

Selection

Search and filter homes

Set your preferences and discover homes that suit you.

Total supply 243.520
Filters

Set price, area and other characteristics. Adjust a filter or click on Show homes. Location changes directly above.

Reset filters

You search for

  • Place Ooltgensplaat

Selling a home in Ooltgensplaat? Compare realtor offers

Get free quotes from real estate agents with local market knowledge. Compare more than 15 real estate agents in Ooltgensplaat.

Free request a quote

  • Quotes in Ooltgensplaat
  • Non-binding
  • Personal
  • Compare free rates

Selling a home in Ooltgensplaat? Compare all real estate agents in Ooltgensplaat or view the top 10 real estate agents in Ooltgensplaat for extra context for your choice.

Compare multiple quotes

Real estate agents make sharper offers when they know you're comparing — ask for quotes for sale or purchase.

Frequently asked questions about homes in Ooltgensplaat

Practical answers about housing supply, sales and comparing real estate agents in Ooltgensplaat.

Residential and neighborhood statistics in Ooltgensplaat

View current location data on residents, WOZ development, housing stock, energy consumption, business activity and safety in Ooltgensplaat. In 2025 were there 2.730 residents. The average WOZ value in 2025 is EUR 309.000.

These figures help to better assess and compare the housing stock in Ooltgensplaat with recent sold homes. Orient yourself then on suitable top real estate agents in Ooltgensplaat for sales advice in this region.

Residents

2.730

Last year: 2025

Average WOZ

EUR 309.000

Last year: 2025

Average income per person.

EUR 36.700

Source: AllNumbers

Crimes (current year)

86

Total registered

Demographics and WOZ development

Inhabitants per year

Inhabitants per year in Ooltgensplaat
Year Residents
2021 2.655
2022 2.710
2023 2.715
2024 2.685
2025 2.730

Annual WOZ value

WOZ value per year in Ooltgensplaat
Year Average WOZ
2021 EUR 216.000
2022 EUR 241.000
2023 EUR 289.000
2024 EUR 302.000
2025 EUR 309.000

Composition of residents

Age build-up

65+: 625 0-15: 400 15-25: 310 25-45: 610 45-65: 790

Education level

Hoger

440

Praktisch

670

Middelbaar

930

Origin of residents (2025)

Europa

160

Nederland

2.425

Buiten Europa

150

Housing stock and construction periods

Types of homes

Hoekwoningen 247
Appartementen 77
Tussenwoningen 378
Vrijstaande woningen 247
Twee-onder-één-kap woningen 203

Construction period of buildings

Voor 1700 3
1700 tot 1900 122
1900 tot 1925 180
1925 tot 1950 151
1950 tot 1970 217
1970 tot 1980 297
1980 tot 1990 74
1990 tot 2000 256
2000 tot 2010 96
2010 tot 2020 61
2020 en later 128

Energy and sustainability

Energy label distribution

Label A

309

Label B

270

Label C

213

Label G

188

Label D

148

Label F

148

Label E

97

Label A+

25

Label A+++

14

Label A++

2

Label A++++

2

Label A+++++

0

Average energy consumption per year

Average energy consumption per year in Ooltgensplaat
Year Gas (m3) Electricity (kWh)
2020 1.280 2.960
2021 1.440 3.060
2022 1.080 2.850
2023 920 2.680
2024 890 2.780

Consumption per house type

Hoekwoning

Gas: 900 • Electricity: 2.440

Huurwoning

Gas: 810 • Electricity: 2.070

Koopwoning

Gas: 980 • Electricity: 3.010

Appartement

Gas: 700 • Electricity: 1.980

Tussenwoning

Gas: 780 • Electricity: 2.270

Vrijstaande woning

Gas: 1.200 • Electricity: 3.750

Twee-onder-één-kap woning

Gas: 920 • Electricity: 2.710

Business activity in Ooltgensplaat (2025)

Handel en HORECA 50
Nijverheid en energie 70
Zakelijke dienstverlening 85
Overheid, onderwijs en zorg 45
Landbouw, bosbouw en visserij 40
Vervoer, informatie en communicatie 20
Financiele diensten en onroerendgoed 10
Cultuur, recreatie en overige diensten 35

Total number of company establishments: 360

Recent crime statistics

Recent crime statistics in Ooltgensplaat
Period Crimes
jan 2025 15
jan 2026 8
jul 2025 11
jun 2025 1
mei 2025 4
mrt 2025 6
nov 2024 7
nov 2025 9
okt 2024 6
okt 2025 7
sep 2024 3
sep 2025 5

These figures give an indicative picture of safety trends in the living environment of Ooltgensplaat.

Frequently asked questions about living in Ooltgensplaat

Short answers based on current local statistics, handy for a quick comparison of the living environment.

Hoeveel inwoners heeft Ooltgensplaat?

Ooltgensplaat telt in 2025 ongeveer 2.730 inwoners.

Wat is de gemiddelde WOZ-waarde in Ooltgensplaat?

De gemiddelde WOZ-waarde in Ooltgensplaat is in 2025 circa € 309.000.

Wat is het gemiddelde inkomen per inwoner in Ooltgensplaat?

Het gemiddelde inkomen per inwoner in Ooltgensplaat ligt rond € 36.700 per jaar.

Hoe veilig is wonen in Ooltgensplaat?

Voor het huidige jaar gaat het om ongeveer 86 geregistreerde misdrijven. Gebruik deze cijfers als indicatie en vergelijk trends per periode.

Welke woningtypen komen het meest voor in Ooltgensplaat?

In Ooltgensplaat komt vooral "Tussenwoningen" veel voor, met ongeveer 378 woningen.

Receive free, non-binding quotes

Compare multiple real estate agents and choose the best match.