
Van de Ridder Makelaars has been a family business since 1973 that has developed into a reliable partner in the housing market. Despite the founder Wout van de Ridder not being present at the office every day anymore, his experience still influences the current way of working. His daughters continue to run the business with a combination of years of expertise and a modern approach. In Alkmaar and Broek op Langedijk we are ready for you...
Current housing stock
-

- Available
Reiger 17
1721DN Broek op Langedijk
€ 1.150.000 k.k.
€ 6.250/m²
BSave as favorite- Living area
- 184 m²
- Land area
- 1506 m²
- Bedrooms
- 3
-
- Available
Papegroet 6
1722KL Zuid-Scharwoude
€ 895.000 k.k.
€ 4.431/m²
ASave as favorite- Living area
- 202 m²
- Land area
- 405 m²
- Bedrooms
- 4
-
- Available
Hemelboog Binnen 61 D
1705SL Heerhugowaard
€ 479.500 k.k.
€ 3.717/m²
ASave as favorite- Living area
- 129 m²
- Land area
- 165 m²
- Bedrooms
- 4
-

- Available
Fröbelstraat 1
1834VG Sint Pancras
€ 670.000 k.k.
FSave as favorite- Living area
- 125 m²
- Land area
- 335 m²
- Bedrooms
- 4
-

- Available
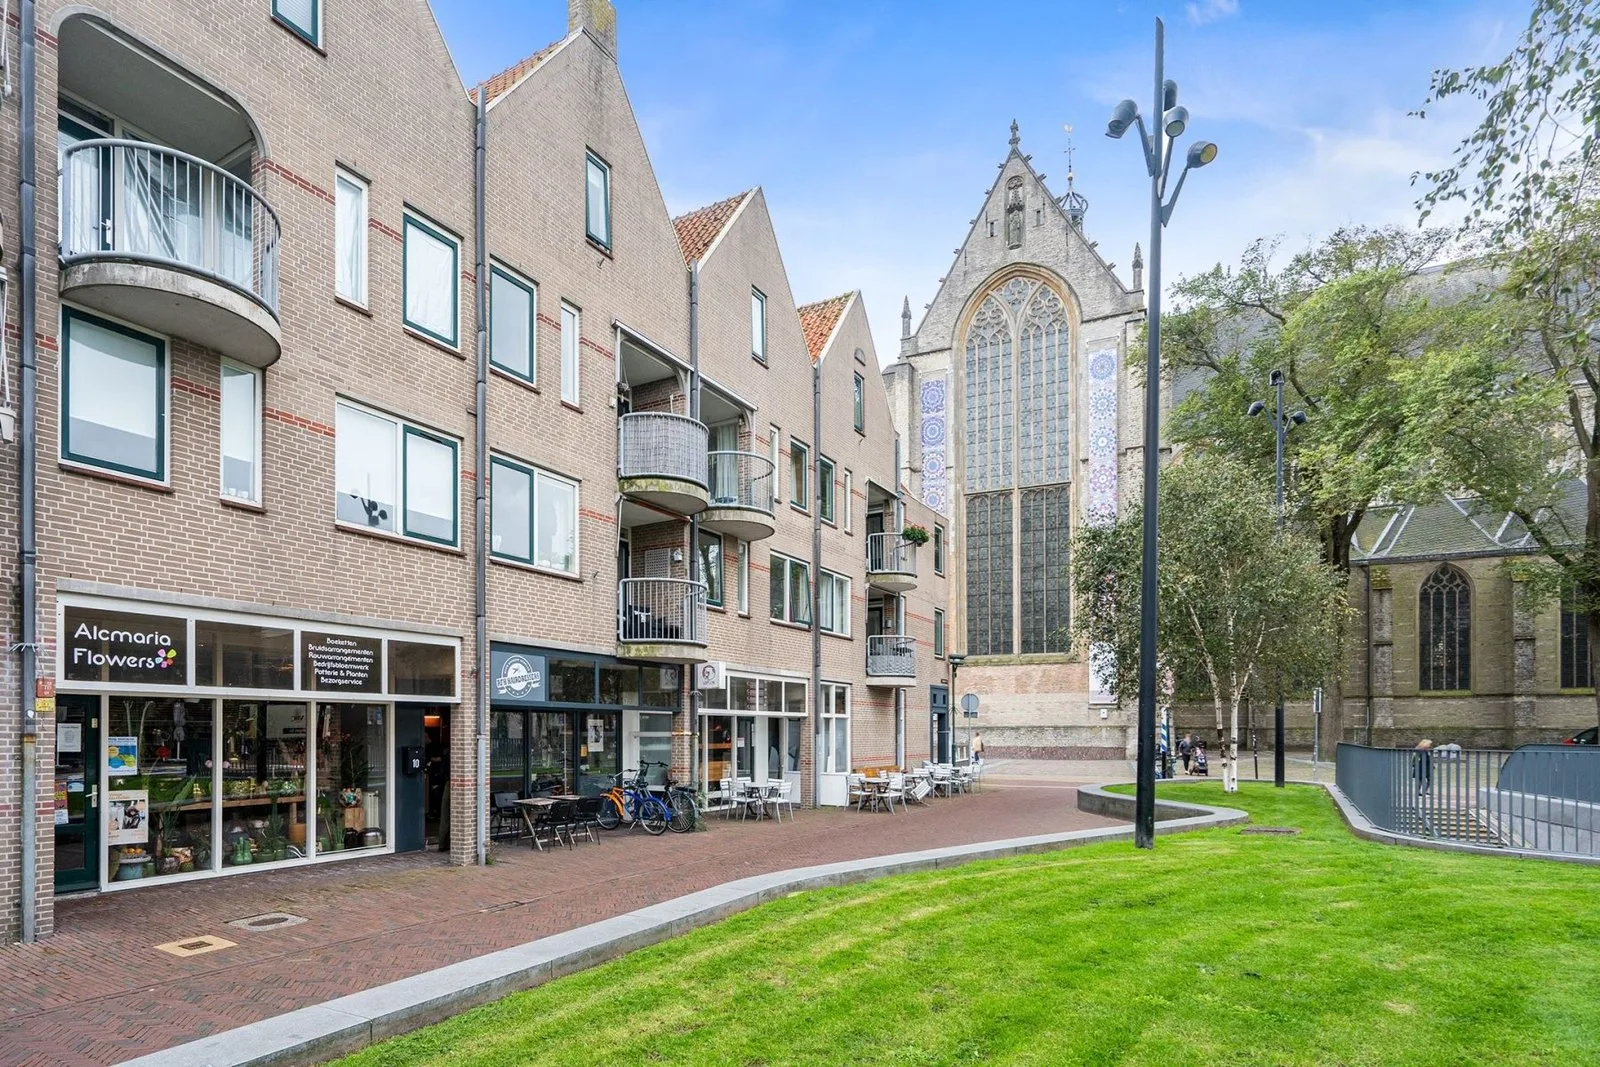
Dorpsstraat 77 A
1721BC Broek op Langedijk
€ 250.000 k.k.
GSave as favorite- Living area
- 47 m²
- Land area
- —
- Bedrooms
- 1
-

- Available
Oosterstreng 126
1964KD Heemskerk
€ 565.000 k.k.
CSave as favorite- Living area
- 144 m²
- Land area
- 235 m²
- Bedrooms
- 4
Reviews (123)
Review platforms
BronscoresTotal score
123 total reviews

Funda
105 reviews on Funda

18 reviews on Google
-
Dorpsstraat 101 D
8Prima geholpen met verkoop van mijn vaders huis. Reageert snel bij vragen en goed bereikbaar. Ook de communicatie met het kantoor was goed.
-
Dorpsstraat 80
10Translated by AIWell accompanied, listened to us well, no disturbance anywhere, went quickly. Compliment for Dennis. (and his team of course!)
-
Henk Glas
10Wij zijn heel blij met Van de Ridder Makelaars! Vanaf het eerste gesprek voelden we ons goed geholpen. Eerlijk en realistisch advies en prettige communicatie. Dankzij hun professionele aanpak was de verkoop verrassend snel rond.
-
Een funda gebruiker
9Een makelaar die de omgeving kent, is een must en komt alleen maar ten goede van de verkoop. Het contact verliep goed. Ze zijn duidelijk met afspraken en een goede begeleiding.
-
2dehans1970
10Hier hou ik van: vlotte maar geen gladde makelaar! Gaf goed advies, volledig en bleek achteraf realistisch. Contact soepel en snel. Zowel via mail als whatsapp. Nette courtage waarbij alles netjes werd geregeld. Ook toen de verkoop rond was netjes de laatste stappen afgerond. Kantoor locatie Broek op Langendijk warm en knus. Al met al zeer blij dat Menno als verkoopmakelaar voor ons is opgetreden.
-
Manusveert 118
10Hier hou ik van: vlotte maar geen gladde makelaar! Gaf goed advies, volledig en bleek achteraf realistisch. Contact soepel en snel. Zowel via mail als whatsapp. Netter courtage waarbij alles netjes werd geregeld. Ook toen de verkoop rond was netjes de laten stappen afgerond. Kantoor locatie Broek op Langendijk warm en knus. Al met al zeer blij dat Menno als verkoopmakelaar voor ons is opgetreden.
-
Kompasweg 73
9Vanaf de eerste ontmoeting was het meteen heel erg positief en een prettige ervaring om door ons nieuwe huis te wandelen onder begeleiding van Menno. Vrij snel besloten dat we de verkoop van onze eigen woning ook door Menno wouden laten doen. En heel snel al met positief resultaat verkocht. Menno en de Ridder Makelaars bedankt voor alles. Als Je een makelaar zoekt kunnen wij De Ridder makelaars van harte aanraden!
-
Oeverzeggeweg 61
10Top makelaar met aandacht voor zowel de verkopende als de kopende partij! Erg tevreden met Menno! Mochten wij in de toekomst weer willen verhuizen weten wij wie we gaan bellen!
-
Fuut 17
9Soepel contact. Snelle klappen. Goede background en veel lokale kennis. Gewoon een degelijke makelaar. Rechtstreeks in de benadering.
-
Wonge 9
9Prima communicatie en deskundigheid . De verkoop is snel en eerlijk verlopen Ook de aansturing van derden ging prima..
-
Sportparklaan 5
9Jong team die zeer serieus zijn. Goede begeleiding voor ons als verkopers. Heeft onze woning voor een goede prijs verkocht.
-
Lommerhof 30
9Makelaar-Menno heeft aan een half woord genoeg en acteert zeer zelfstandig. Indien nodig koppelt hij terug. Heeft grote kennis van de regionale markt. Zorgeloos dus.
-
Dorpsstraat 742
9Goed contact gehouden met de klant tefeloon ,of mail . Gemaakte afspraken netjes nagekomen, snel gehandeld met het verkoop van het huis. Goed geregeld met kijk dagen ,makelaar regelde het netjes .
-
Wijk aan Duinerweg 139
10Top makelaar 👌heel erg blij mee Ik zou aanraden om deze makelaar te kiesen Heel vriendelijk en goed georganiseerd
-
Onyx 57
9Translated by AIThe contact went well. After each viewing, kept properly informed and room for discussion. If there was something you didn't or exactly wanted, that happened.
-
't Meijmerige Land 34
9Translated by AIThe contact with the real estate agent went very smoothly. During the negotiations, he gave good and expert advice.
-
Melksloot 20
9Translated by AIFine real estate agent who gave expert advice during the sale and applied the right tactics to make the sale run smoothly
-
Molengroet 1 643a
9Translated by AIThought along very well, was positive and enthusiastic. Pleasant treatment, from all the staff.! Definitely worth recommending.
-
Wielsloot 12
8Translated by AITop! We are very satisfied, their initial and door lopenden support is characteristic of the three times we have used them.
-
Regelhaalder 7
9Translated by AITop real estate agent! The sale of the property went smoothly and quickly. Friendly and professional people at van de Ridder