Vrijdag & De Bekker Makelaardij en Hypotheekwinkel
"Real Estate Agency & Mortgage Broker under one roof!"

Friday & De Bekker Real Estate and Mortgage Service offers an integrated approach to sales, purchases, and mortgage advice. With an experienced team and a well-thought-out strategy, we ensure that your home stands out to potential buyers. Our mortgage service compares providers and seeks the most advantageous option for you. We advise you personally and accompany you from the first contact to the completion of the transaction. Our offic...
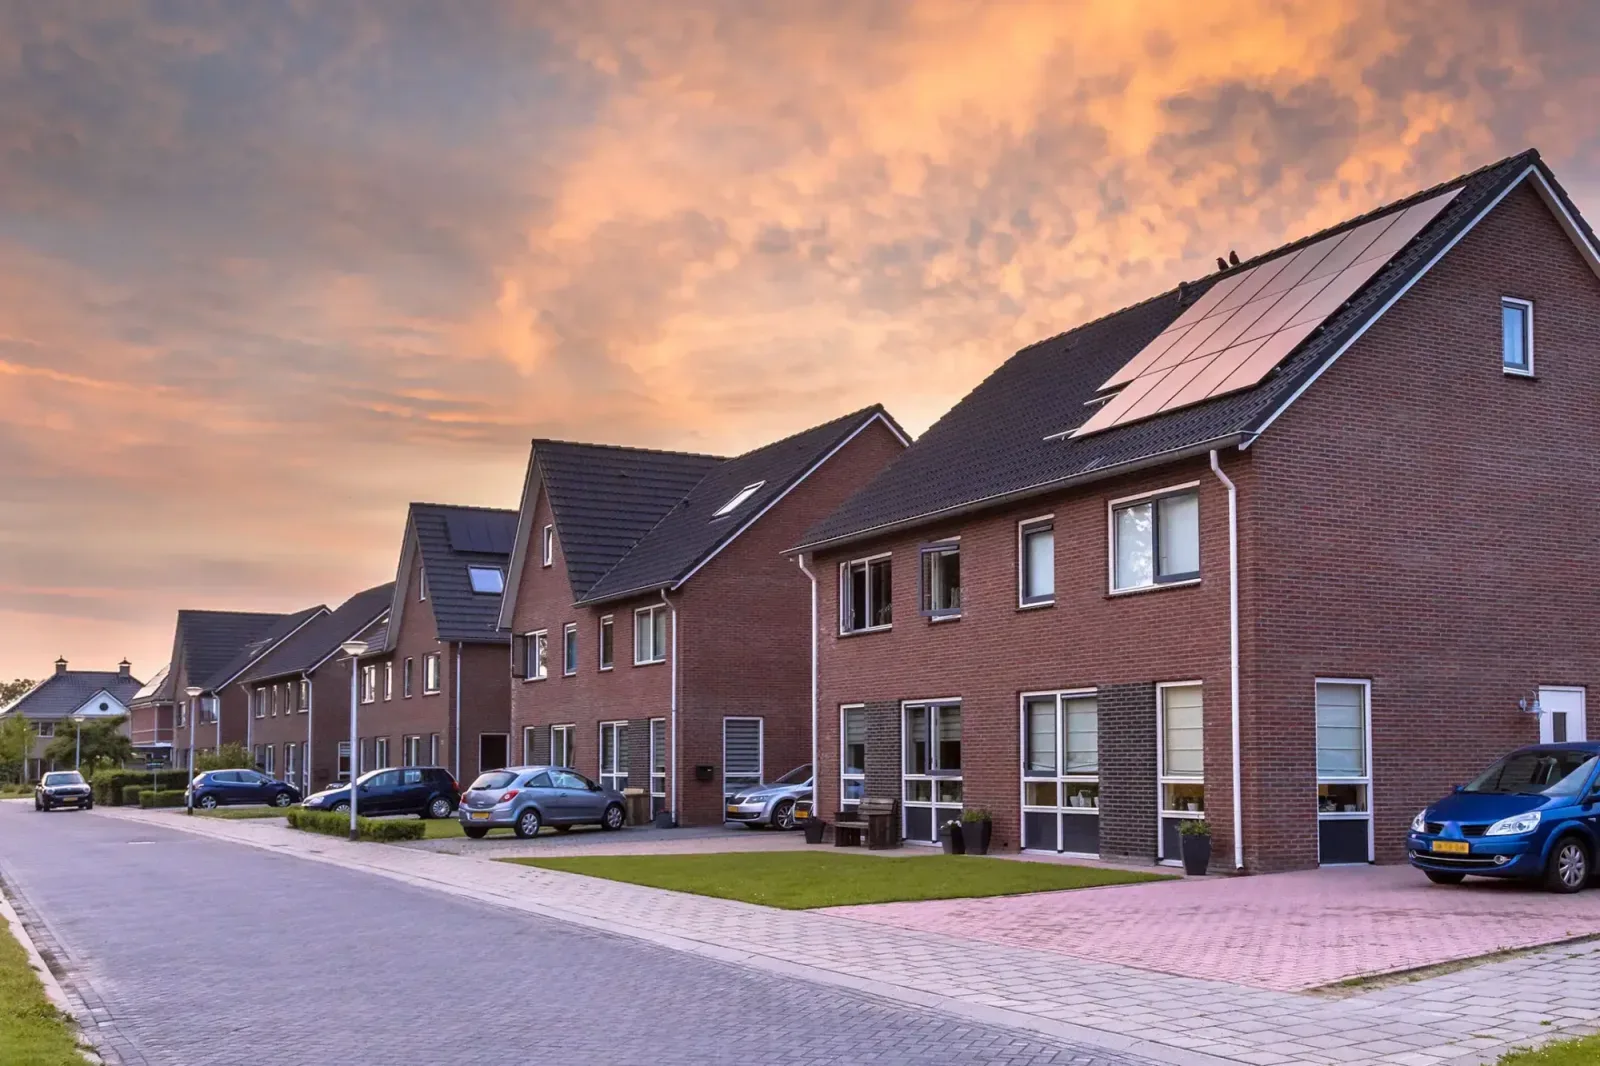
Current housing stock
-

- Available
Adriaen Brouwerstraat 15
5831VJ Boxmeer
€ 295.000 k.k.
€ 2.185/m²
CSave as favorite- Living area
- 135 m²
- Land area
- 173 m²
- Bedrooms
- 4
-

- Available
Vrijstraat 5
5846AG Ledeacker
€ 1.150.000 k.k.
€ 2.979/m²
ASave as favorite- Living area
- 386 m²
- Land area
- 11195 m²
- Bedrooms
- 7
-

- Available
Kijkuitspad 1
5443AG Haps
€ 925.000 k.k.
€ 4.973/m²
CSave as favorite- Living area
- 186 m²
- Land area
- 11200 m²
- Bedrooms
- 4
-

- Available
Jan Mostaertstraat 4
5831VB Boxmeer
€ 395.000 k.k.
ASave as favorite- Living area
- 117 m²
- Land area
- 172 m²
- Bedrooms
- 4
-

- Available
Sijs 4
5831NJ Boxmeer
€ 399.500 k.k.
€ 3.841/m²
BSave as favorite- Living area
- 104 m²
- Land area
- 207 m²
- Bedrooms
- 4
-

- Purchased
Dullert 99
6852MC Huissen
€ 475.000 k.k.
€ 3.740/m²
ASave as favorite- Living area
- 127 m²
- Land area
- 164 m²
- Bedrooms
- 4
Reviews (101)
Review platforms
BronscoresTotal score
101 total reviews

Funda
39 reviews on Funda

62 reviews on Google
-
Dullert 99
10Persoonlijk contact, erg vriendelijk en kundig. Zeer tevreden. Wij zouden deze makelaar zeker aanraden.
-
van Speyk 45
10Wij zijn erg tevreden geweest met de begeleiding van vrijdag en de Bekker! De communicatie verliep goed en soepel, zowel via de mail als bellen. De makelaar kon ons geruststellen waar nodig.
-
Irma Belksma
10Wij kijken met een heel goed gevoel terug op onze samenwerking met Vrijdag & De Bekker. Vanaf het eerste contactmoment zijn we prettig en professioneel geholpen. Er werd echt de tijd genomen om onze situatie te begrijpen en alles duidelijk uit te leggen, waardoor we meteen vertrouwen hadden in het proces. De communicatie was duidelijk, laagdrempelig en snel, wat erg prettig werkte in een periode waarin alles voor ons behoorlijk ingewikkeld was. We konden met al onze vragen altijd terecht en werden steeds netjes en rustig geholpen. Kortom: betrokken, meedenkende en betrouwbare die ons uitstekend heeft begeleid van begin tot eind.
-
Willem Oolthuis
10Vanuit makelaardij en hypotheek winkel Vrijdag & De Bekker hebben Stefan en Gert Jan ons heel goed geholpen. We hebben een fijne woning gevonden zonder stress. En ook mooie lage maandlasten. Dat heeft de hypotheek adviseur goed geregeld. Ik zou iedereen aanbevelen zaken te doen met dit fijne kantoor.
-
Lsf H
2Een absolute teleurstelling. Onze ervaring staat haaks met wat wij hoopte met het inschakelen van goede begeleiding met betrekking tot een hypotheek aanvraag. Los van de hoge kosten. Hebben wij enorm veel stress rondom de aanvraag van de hypotheek ervaren. Niet of nauwelijks bereikbaar en de mail(s) werden beantwoord door een collega maar wel onder Gert - Jan’s naam. Chaos. Kortom doe jezelf een groot genoegen en sla deze zaak over. Edit 24 mei 2026. Het antwoord vanuit de firma Vrijdag & De Bekker gaat het doel voorbij en onderstreept alleen maar mijn eerdere ervaring. Er was geen frustratie en ook geen teleurstelling. Het was gewoon regelrecht een ramp. Een hypotheek aanvragen is rechtdoor zee. Wij hebben gekozen om een premium te betalen voor een adviseur. Eentje die echt voor je klaar staat. Persoonlijk en meedenkend. Wat betreft bereikbaarheid zie ik al dat het een welles nietes verhaal wordt. Maar uit mijn ervaring waren jullie moeilijk tot niet te bereiken. Dat jullie je niet (h)erkennen dat het echt moeizaam is gegaan is jammer. De stress van de aankoop was helemaal niet nodig en berust puur op jullie slechte service. De rest van het aankoop process ging namelijk spoedig en duidelijk. We hopen dat toekomstige klanten een betere dienstverlening mogen ervaren.
-
Lisa
10Vanaf dag één erg fijn geholpen bij de aankoop van een huis. Een erg betrokken team wat ons door het hele traject heen helpt. Daarnaast ook gemakkelijk contact mee te leggen en een persoonlijke benadering. We raden Vrijdag & de Bekker dan ook bij iedereen aan die op zoek is naar een woning in de omgeving.
-
Bono Arts
10Geert-Jan en Stefan hebben mij uitstekend begeleid bij de aankoop van mijn woning. Heldere uitleg, snelle reacties op vragen en altijd meedenkend. Hierdoor is het gehele traject soepel en fijn verlopen!
-
Sint Janskerkhof 75
10Translated by AIFine contact. Got to know my character well. Helped where needed was/is. Clear who to put in for what. (Real estate agent - buying advice/financial advice) Would have liked to sit around the table with everyone once at the beginning for a first introduction and to put a face to the name.
-
koen remijn
10We zijn vanaf het begin tot aan het eind super geholpen door Gert-Jan. We werden van elke stap op de hoogte gehouden en alles werd met ons gedeeld. Super!
-
Emile de Bruijn
10Al een aantal keren gebruik gemaakt van de diensten van Stefan Vrijdag. Stefan werkt open, transparant en snel. Daarnaast is het gewoon een fijne kerel om over de vloer te hebben.
-
Saltshof 1738
9Het contact verliep super. Voor ons de eerste keer kopen maar alles werd erg duidelijk uitgelegd. Zeker een aanrader!
-
Korhoenderveld 21
10Wij kochten eerst een huis via vrijdag & De Bekker om niet veel later ook ons huis via hun te verkopen. Geweldige service, korte lijntjes en ze denken overal aan. Ook als er iets is zijn ze snel bereikbaar en houden open en eerlijk communicatie. We zijn het hele team, vooral Joël erg dankbaar voor alles wat ze gedaan hebben.
-
Bas Jansen
10Stefan en Joël hebben ons super goed geholpen. Ze hebben keurige foto's en brochure (laten) maken, ons goede tips gegeven wat aan te passen en een onderbouwde waardebepaling gegeven. De opbrengst was, ondanks een plaatselijk wat verzadigde markt, boven verwachting. Super fijn. We zijn super tevreden.
-
Myrthe Giesbers
10Na de moeilijke beslissing om ons fijne huis te gaan verkopen was het voor ons vanzelfsprekend dat het team van Vrijdag en de Bekker dit zou gaan doen. We zijn al lang klant bij hun en ze hebben onze verwachting dan ook meer dan waar gemaakt. Het was een heel fijn verkoopproces waardoor ons huis dan ook snel verkocht was. Stefan , Joel en Gert-Jan super bedankt voor de fijne samenwerking
-
Anita
10Ik kreeg te maken met nieuw aanstormend talent bij vrijdag en de bekker. Mede dankzij zijn energieke aanpak en doorzettingsvermogen is mijn huis sneller verkocht dan verwacht, gewoon TOP! Ontzettend bedankt voor jullie inzet.
-
Nassaustraat 10
10Door de onderlinge samenwerking binnen het kantoor is alles voor ons geregeld, aankoop, verkoop en de hypotheek. De contacten waren hartelijk en als we ergens tegen aan liepen kregen we snel een adequaat antwoord. Ook op momenten dat we bezorgd waren, kregen we door positieve houding weer een goed gevoel dat het allemaal goed ging komen en dat is ook gebeurd.
-
Hendrikstraat 23
10Contact verliep erg fijn. Heel persoonlijk en goed contact! Staan altijd klaar! Erg deskundig en als het nodig is word alles in Jip en Janneke taal uitgelegd! Alles verliep erg soepel en fijn
-
Adriaen Brouwerstraat 36
10Snelle en duidelijke communicatie. Al meerdere malen de hulp van Vrijdag en de Bekker ingeschakeld wetende dat altijd alles goed geregeld wordt.
-
Den Berk 18
9Stefan en Joël hebben ons super goed geholpen. Ze hebben keurige foto's en brochure (laten) maken, ons goed tips gegeven wat aan te passen en een onderbouwde waardebepaling gegeven. De opbrengst was, ondanks een plaatselijk wat verzadigde markt, boven verwachting. Super fijn. We zijn super tevreden.
-
Laageindsedijk 21
10We hebben een heel fijn verkoopproces gehad met het team van Vrijdag en de Bekker. Zeer deskundig en veel kennis van de markt. Hierdoor is ons fijne huis snel verkocht