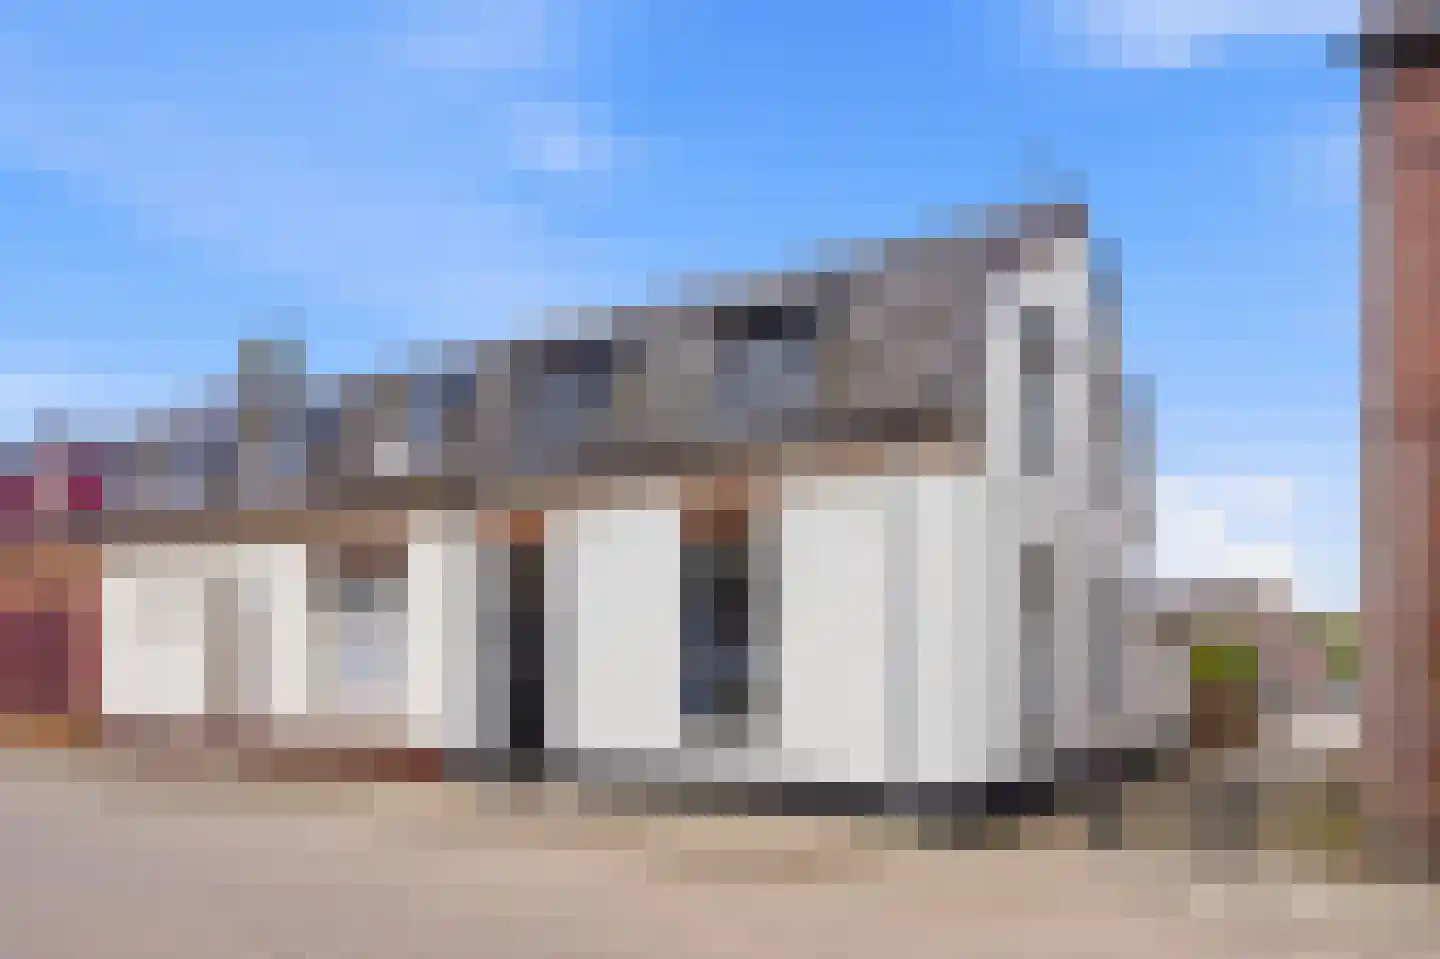
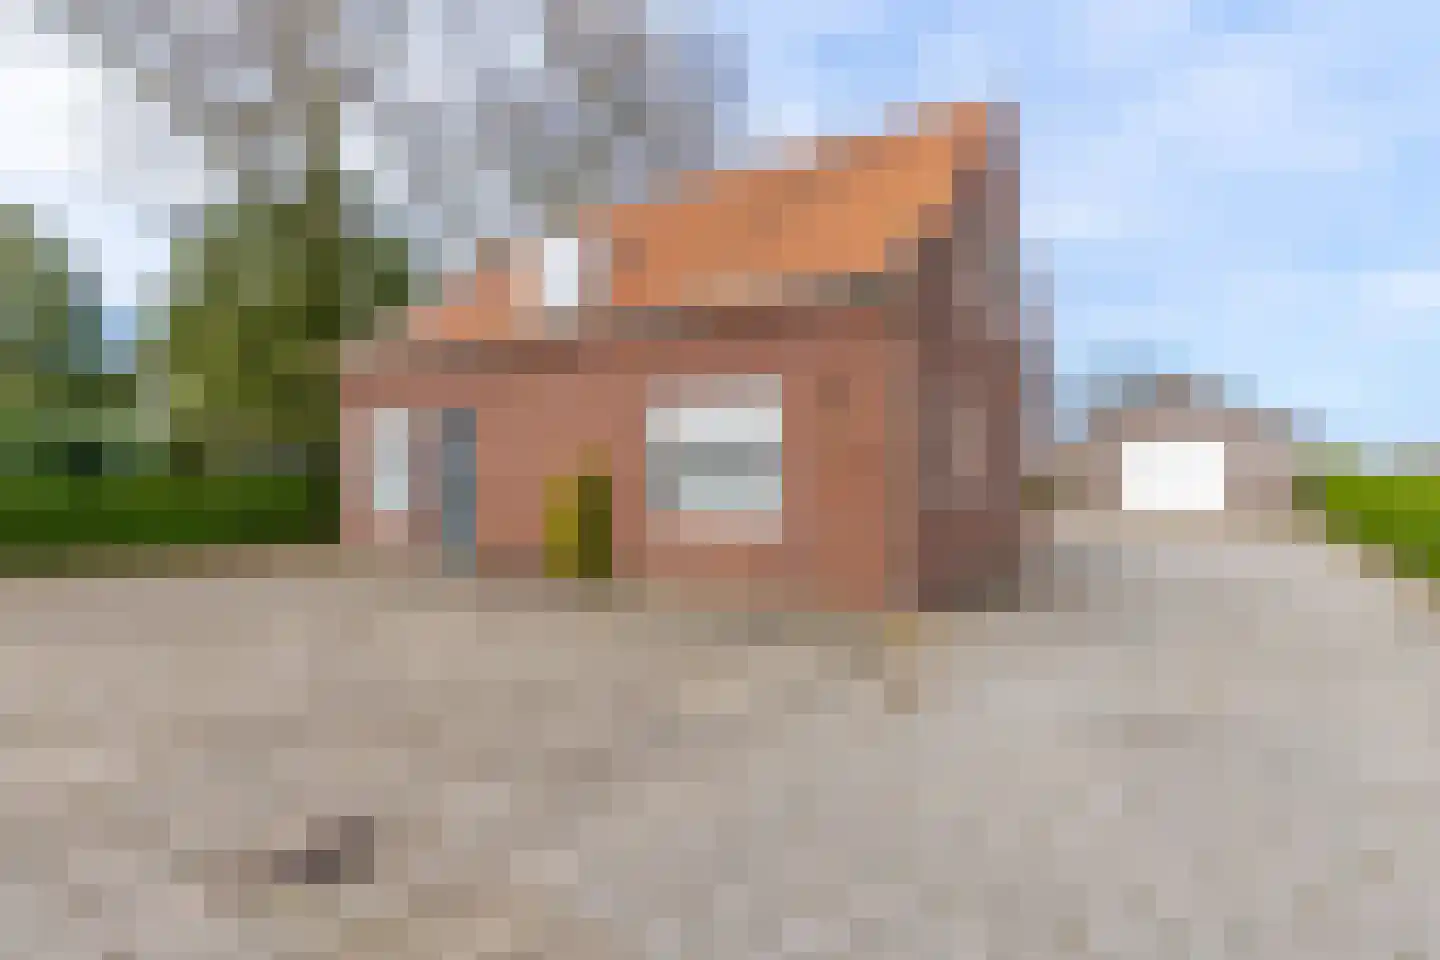
- Available
Vrijthof 4
5821BG Vierlingsbeek
€ 389.000 k.k.
€ 2.969/m²
- Living area
- 131 m²
- Land area
- 450 m²
- Bedrooms
- 4
Searching in 21 houses in Vierlingsbeek
Type to search. Use arrow down and arrow up to navigate through results and press Enter to open.
Hidden search suggestions.
View current properties in Vierlingsbeek or search targeted on street, postal code and property characteristics.
View the current housing stock in Vierlingsbeek and quickly filter by price, living area, rooms and more. There are currently 21 houses in this place within our selection. View also 10 sold houses in Vierlingsbeek for extra insight into the local housing market.
5821BG Vierlingsbeek
€ 389.000 k.k.
€ 2.969/m²
5821AG Vierlingsbeek
€ 425.000 k.k.
€ 3.761/m²
5821GB Vierlingsbeek
€ 369.000 k.k.
€ 4.193/m²
5821AA Vierlingsbeek
€ 550.000 k.k.
€ 3.793/m²
5821GB Vierlingsbeek
€ 425.000 k.k.
€ 3.542/m²
5821CN Vierlingsbeek
€ 445.000 k.k.
€ 3.027/m²
5821AM Vierlingsbeek
€ 645.000 k.k.
€ 4.388/m²
5821BN Vierlingsbeek
€ 325.000 k.k.
€ 2.851/m²
5821AG Vierlingsbeek
€ 649.000 k.k.
€ 2.693/m²
5821EJ Vierlingsbeek
€ 1.295.000 k.k.
€ 3.754/m²
5821AX Vierlingsbeek
€ 385.000 k.k.
€ 3.565/m²
5821GE Vierlingsbeek
€ 525.000 k.k.
€ 3.523/m²
5821BJ Vierlingsbeek
€ 459.000 k.k.
€ 3.701/m²
5821CC Vierlingsbeek
€ 325.000 k.k.
€ 3.186/m²
5821GG Vierlingsbeek
€ 575.000 k.k.
€ 4.166/m²
5821BM Vierlingsbeek
€ 400.000 k.k.
€ 3.809/m²
5821BL Vierlingsbeek
€ 500.000 k.k.
€ 3.355/m²
5821BE Vierlingsbeek
€ 395.000 k.k.
€ 2.025/m²
5821AJ Vierlingsbeek
€ 375.000 k.k.
€ 2.819/m²
5821AE Vierlingsbeek
€ 645.000 k.k.
€ 2.480/m²
5821AB Vierlingsbeek
€ 699.000 k.k.
€ 4.368/m²
Get free quotes from real estate agents with local market knowledge. Compare more than 16 real estate agents in Vierlingsbeek.
Selling a home in Vierlingsbeek? Compare all real estate agents in Vierlingsbeek or view the top 10 real estate agents in Vierlingsbeek for extra context for your choice.
Real estate agents make sharper offers when they know you're comparing — ask for quotes for sale or purchase.
Practical answers about housing supply, sales and comparing real estate agents in Vierlingsbeek.
The costs of a real estate agent in Vierlingsbeek depend on commission, setup costs, property presentation and the chosen service. Compare the 16 real estate agents in Vierlingsbeek via the real estate agent page and request multiple quotes to compare rates and approach well.
Within our selection, we are currently showing 21 houses in Vierlingsbeek. View also the sold houses in Vierlingsbeek to compare the current offering with recent transactions.
Take into account not only price and living area but also maintenance, energy label, location, outdoor space and sales status. This way you compare houses in Vierlingsbeek on more than just the asking price.
A local real estate agent knows the neighborhoods, recent transactions and demand in Vierlingsbeek. By comparing 16 real estate agents in the region you get a better insight into prices, sales strategy and expected yield; the top 10 in Vierlingsbeek provides a useful starting point.
Yes, when making a sales plan, a valuation in Vierlingsbeek is wise. You gain insight into a realistic asking price and can then compare offers from real estate agents specifically.
View current location data on residents, WOZ development, housing stock, energy consumption, business activity and safety in Vierlingsbeek. In 2025 were there 2.625 residents. The average WOZ value in 2025 is EUR 370.000.
These figures help to better assess and compare the housing stock in Vierlingsbeek with recent sold homes. Orient yourself then on suitable top real estate agents in Vierlingsbeek for sales advice in this region.
Residents
2.625
Last year: 2025
Average WOZ
EUR 370.000
Last year: 2025
Average income per person.
EUR 34.300
Source: AllNumbers
Crimes (current year)
74
Total registered
| Year | Residents |
|---|---|
| 2021 | 2.537 |
| 2022 | 2.540 |
| 2023 | 2.575 |
| 2024 | 2.605 |
| 2025 | 2.625 |
| Year | Average WOZ |
|---|---|
| 2021 | EUR 274.000 |
| 2022 | EUR 285.000 |
| 2023 | EUR 328.000 |
| 2024 | EUR 355.000 |
| 2025 | EUR 370.000 |
Hoger
590
Praktisch
410
Middelbaar
990
Europa
150
Nederland
2.410
Buiten Europa
65
Label C
333
Label A
175
Label B
151
Label D
141
Label F
108
Label E
53
Label G
47
Label A+++
25
Label A+
17
Label A++
13
Label A++++
0
Label A+++++
0
| Year | Gas (m3) | Electricity (kWh) |
|---|---|---|
| 2020 | 1.460 | 3.440 |
| 2021 | 1.670 | 3.480 |
| 2022 | 1.260 | 3.160 |
| 2023 | 1.020 | 3.000 |
| 2024 | 980 | 3.050 |
Hoekwoning
Gas: 860 • Electricity: 2.430
Huurwoning
Gas: 750 • Electricity: 1.920
Koopwoning
Gas: 1.100 • Electricity: 3.330
Appartement
Gas: 640 • Electricity: 1.960
Tussenwoning
Gas: 820 • Electricity: 2.410
Vrijstaande woning
Gas: 1.290 • Electricity: 3.780
Twee-onder-één-kap woning
Gas: 960 • Electricity: 2.790
Total number of company establishments: 300
| Period | Crimes |
|---|---|
| jan 2025 | 2 |
| jan 2026 | 5 |
| jul 2025 | 7 |
| jun 2025 | 12 |
| mei 2025 | 9 |
| mrt 2025 | 8 |
| nov 2024 | 4 |
| nov 2025 | 6 |
| okt 2024 | 14 |
| okt 2025 | 1 |
| sep 2024 | 8 |
| sep 2025 | 1 |
These figures give an indicative picture of safety trends in the living environment of Vierlingsbeek.
Short answers based on current local statistics, handy for a quick comparison of the living environment.
Vierlingsbeek telt in 2025 ongeveer 2.625 inwoners.
De gemiddelde WOZ-waarde in Vierlingsbeek is in 2025 circa € 370.000.
Het gemiddelde inkomen per inwoner in Vierlingsbeek ligt rond € 34.300 per jaar.
Voor het huidige jaar gaat het om ongeveer 74 geregistreerde misdrijven. Gebruik deze cijfers als indicatie en vergelijk trends per periode.
In Vierlingsbeek komt vooral "Twee-onder-één-kap woningen" veel voor, met ongeveer 425 woningen.