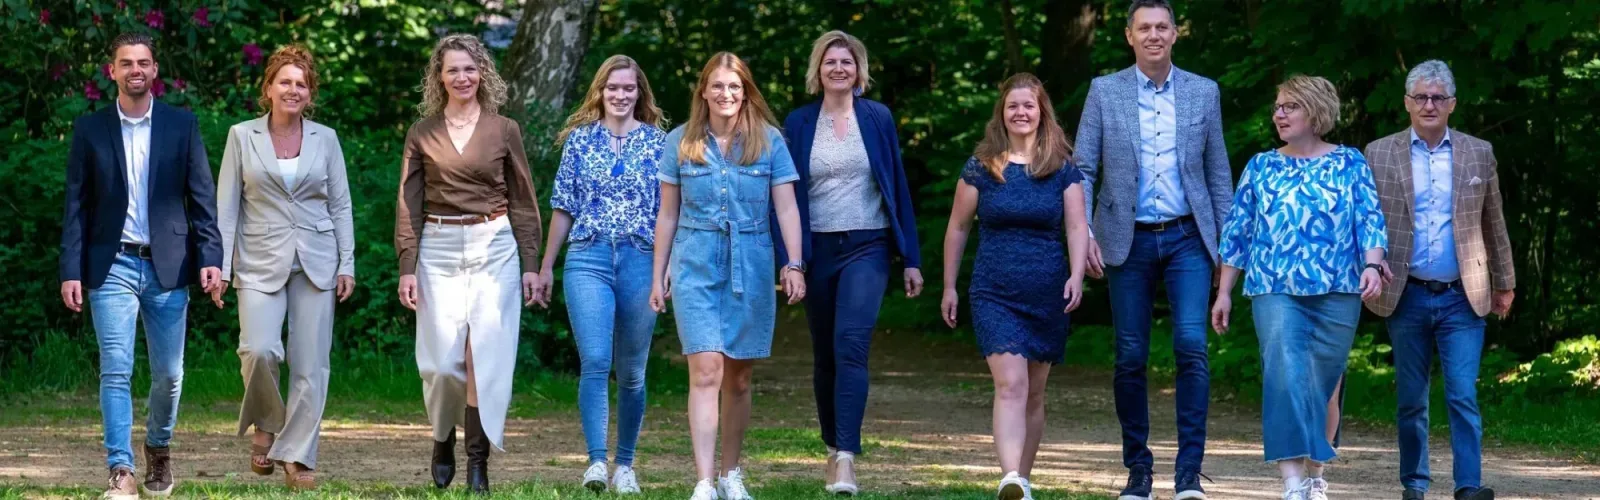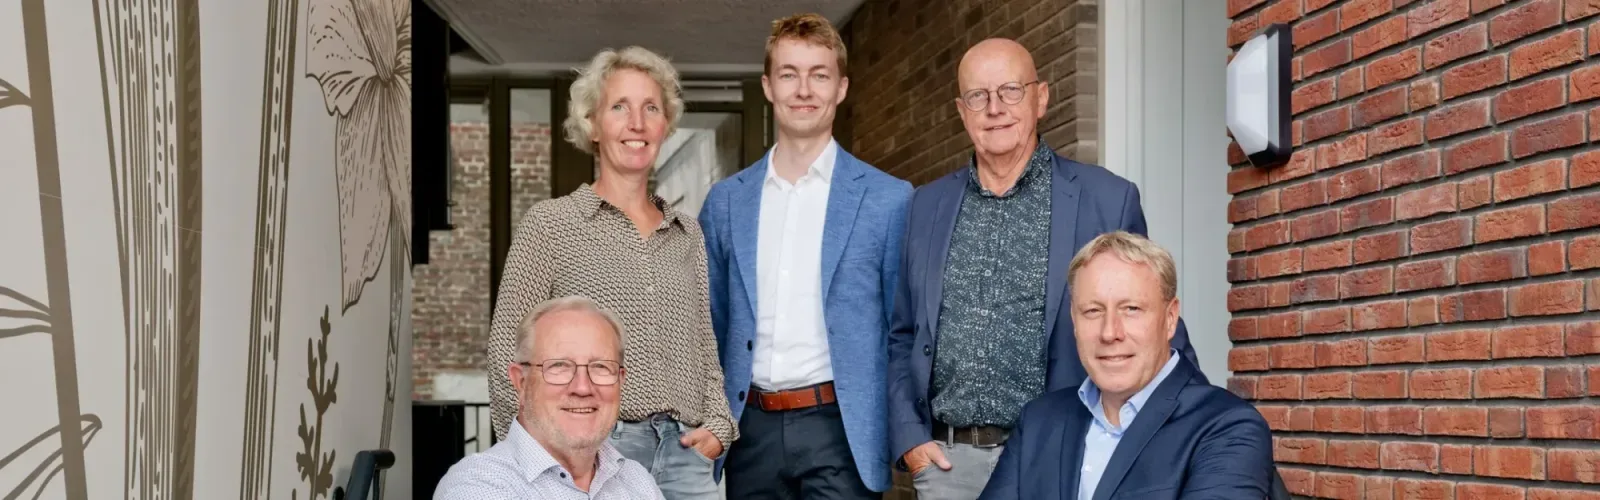

Sinds 1986 staat RGO Makelaars Winterswijk voor betrouwbare en persoonlijke begeleiding bij de koop, verkoop of huur van een woning. Met jarenlange ervaring op de lokale markt in Winterswijk en de Achterhoek weten wij precies hoe de woningmarkt in deze regio werkt. Onze klanten staan centraal, en we nemen de tijd om hun wensen te begrijpen en hen stap voor stap te begeleiden. Onze duidelijke communicatie en vaste contactpersonen zorgen...
Current housing stock
-
- Available
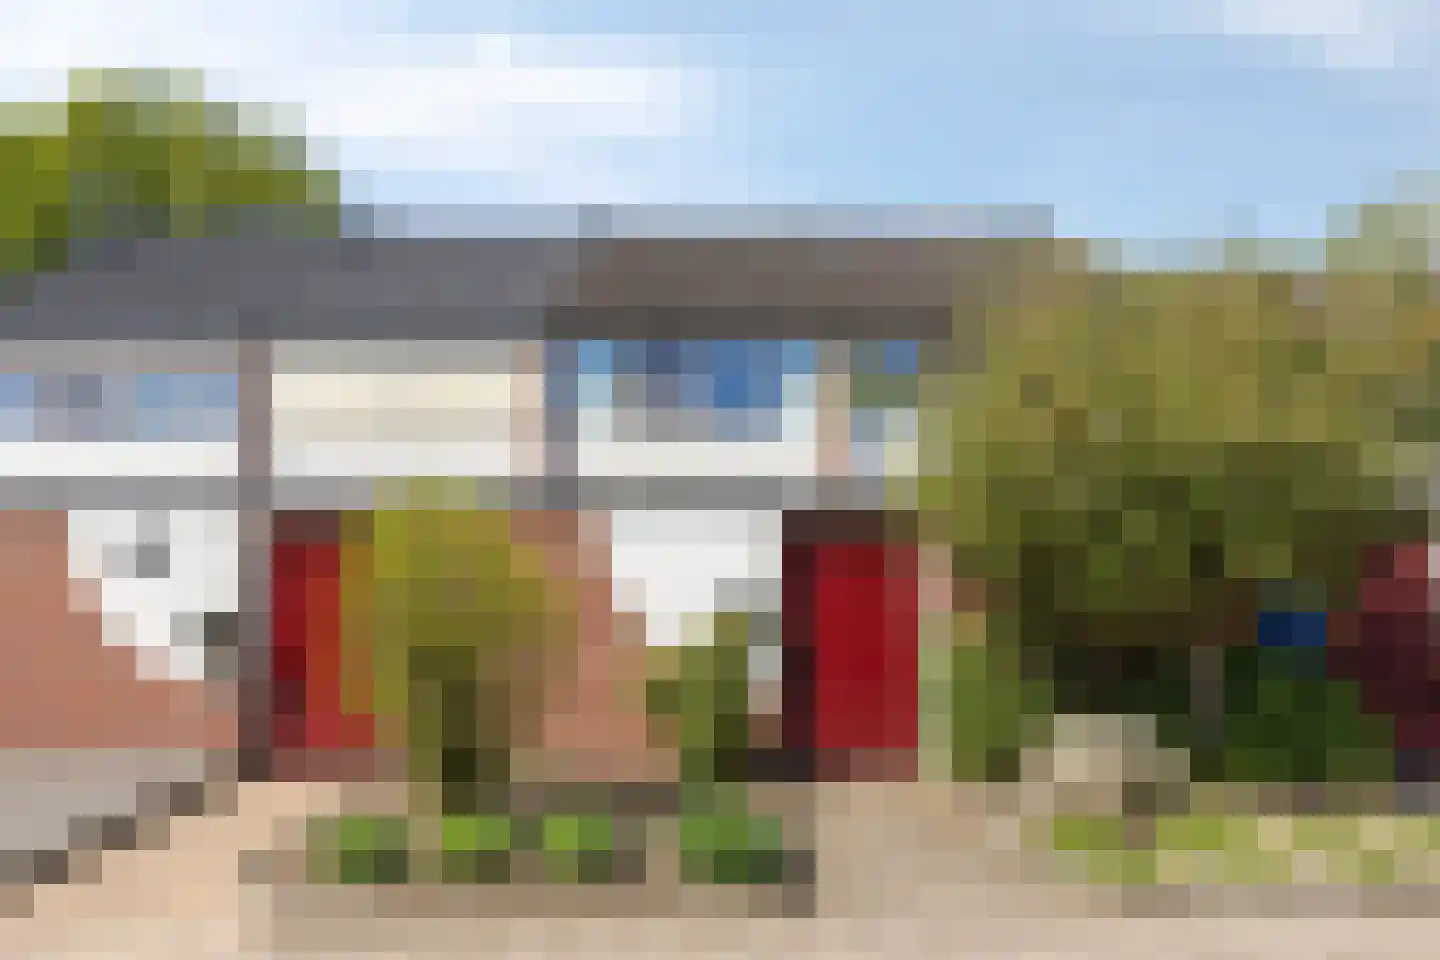
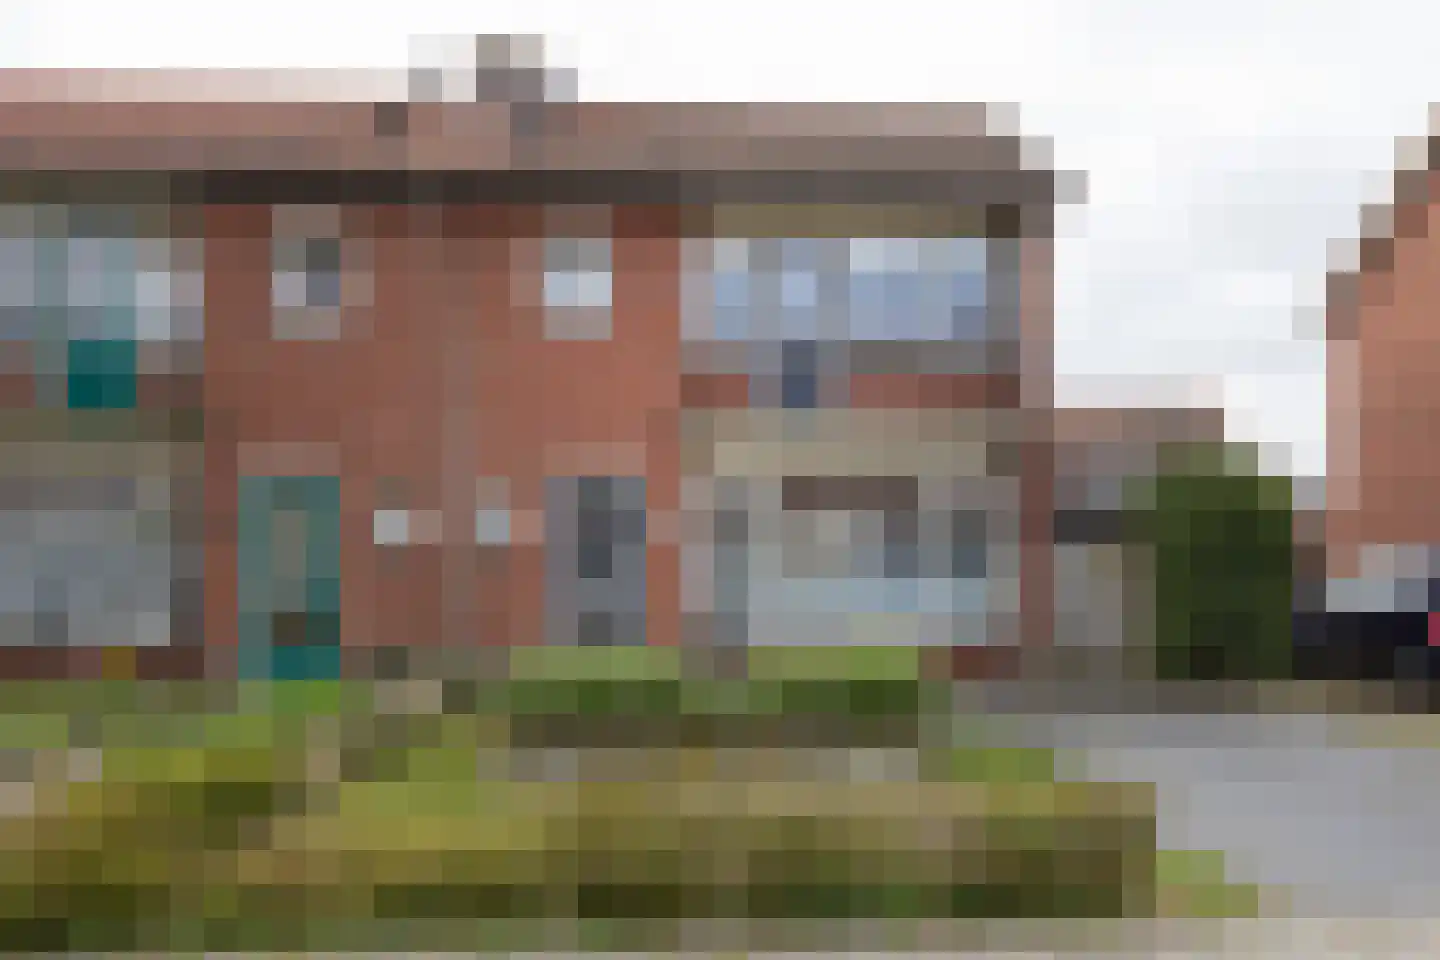
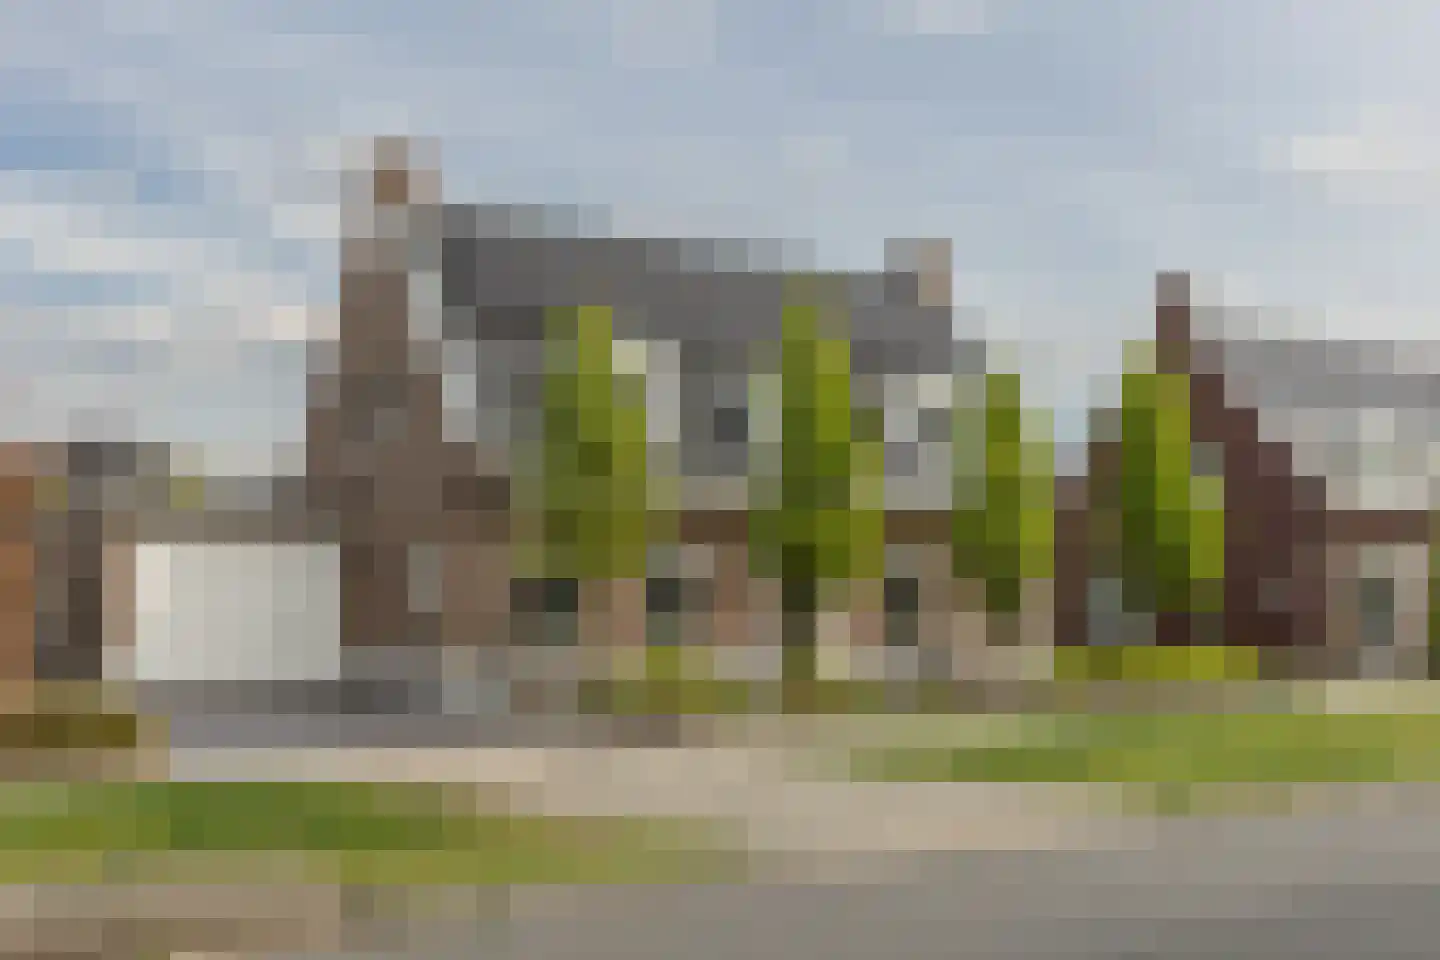
Misterweg 69
7102BG Winterswijk
€ 298.000 k.k.
€ 2.685/m²
FSave as favorite- Living area
- 111 m²
- Land area
- 120 m²
- Bedrooms
- 4
-
- Available
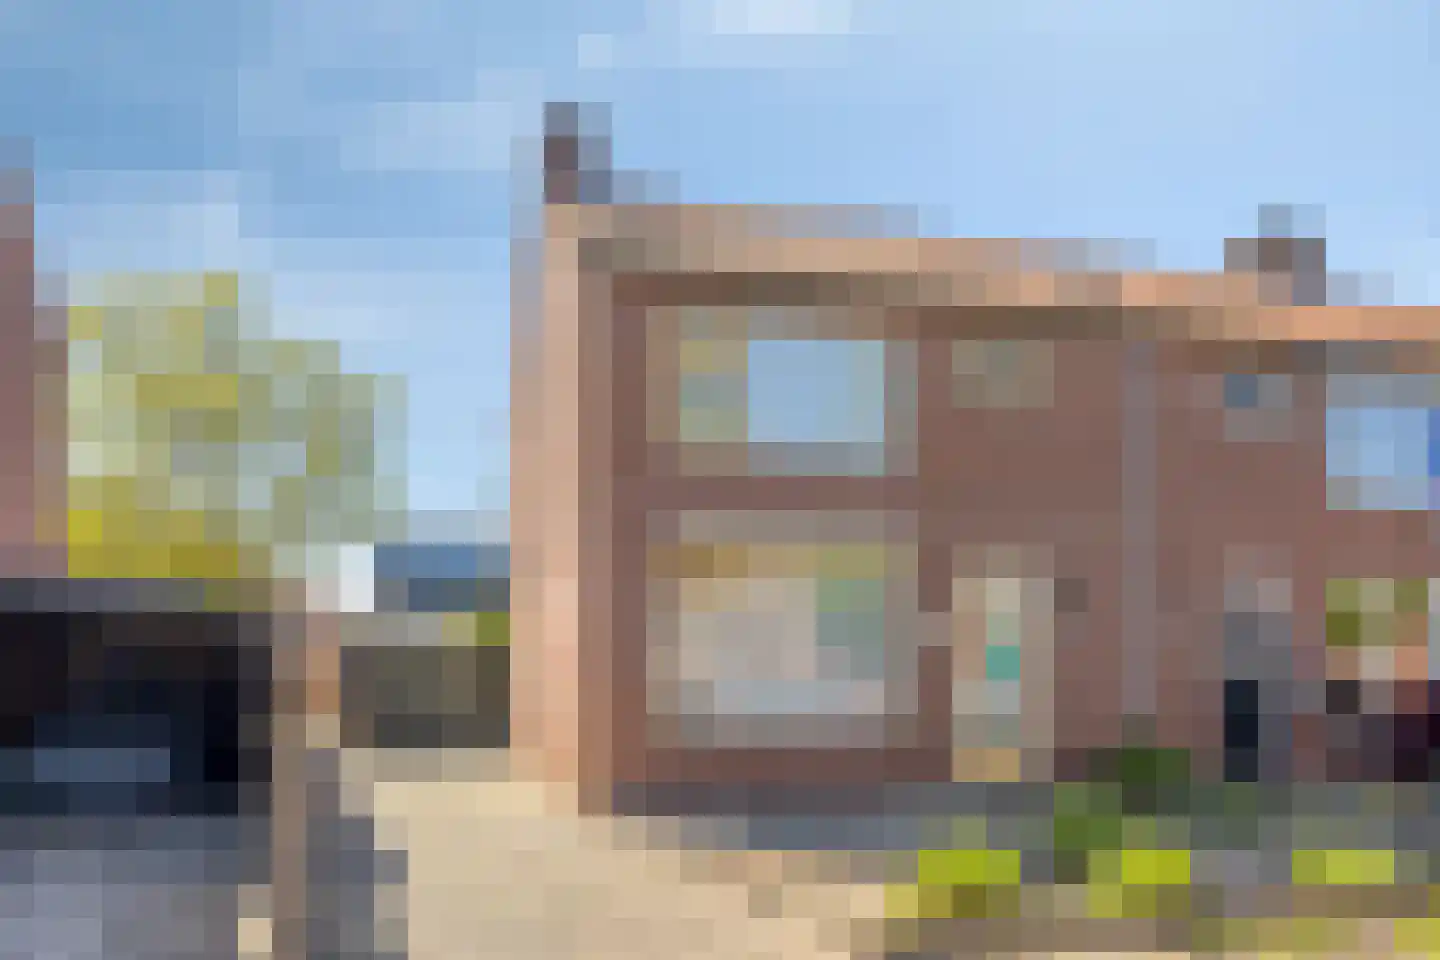
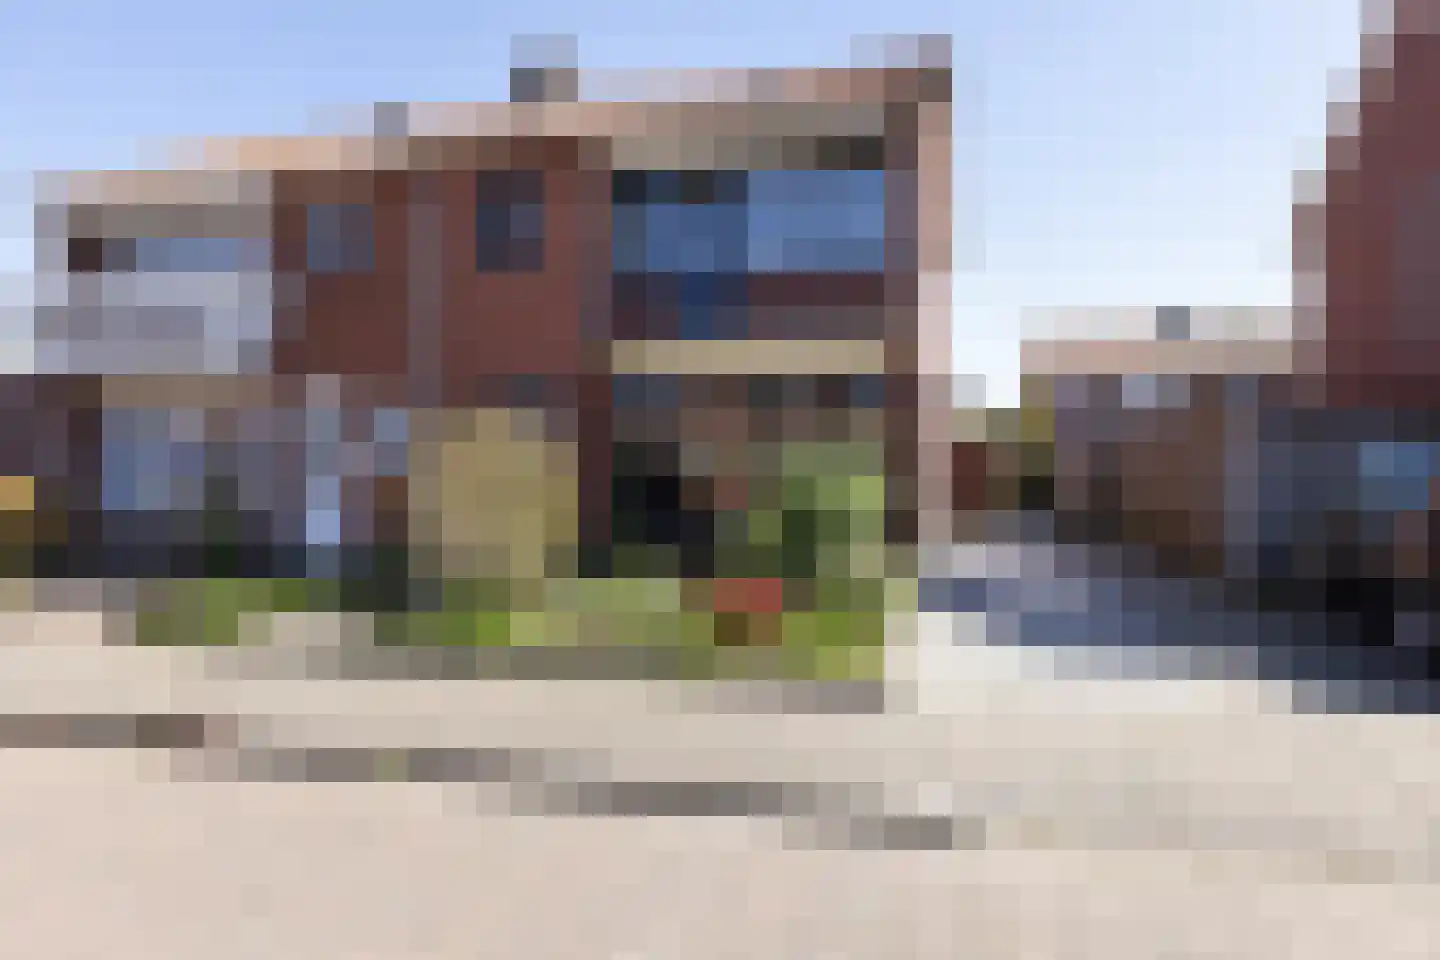
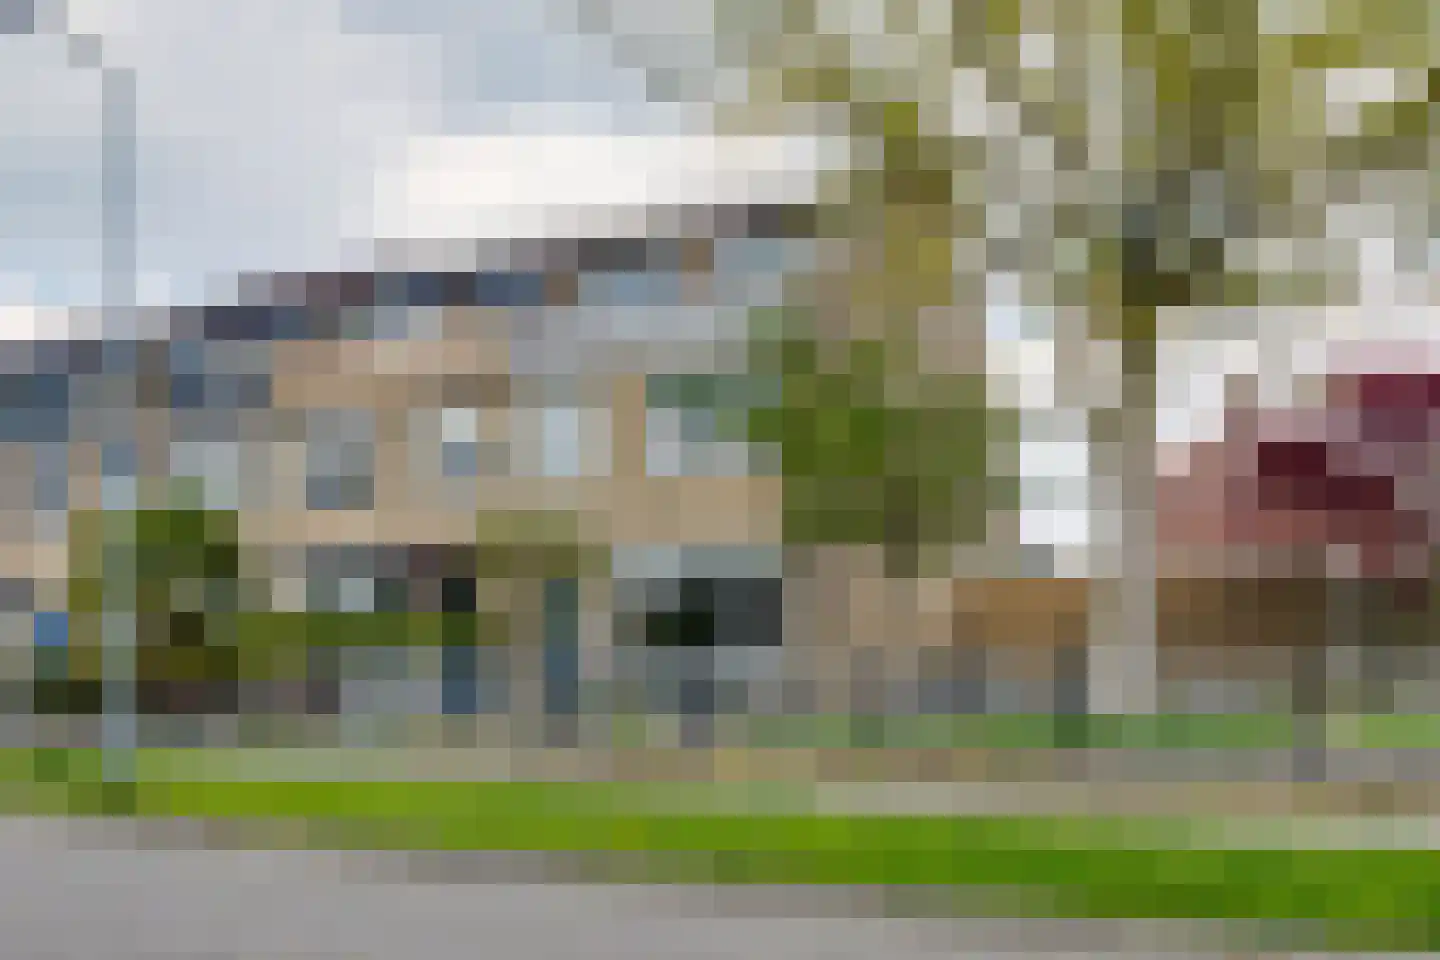
Albert Schweitzerlaan 48
7101JW Winterswijk
€ 524.000 k.k.
€ 3.541/m²
CSave as favorite- Living area
- 148 m²
- Land area
- 629 m²
- Bedrooms
- 4
-
- Available
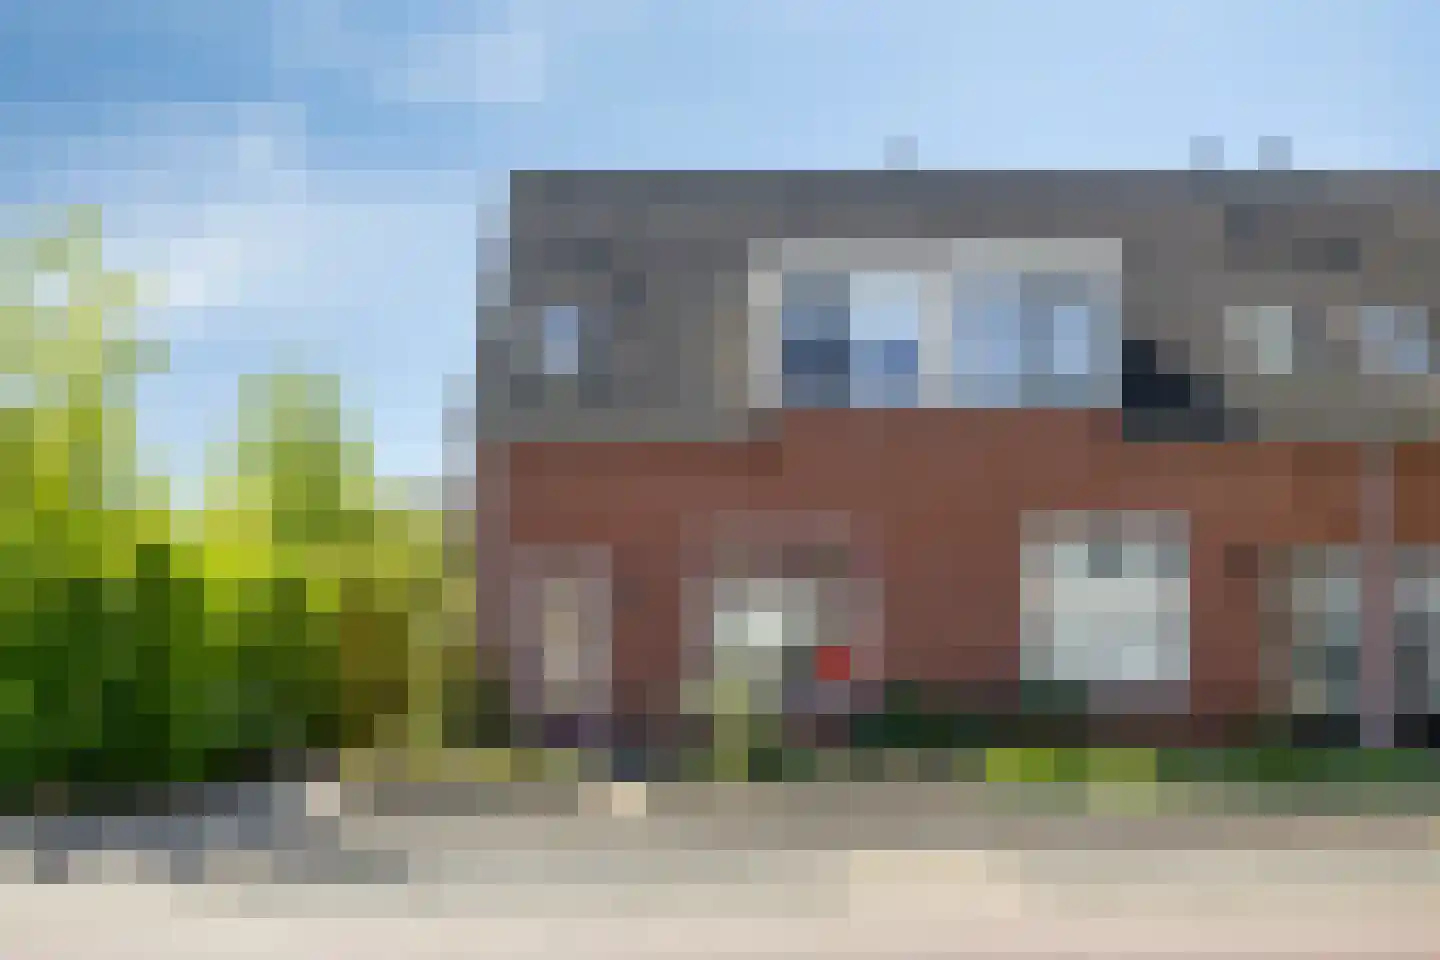
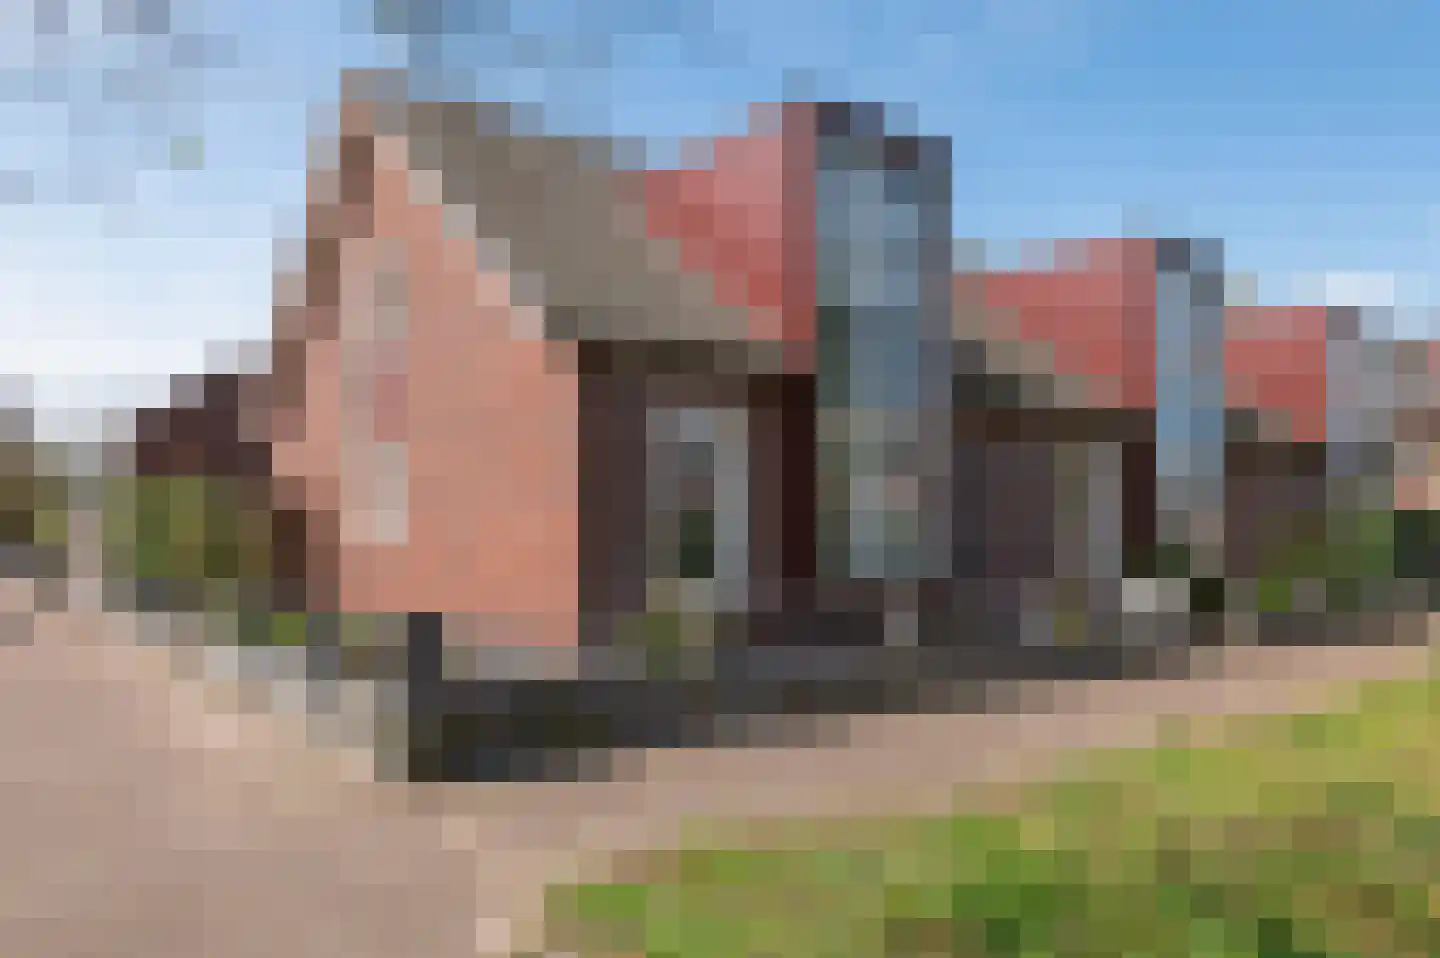
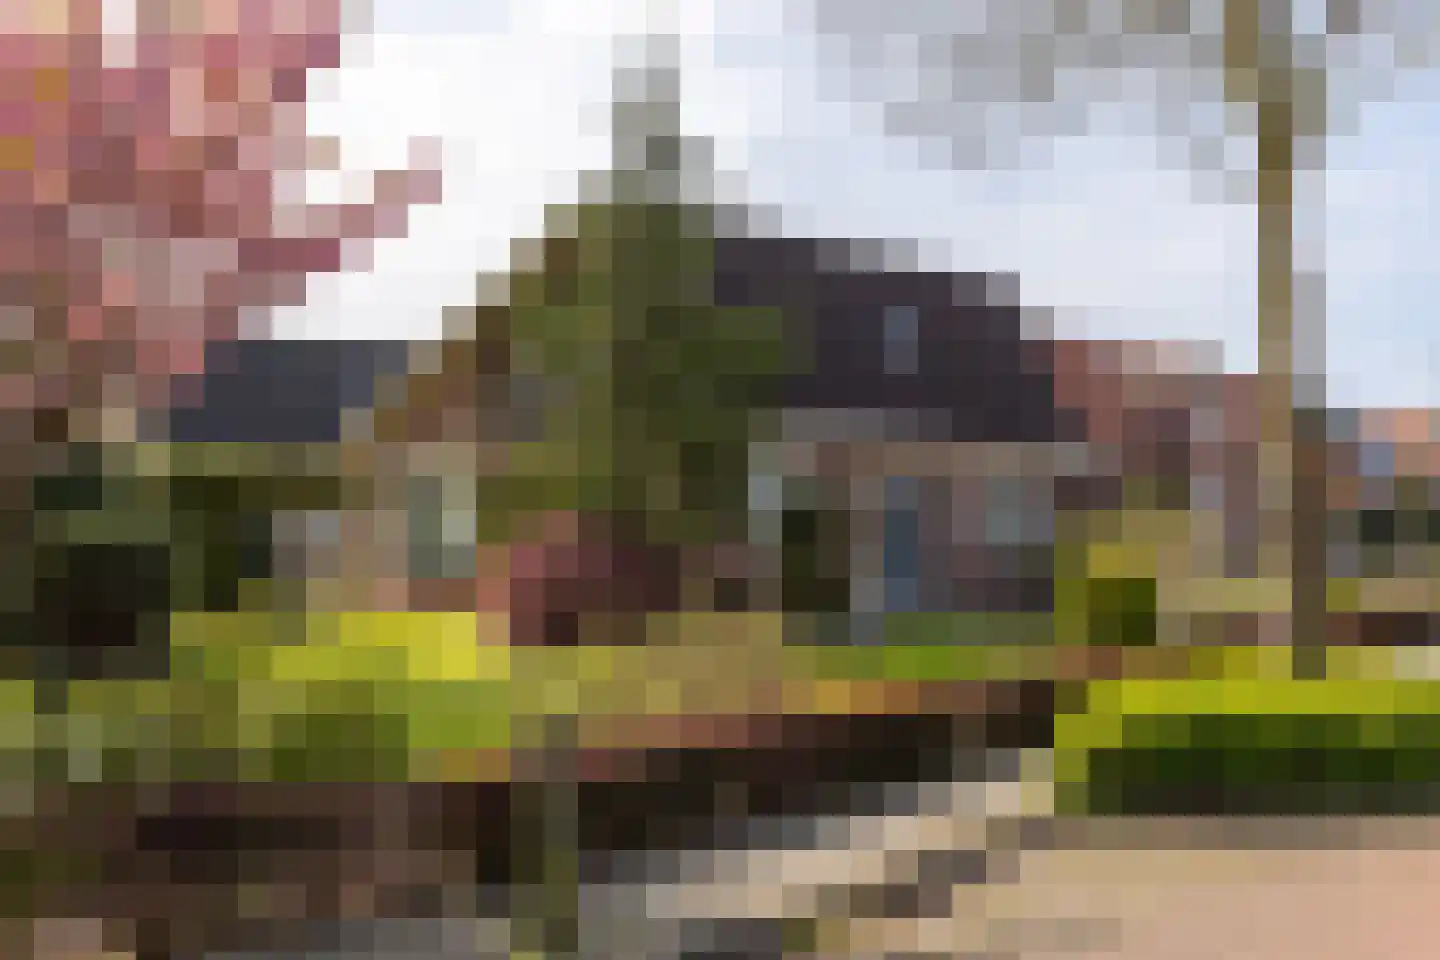
Leugemorsweg 1
7151ML Eibergen
€ 824.000 k.k.
€ 3.391/m²
ESave as favorite- Living area
- 243 m²
- Land area
- 3345 m²
- Bedrooms
- 3
-
- Available
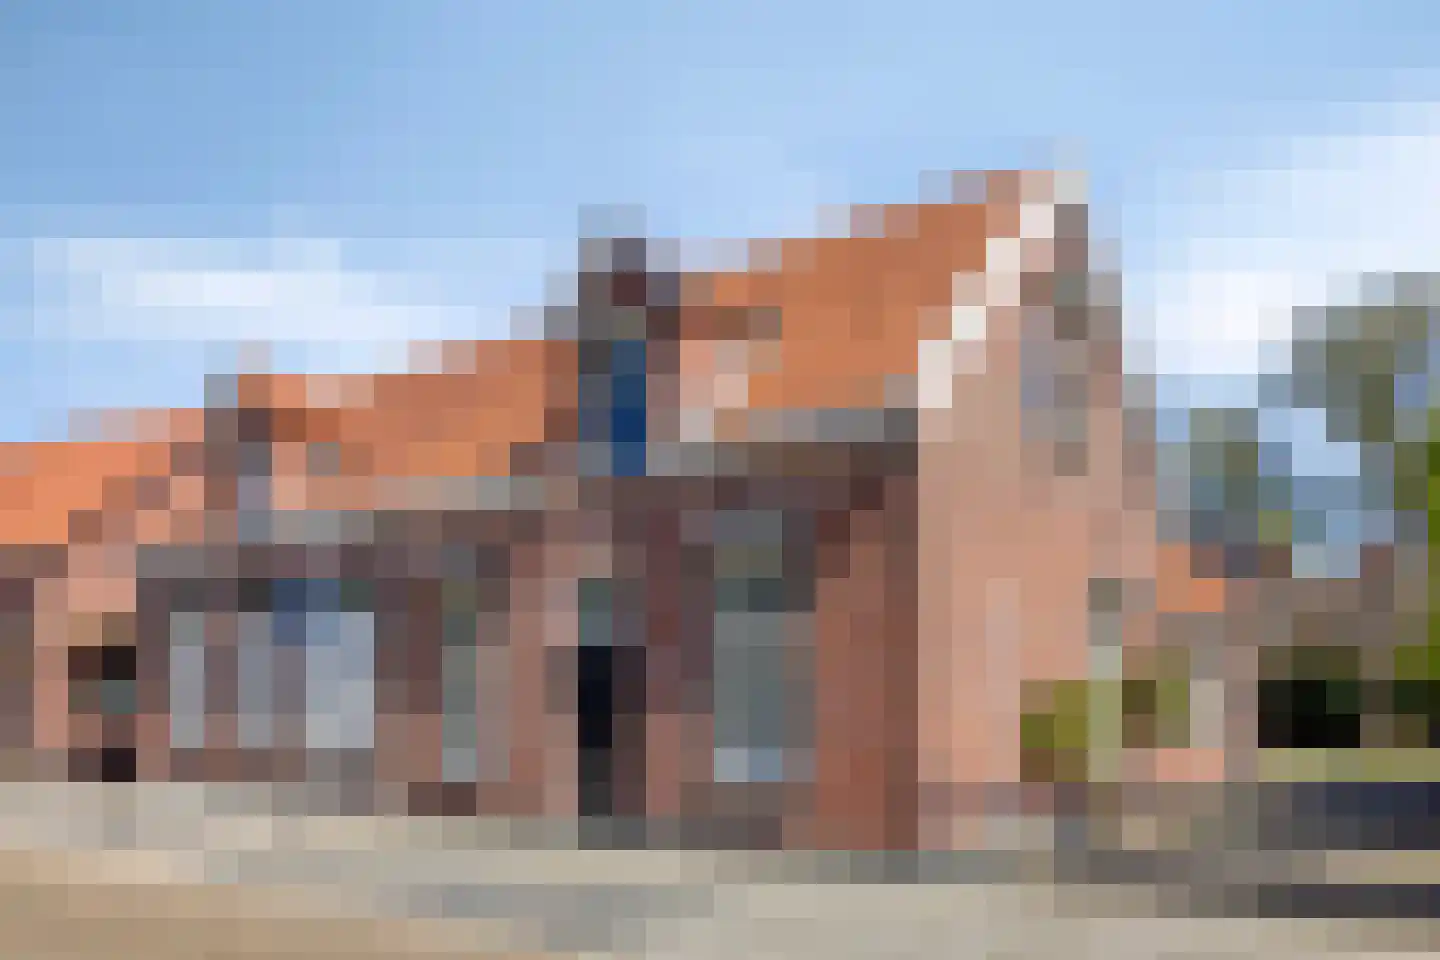
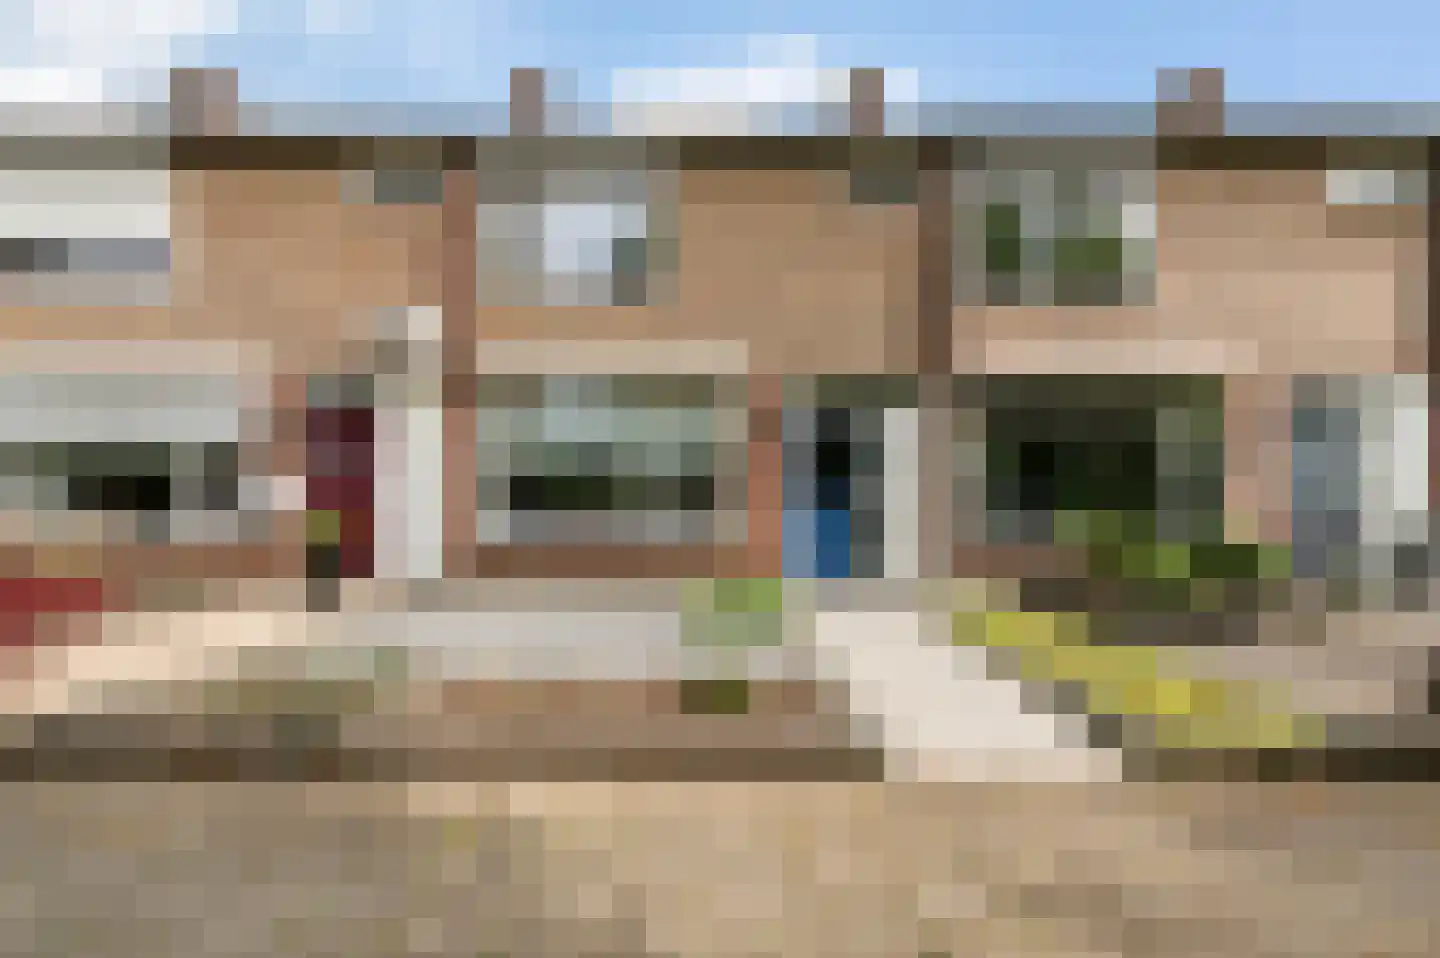
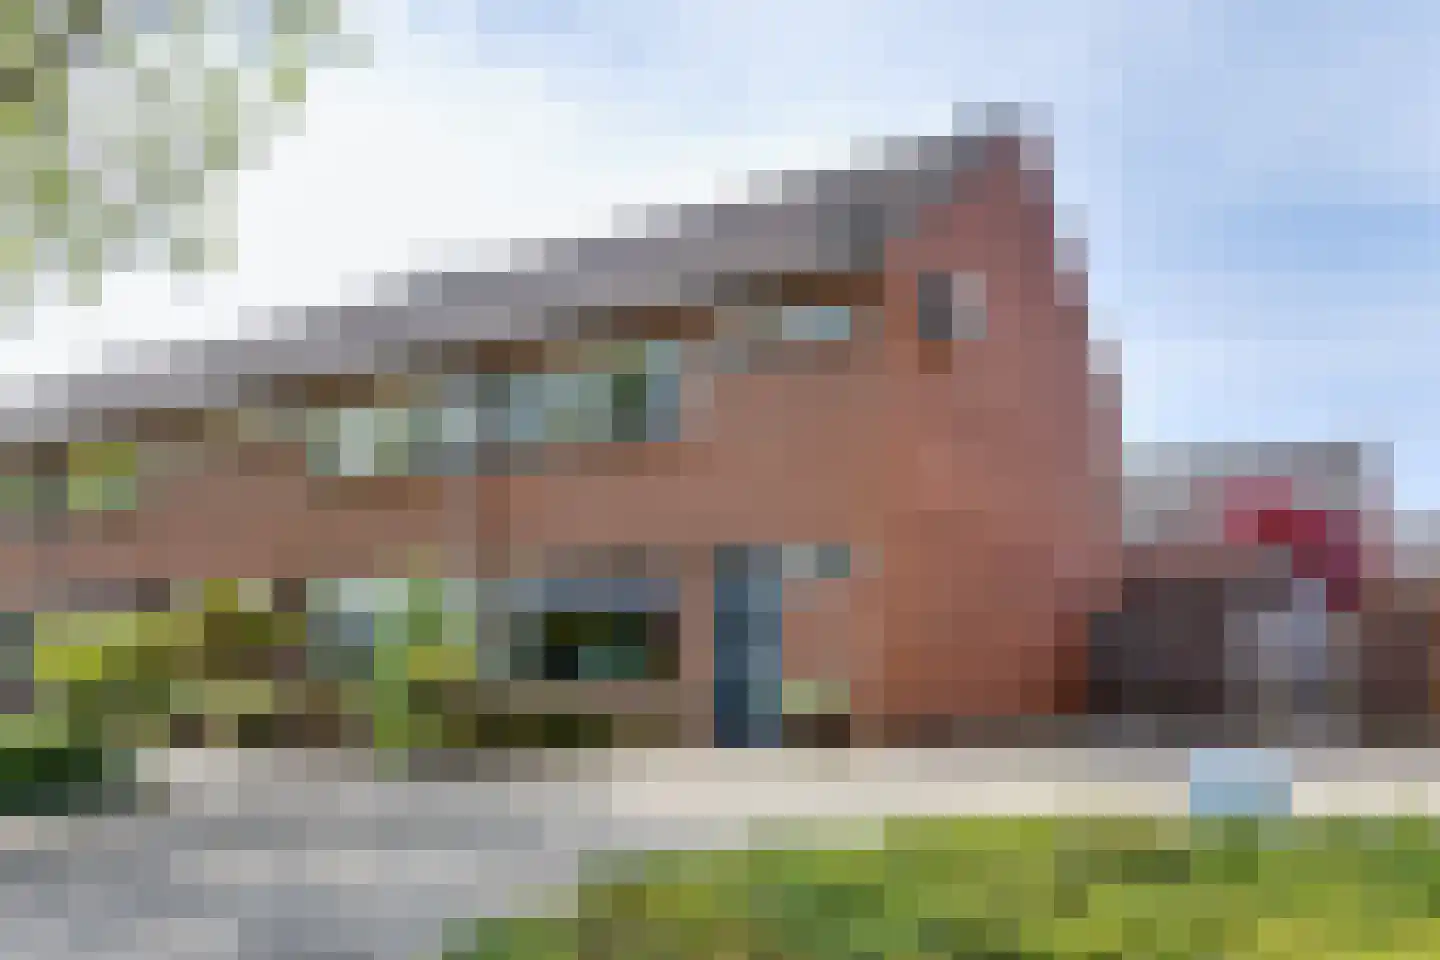
Churchillstraat 4
7136MB Zieuwent
€ 475.000 k.k.
€ 3.105/m²
CSave as favorite- Living area
- 153 m²
- Land area
- 800 m²
- Bedrooms
- 3
-
- Available
Prins Hendrikstraat 8
7101CL Winterswijk
€ 239.000 k.k.
€ 2.464/m²
GSave as favorite- Living area
- 97 m²
- Land area
- —
- Bedrooms
- 2
-
- Available
Veenweg 5
7107BB Winterswijk Kotten
€ 749.000 k.k.
€ 4.960/m²
CSave as favorite- Living area
- 151 m²
- Land area
- 5165 m²
- Bedrooms
- 3
Reviews (9)
Review platforms
BronscoresTotal score
9 total reviews

9 reviews on Google
-
Sjanie Kraaij
10Translated by AITop realtor, made me feel at home!!!
-
Bjorn Pruijsers
10 -
Tom
2Translated by AIWe had a nice little house in mind on Vredenseweg, and it turned out afterwards, according to the owner, that there was asbestos on the roof! In the sales advertisement from RGO, it's nowhere visible noted...🙈 You'll be the buyer who finds out afterwards that thousands of euros are needed to remediate it! A reply saying I should call next time but I did that too regarding the question about the asbestos and I would be called back but that phone call still needs to come!! Regards
-
Tijn Bekke
10 -
Gerwinf
8 -
Patrik Vulic
10 -
Sander Wiggers
10 -
Shari Bartolini
10 -
Za3ror Zozo
2