- Sold
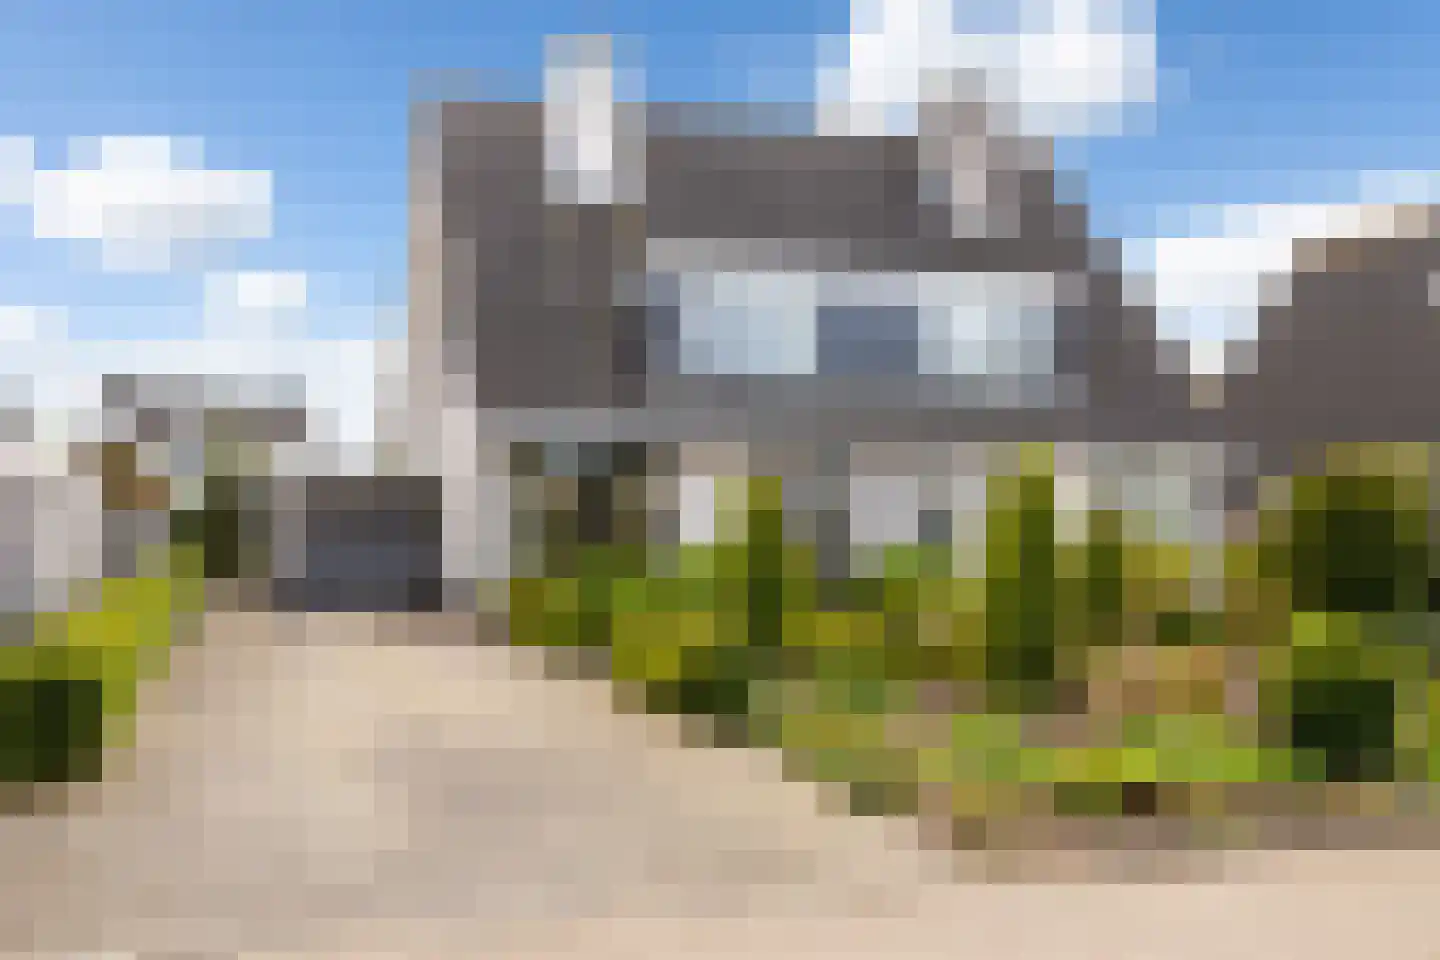
Burgemeester J.W. Hondelinkstraat 41
4153VC Beesd
€ 385.000 k.k.
€ 4.231/m²
- Living area
- 91 m²
- Land area
- 220 m²
- Bedrooms
- 4
View 29 sold houses in Beesd
Type to search. Use arrow down and arrow up to navigate through results and press Enter to open.
Hidden search suggestions.
Compare sold homes in Beesd or view the current offering in this location directly.
On this page you will find recently sold homes in Beesd. Use this overview to better estimate selling prices, popular neighborhoods, and the local housing supply before you choose a real estate agent. Also view the current housing supply with 41 houses in Beesd.
4153VC Beesd
€ 385.000 k.k.
€ 4.231/m²
4153CP Beesd
€ 650.000 k.k.
€ 4.643/m²
4153AG Beesd
€ 265.000 k.k.
€ 6.023/m²
4153XB Beesd
€ 595.000 k.k.
€ 6.010/m²
4153CL Beesd
€ 469.000 k.k.
€ 4.383/m²
4153CR Beesd
€ 600.000 k.k.
€ 3.896/m²
4153XV Beesd
€ 580.000 k.k.
€ 4.603/m²
4153VB Beesd
€ 455.000 k.k.
€ 3.922/m²
4153VK Beesd
€ 485.000 k.k.
€ 3.943/m²
4153AR Beesd
€ 460.000 k.k.
€ 3.709/m²
4153BT Beesd
€ 675.000 k.k.
€ 4.530/m²
4153AW Beesd
€ 575.000 k.k.
€ 1.898/m²
4153AT Beesd
€ 575.000 k.k.
€ 3.382/m²
4153VG Beesd
€ 359.000 k.k.
€ 4.917/m²
4153VL Beesd
€ 335.000 k.k.
€ 4.085/m²
4153XB Beesd
€ 919.000 k.k.
€ 3.996/m²
4153CC Beesd
€ 515.000 k.k.
€ 4.724/m²
4153CV Beesd
€ 465.000 k.k.
€ 4.043/m²
4153BC Beesd
€ 820.000 k.k.
€ 5.290/m²
4153XM Beesd
€ 575.000 k.k.
€ 4.956/m²
4153AJ Beesd
€ 329.000 k.k.
€ 4.838/m²
4153XT Beesd
€ 435.000 k.k.
€ 5.117/m²
4153BZ Beesd
€ 625.000 k.k.
€ 3.531/m²
4153VL Beesd
€ 330.000 k.k.
€ 4.024/m²
4153CM Beesd
€ 419.000 k.k.
€ 4.067/m²
4153AP Beesd
€ 395.000 k.k.
€ 3.691/m²
4153VD Beesd
€ 335.000 k.k.
€ 0/m²
4153BX Beesd
€ 479.000 k.k.
€ 4.650/m²
View recent sales and receive free quotes from local real estate agents. Compare more than 34 real estate agents in Beesd.
Selling your own home in Beesd? Compare real estate agents in Beesd or view the best real estate agents in Beesd as a reference for your choice.
Real estate agents make sharper offers when they know you're comparing — ask for quotes for sale or purchase.
Short answers about housing prices, sold homes and comparing real estate agents in Beesd.
The costs of a real estate agent in Beesd vary per office, property type and sales approach. In Beesd you can compare 34 real estate agents; therefore also look at the real estate agents in Beesd to better compare fees, presentation and local experience.
On this page we currently show 29 sold houses in Beesd from our selection. This helps you to better assess recent transactions and the local housing market.
Houses sold in Beesd give insight into asking prices, house types and neighborhoods where recent transactions have taken place. Compare this also with the current housing stock in Beesd to better understand the market.
You can use sold homes as a first market indication, but a local real estate agent can better take into account finishing, location, maintenance and current demand in Beesd.
Compare the 34 real estate agents in Beesd on local sales experience, reviews, expected yield, commission and marketing approach. View real estate agents in Beesd or the top 10 agents in Beesd to quickly discover strong offices.
View current location data on residents, WOZ development, housing stock, energy consumption, business activity and safety in Beesd. In 2025 were there 3.325 residents. The average WOZ value in 2025 is EUR 459.402.
These figures help to better assess and compare the housing stock in Beesd with recent sold homes. Orient yourself then on suitable top real estate agents in Beesd for sales advice in this region.
Residents
3.325
Last year: 2025
Average WOZ
EUR 459.402
Last year: 2025
Average income per person.
EUR 33.725
Source: AllNumbers
Crimes (current year)
210
Total registered
| Year | Residents |
|---|---|
| 2021 | 3.355 |
| 2022 | 3.345 |
| 2023 | 3.370 |
| 2024 | 3.375 |
| 2025 | 3.325 |
| Year | Average WOZ |
|---|---|
| 2021 | EUR 331.995 |
| 2022 | EUR 365.899 |
| 2023 | EUR 409.824 |
| 2024 | EUR 433.023 |
| 2025 | EUR 459.402 |
Hoger
460
Praktisch
750
Middelbaar
1.280
Europa
180
Nederland
2.995
Buiten Europa
145
Label C
434
Label B
283
Label A
208
Label G
151
Label D
140
Label F
95
Label E
61
Label A++
44
Label A+++
21
Label A+
20
Label A++++
2
Label A+++++
0
| Year | Gas (m3) | Electricity (kWh) |
|---|---|---|
| 2020 | 1.466 | 3.361 |
| 2021 | 1.609 | 3.422 |
| 2022 | 1.245 | 3.194 |
| 2023 | 1.035 | 2.982 |
| 2024 | 1.018 | 3.095 |
Hoekwoning
Gas: 869 • Electricity: 2.429
Huurwoning
Gas: 769 • Electricity: 2.090
Koopwoning
Gas: 1.147 • Electricity: 3.339
Appartement
Gas: 762 • Electricity: 2.051
Tussenwoning
Gas: 789 • Electricity: 2.185
Vrijstaande woning
Gas: 1.385 • Electricity: 3.854
Twee-onder-één-kap woning
Gas: 1.067 • Electricity: 3.447
Total number of company establishments: 650
| Period | Crimes |
|---|---|
| jan 2026 | 18 |
| jul 2025 | 16 |
| jun 2025 | 18 |
| mei 2025 | 20 |
| mrt 2025 | 16 |
| mrt 2026 | 17 |
| nov 2024 | 25 |
| nov 2025 | 18 |
| okt 2024 | 18 |
| okt 2025 | 14 |
| sep 2024 | 12 |
| sep 2025 | 10 |
These figures give an indicative picture of safety trends in the living environment of Beesd.
Short answers based on current local statistics, handy for a quick comparison of the living environment.
Beesd telt in 2025 ongeveer 3.325 inwoners.
De gemiddelde WOZ-waarde in Beesd is in 2025 circa € 459.402.
Het gemiddelde inkomen per inwoner in Beesd ligt rond € 33.725 per jaar.
Voor het huidige jaar gaat het om ongeveer 210 geregistreerde misdrijven. Gebruik deze cijfers als indicatie en vergelijk trends per periode.
In Beesd komt vooral "Vrijstaande woningen" veel voor, met ongeveer 437 woningen.