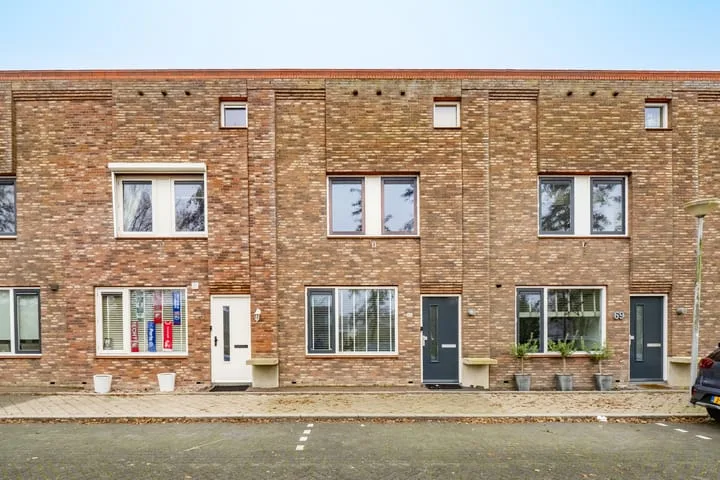
Houses sold in De Meern

View 220 sold houses in De Meern

Connected to: Vastgoed Nederland NVM Makelaars

On this page you will find recently sold homes in De Meern. Use this overview to better estimate selling prices, popular neighborhoods, and the local housing supply before you choose a real estate agent. Also view the current housing supply with 264 houses in De Meern.

Selection

Search and filter homes

Set your preferences and discover homes that suit you.

Total supply 240.696
Filters

Set price, area and other characteristics. Adjust a filter or click on Show homes. Location changes directly above.

Reset filters

You search for

  • Place De Meern
  • Status Sold

Selling a home in De Meern? Compare realtor offers

Get free quotes from realtors with local market knowledge in De Meern.

Free request a quote

  • Quotes in De Meern
  • Non-binding
  • Personal
  • Gratis tarieven vergelijken

Selling a home in De Meern? Compare real estate agents who know the local housing market. Also check out all real estate agents in De Meern or the top 10 real estate agents in De Meern for extra context for your choice.

Save an average of €5000,-

By comparing brokers and requesting quotes

Frequently asked questions about sold homes in De Meern

Short answers about housing prices, sold homes and comparing real estate agents in De Meern.

Residential and neighborhood statistics in De Meern

View current location data on residents, WOZ development, housing stock, energy consumption, business activity and safety in De Meern. In 2025 were there 22.040 residents. The average WOZ value in 2025 is EUR 578.098.

These figures help to better assess and compare the housing stock in De Meern with recent sold homes. Orient yourself then on suitable top real estate agents in De Meern for sales advice in this region.

Residents

22.040

Last year: 2025

Average WOZ

EUR 578.098

Last year: 2025

Average income per person.

EUR 39.181

Source: AllNumbers

Crimes (current year)

900

Total registered

Demographics and WOZ development

Inhabitants per year

Inhabitants per year in De Meern
Year Residents
2021 21.815
2022 21.825
2023 21.965
2024 21.980
2025 22.040

Annual WOZ value

WOZ value per year in De Meern
Year Average WOZ
2021 EUR 400.197
2022 EUR 447.015
2023 EUR 545.234
2024 EUR 536.126
2025 EUR 578.098

Composition of residents

Age build-up

65+: 3.165 0-15: 4.160 15-25: 3.035 25-45: 4.910 45-65: 6.770

Education level

Hoger

6.850

Praktisch

3.740

Middelbaar

5.530

Origin of residents (2025)

Europa

1.615

Nederland

15.565

Buiten Europa

4.865

Housing stock and construction periods

Types of homes

Hoekwoningen 1.555
Appartementen 1.286
Tussenwoningen 4.636
Vrijstaande woningen 641
Twee-onder-één-kap woningen 542

Construction period of buildings

Voor 1700 6
1700 tot 1900 71
1900 tot 1925 39
1925 tot 1950 174
1950 tot 1970 1.698
1970 tot 1980 592
1980 tot 1990 291
1990 tot 2000 2.512
2000 tot 2010 2.112
2010 tot 2020 314
2020 en later 206

Energy and sustainability

Energy label distribution

Label A

3.517

Label B

2.648

Label C

1.305

Label D

427

Label E

335

Label F

237

Label A+

212

Label G

177

Label A+++

127

Label A++

71

Label A++++

39

Label A+++++

4

Average energy consumption per year

Average energy consumption per year in De Meern
Year Gas (m3) Electricity (kWh)
2020 1.063 3.099
2021 1.213 3.175
2022 935 2.962
2023 810 2.756
2024 781 2.808

Consumption per house type

Hoekwoning

Gas: 892 • Electricity: 2.920

Huurwoning

Gas: 652 • Electricity: 2.003

Koopwoning

Gas: 869 • Electricity: 3.002

Appartement

Gas: 484 • Electricity: 1.810

Tussenwoning

Gas: 787 • Electricity: 2.649

Vrijstaande woning

Gas: 1.400 • Electricity: 4.762

Twee-onder-één-kap woning

Gas: 1.062 • Electricity: 3.374

Business activity in De Meern (2025)

Handel en HORECA 460
Nijverheid en energie 390
Zakelijke dienstverlening 1.035
Overheid, onderwijs en zorg 650
Landbouw, bosbouw en visserij 15
Vervoer, informatie en communicatie 360
Financiele diensten en onroerendgoed 180
Cultuur, recreatie en overige diensten 260

Total number of company establishments: 3.355

Recent crime statistics

Recent crime statistics in De Meern
Period Crimes
jan 2025 63
jan 2026 91
jul 2025 85
jun 2025 77
mei 2025 75
mrt 2025 74
nov 2024 94
nov 2025 93
okt 2024 92
okt 2025 76
sep 2024 61
sep 2025 71

These figures give an indicative picture of safety trends in the living environment of De Meern.

Frequently asked questions about living in De Meern

Short answers based on current local statistics, handy for a quick comparison of the living environment.

Hoeveel inwoners heeft De Meern?

De Meern telt in 2025 ongeveer 22.040 inwoners.

Wat is de gemiddelde WOZ-waarde in De Meern?

De gemiddelde WOZ-waarde in De Meern is in 2025 circa € 578.098.

Wat is het gemiddelde inkomen per inwoner in De Meern?

Het gemiddelde inkomen per inwoner in De Meern ligt rond € 39.181 per jaar.

Hoe veilig is wonen in De Meern?

Voor het huidige jaar gaat het om ongeveer 900 geregistreerde misdrijven. Gebruik deze cijfers als indicatie en vergelijk trends per periode.

Welke woningtypen komen het meest voor in De Meern?

In De Meern komt vooral "Tussenwoningen" veel voor, met ongeveer 4.636 woningen.

Gratis vrijblijvende offertes ontvangen

Vergelijk meerdere makelaars en kies de beste match.