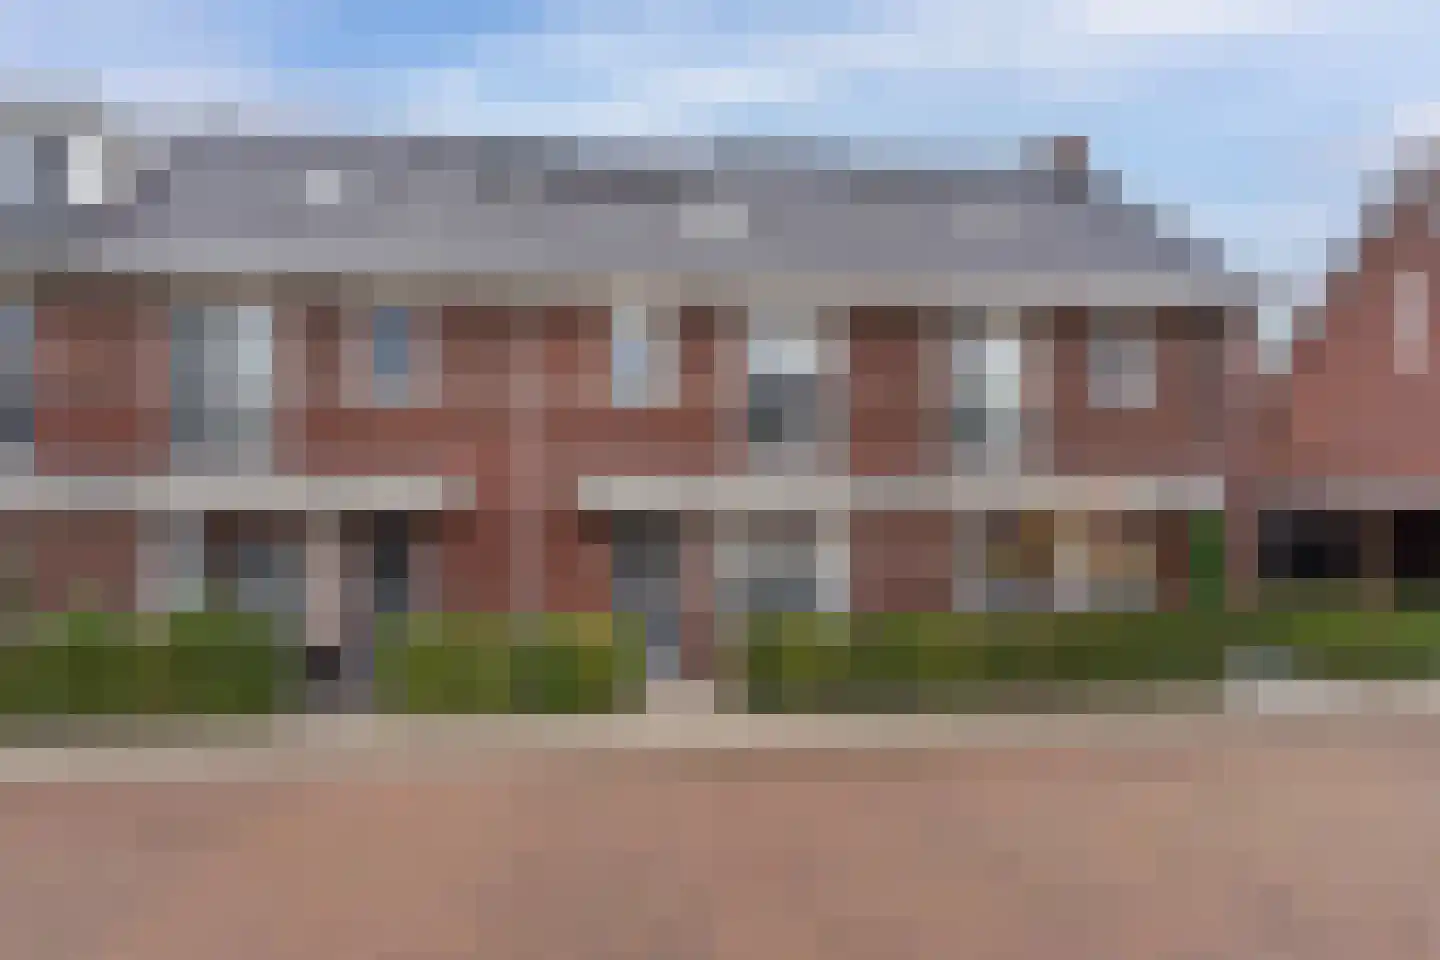
Houses sold in Den Dungen

View 45 sold houses in Den Dungen

Connected to: Vastgoed Nederland NVM Makelaars

On this page you will find recently sold homes in Den Dungen. Use this overview to better estimate selling prices, popular neighborhoods, and the local housing supply before you choose a real estate agent. Also view the current housing supply with 59 houses in Den Dungen.

Selection

Search and filter homes

Set your preferences and discover homes that suit you.

Total supply 241.821
Filters

Set price, area and other characteristics. Adjust a filter or click on Show homes. Location changes directly above.

Reset filters

You search for

  • Place Den Dungen
  • Status Sold

Sell your house in Den Dungen? Compare real estate agents

View recent sales and receive free quotes from local real estate agents. Compare more than 97 real estate agents in Den Dungen.

Free request a quote

  • Quotes in Den Dungen
  • Non-binding
  • Personal
  • Compare free rates

Selling your own home in Den Dungen? Compare real estate agents in Den Dungen or view the best real estate agents in Den Dungen as a reference for your choice.

Compare multiple quotes

Real estate agents make sharper offers when they know you're comparing — ask for quotes for sale or purchase.

Frequently asked questions about sold homes in Den Dungen

Short answers about housing prices, sold homes and comparing real estate agents in Den Dungen.

Residential and neighborhood statistics in Den Dungen

View current location data on residents, WOZ development, housing stock, energy consumption, business activity and safety in Den Dungen. In 2025 were there 4.886 residents. The average WOZ value in 2025 is EUR 506.142.

These figures help to better assess and compare the housing stock in Den Dungen with recent sold homes. Orient yourself then on suitable top real estate agents in Den Dungen for sales advice in this region.

Residents

4.886

Last year: 2025

Average WOZ

EUR 506.142

Last year: 2025

Average income per person.

EUR 29.826

Source: AllNumbers

Crimes (current year)

89

Total registered

Demographics and WOZ development

Inhabitants per year

Inhabitants per year in Den Dungen
Year Residents
2021 4.613
2022 4.702
2023 4.809
2024 4.888
2025 4.886

Annual WOZ value

WOZ value per year in Den Dungen
Year Average WOZ
2021 EUR 366.951
2022 EUR 401.290
2023 EUR 473.134
2024 EUR 477.414
2025 EUR 506.142

Composition of residents

Age build-up

65+: 1.057 0-15: 913 15-25: 419 25-45: 1.231 45-65: 1.252

Education level

Hoger

1.198

Praktisch

772

Middelbaar

1.378

Origin of residents (2025)

Europa

207

Nederland

4.424

Buiten Europa

250

Housing stock and construction periods

Types of homes

Hoekwoningen 307
Appartementen 212
Tussenwoningen 443
Vrijstaande woningen 566
Twee-onder-één-kap woningen 485

Construction period of buildings

Voor 1700 21
1700 tot 1900 92
1900 tot 1925 58
1925 tot 1950 123
1950 tot 1970 555
1970 tot 1980 265
1980 tot 1990 305
1990 tot 2000 70
2000 tot 2010 47
2010 tot 2020 263
2020 en later 97

Energy and sustainability

Energy label distribution

Label C

609

Label A

492

Label B

234

Label D

202

Label G

186

Label F

154

Label E

68

Label A+++

56

Label A++++

19

Label A++

14

Label A+

8

Label A+++++

0

Average energy consumption per year

Average energy consumption per year in Den Dungen
Year Gas (m3) Electricity (kWh)
2020 1.474 3.423
2021 1.639 3.514
2022 1.251 3.328
2023 1.039 3.186
2024 991 3.361

Consumption per house type

Hoekwoning

Gas: 836 • Electricity: 2.565

Huurwoning

Gas: 831 • Electricity: 2.374

Koopwoning

Gas: 1.100 • Electricity: 3.428

Appartement

Gas: 625 • Electricity: 1.907

Tussenwoning

Gas: 688 • Electricity: 2.370

Vrijstaande woning

Gas: 1.412 • Electricity: 4.131

Twee-onder-één-kap woning

Gas: 1.088 • Electricity: 3.255

Business activity in Den Dungen (2025)

Handel en HORECA 108
Nijverheid en energie 143
Zakelijke dienstverlening 201
Overheid, onderwijs en zorg 119
Landbouw, bosbouw en visserij 27
Vervoer, informatie en communicatie 40
Financiele diensten en onroerendgoed 42
Cultuur, recreatie en overige diensten 66

Total number of company establishments: 732

Recent crime statistics

Recent crime statistics in Den Dungen
Period Crimes
jan 2025 7
jan 2026 0
jul 2025 11
jun 2025 7
mei 2025 5
mrt 2025 10
nov 2024 6
nov 2025 7
okt 2024 5
okt 2025 6
sep 2024 7
sep 2025 4

These figures give an indicative picture of safety trends in the living environment of Den Dungen.

Frequently asked questions about living in Den Dungen

Short answers based on current local statistics, handy for a quick comparison of the living environment.

Hoeveel inwoners heeft Den Dungen?

Den Dungen telt in 2025 ongeveer 4.886 inwoners.

Wat is de gemiddelde WOZ-waarde in Den Dungen?

De gemiddelde WOZ-waarde in Den Dungen is in 2025 circa € 506.142.

Wat is het gemiddelde inkomen per inwoner in Den Dungen?

Het gemiddelde inkomen per inwoner in Den Dungen ligt rond € 29.826 per jaar.

Hoe veilig is wonen in Den Dungen?

Voor het huidige jaar gaat het om ongeveer 89 geregistreerde misdrijven. Gebruik deze cijfers als indicatie en vergelijk trends per periode.

Welke woningtypen komen het meest voor in Den Dungen?

In Den Dungen komt vooral "Vrijstaande woningen" veel voor, met ongeveer 566 woningen.

Receive free, non-binding quotes

Compare multiple real estate agents and choose the best match.