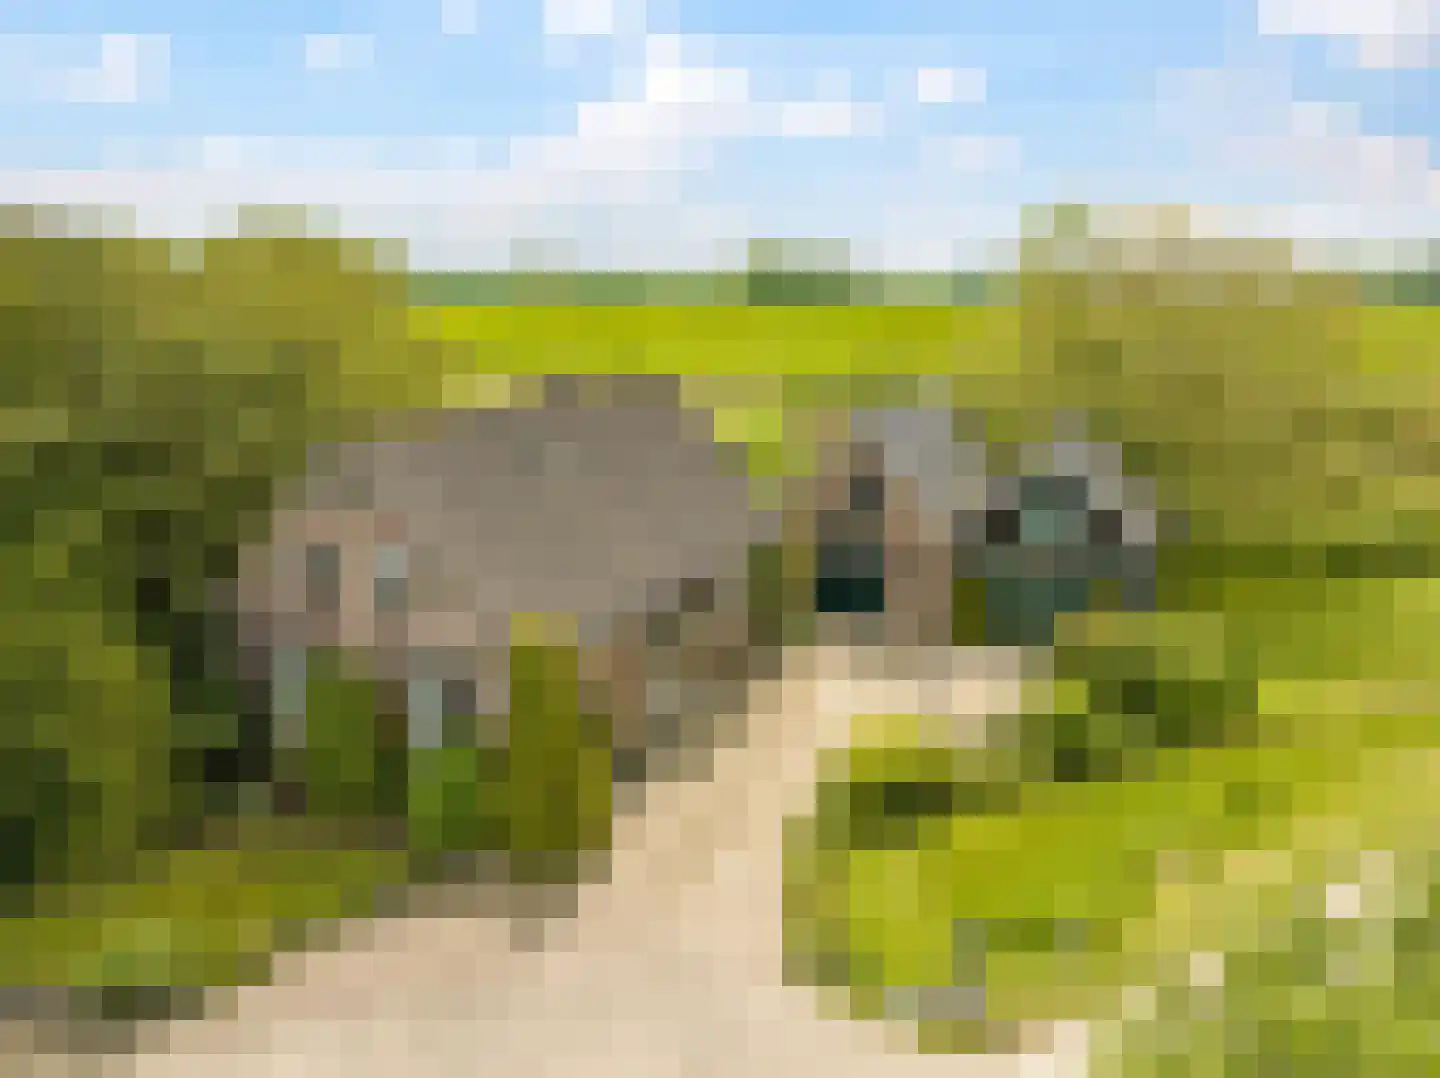
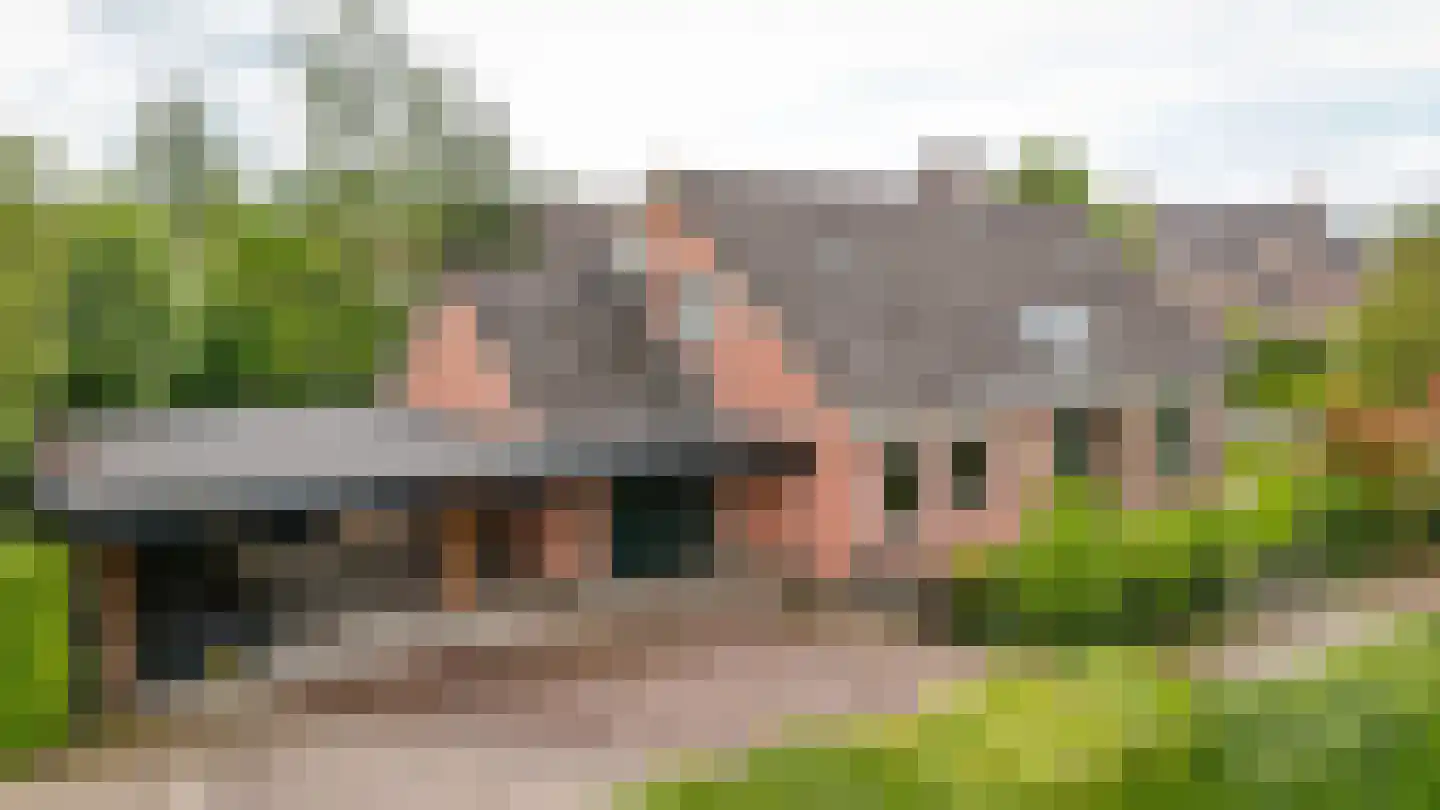
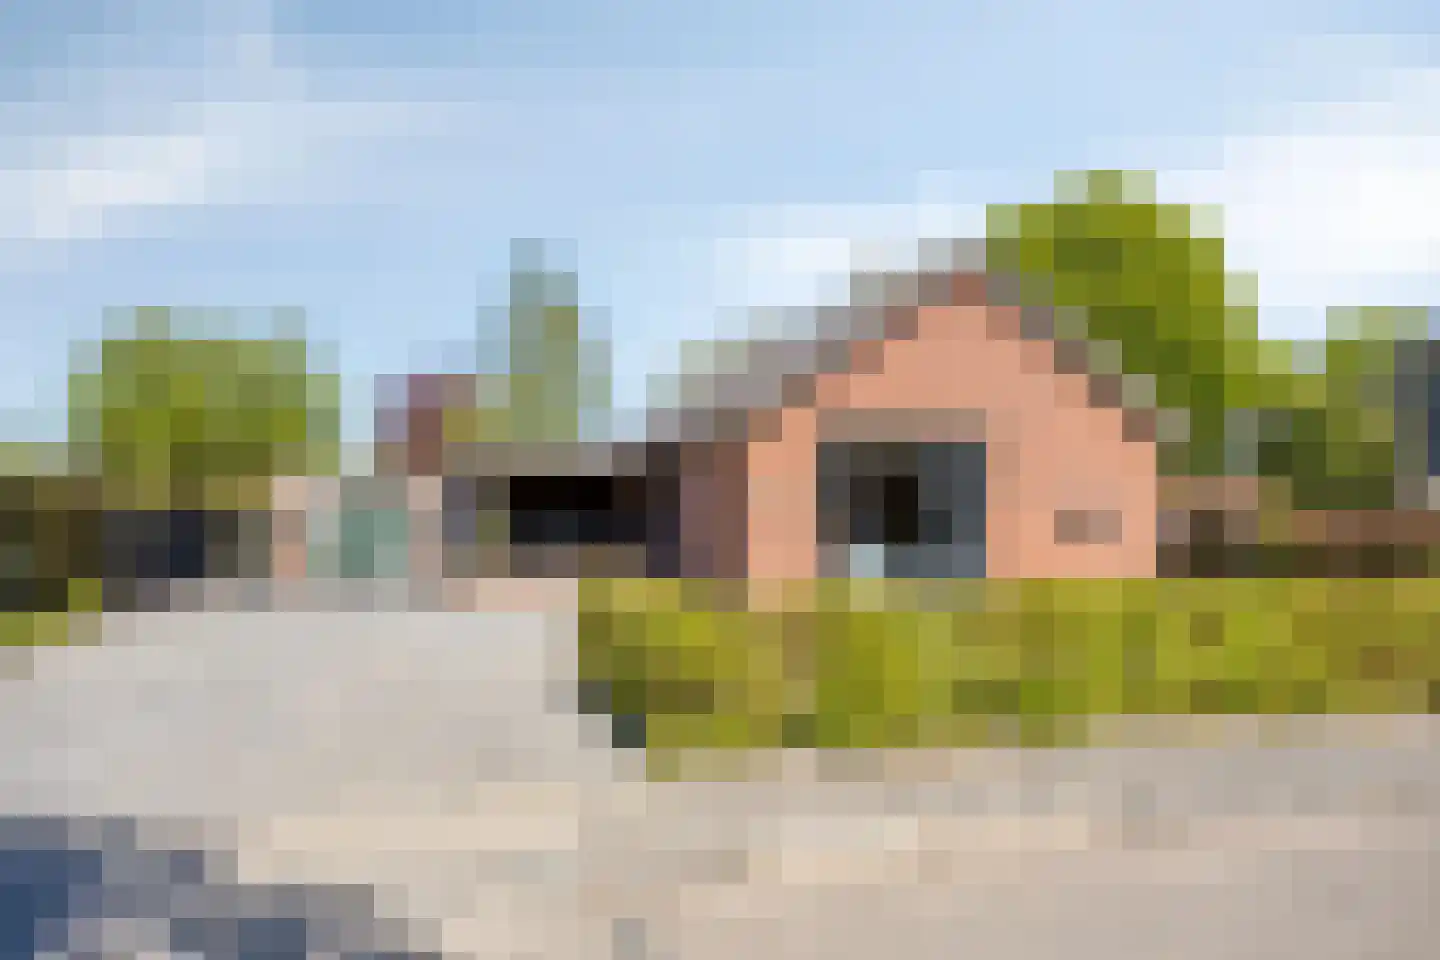
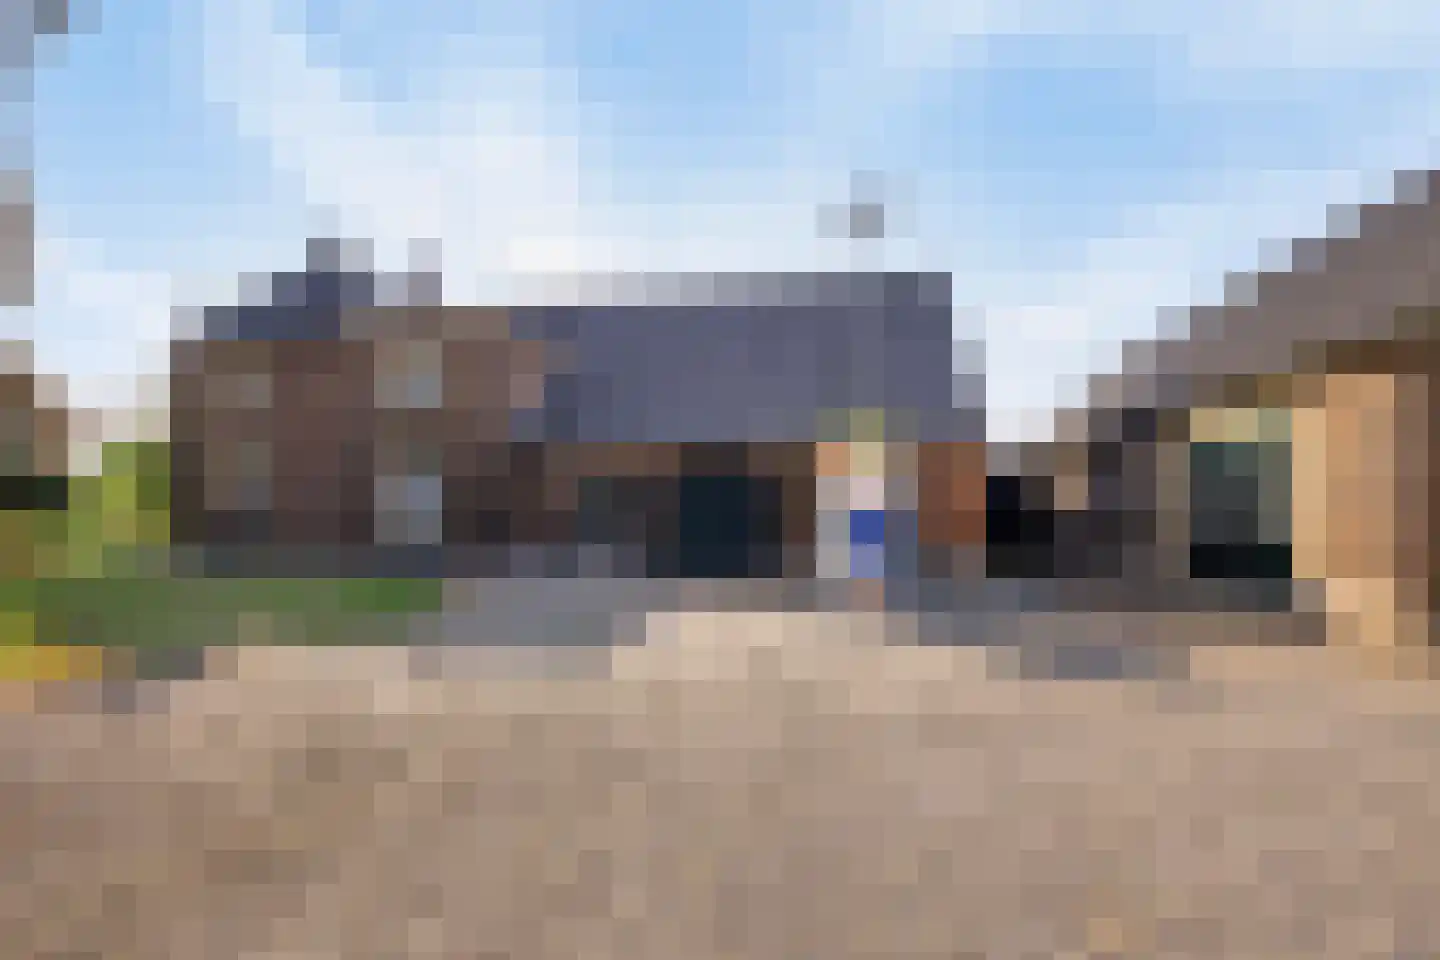
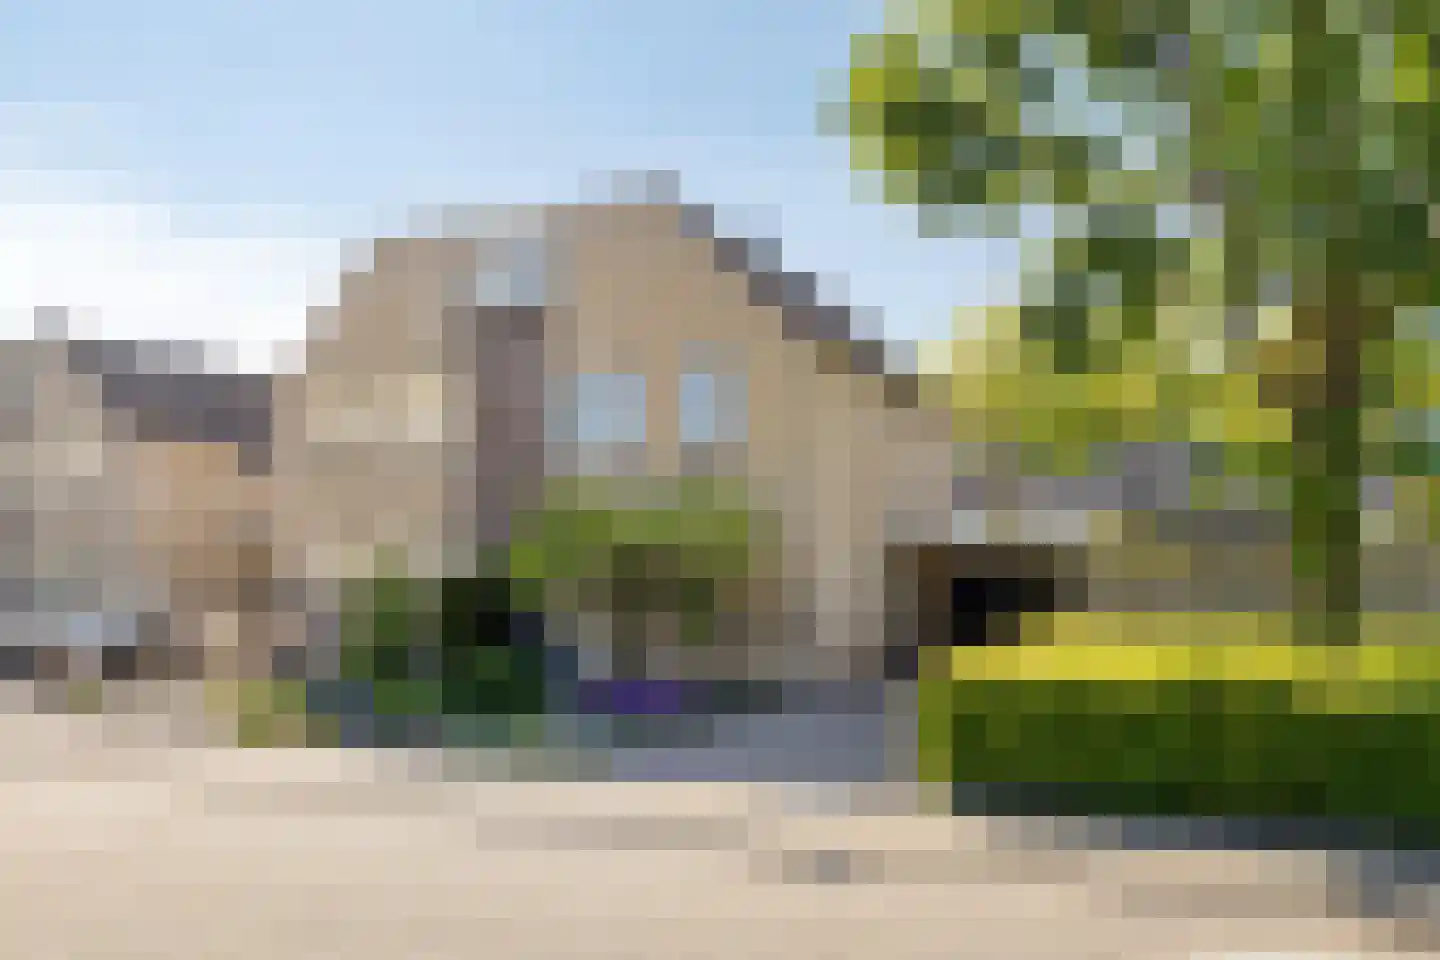
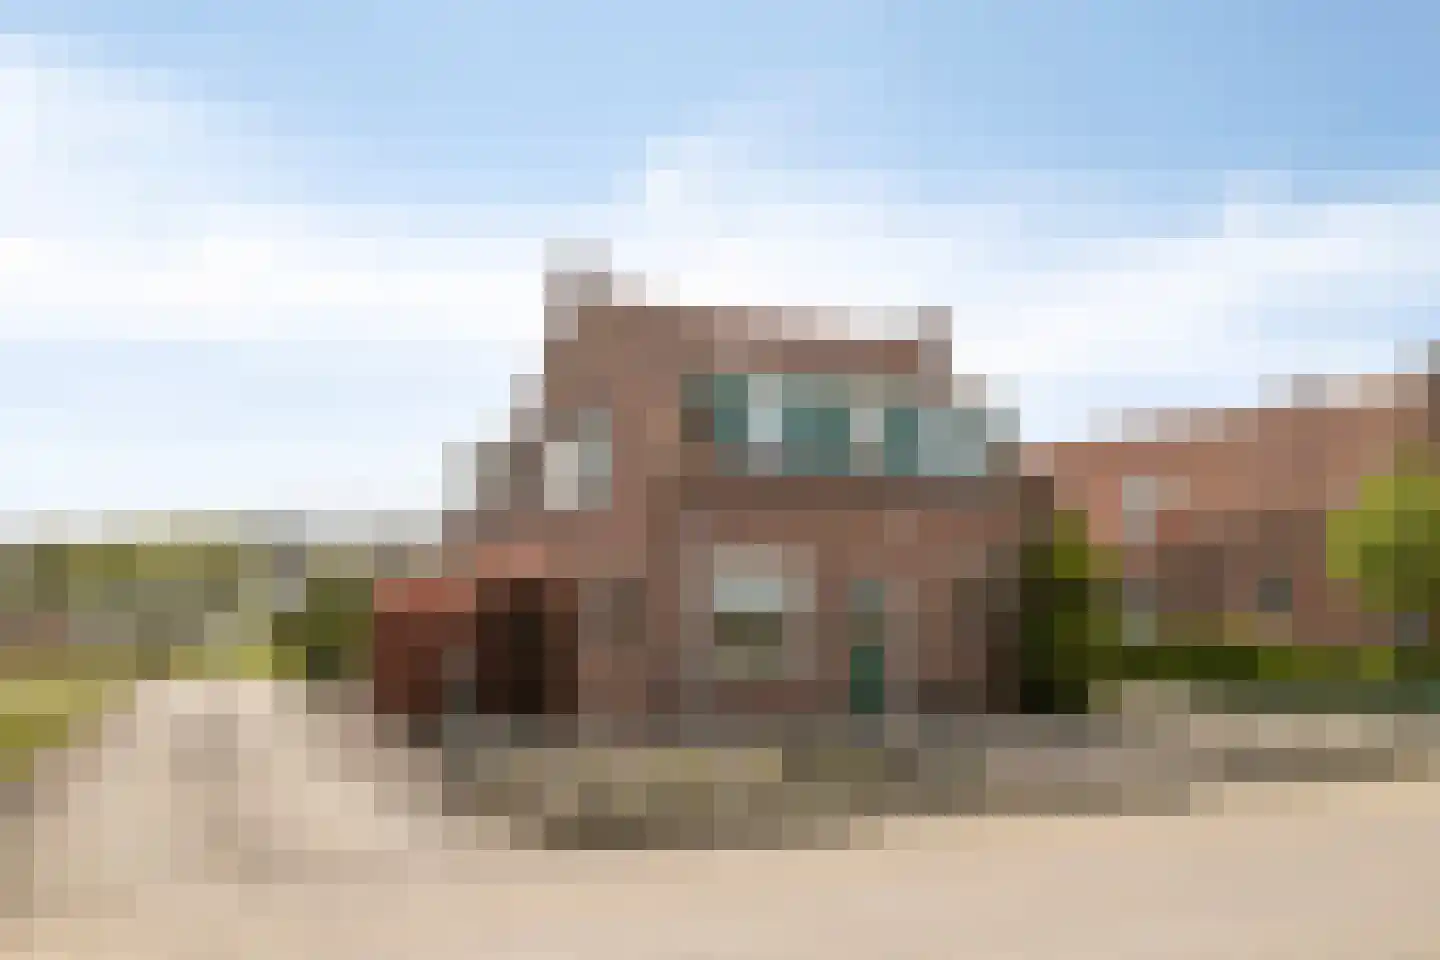
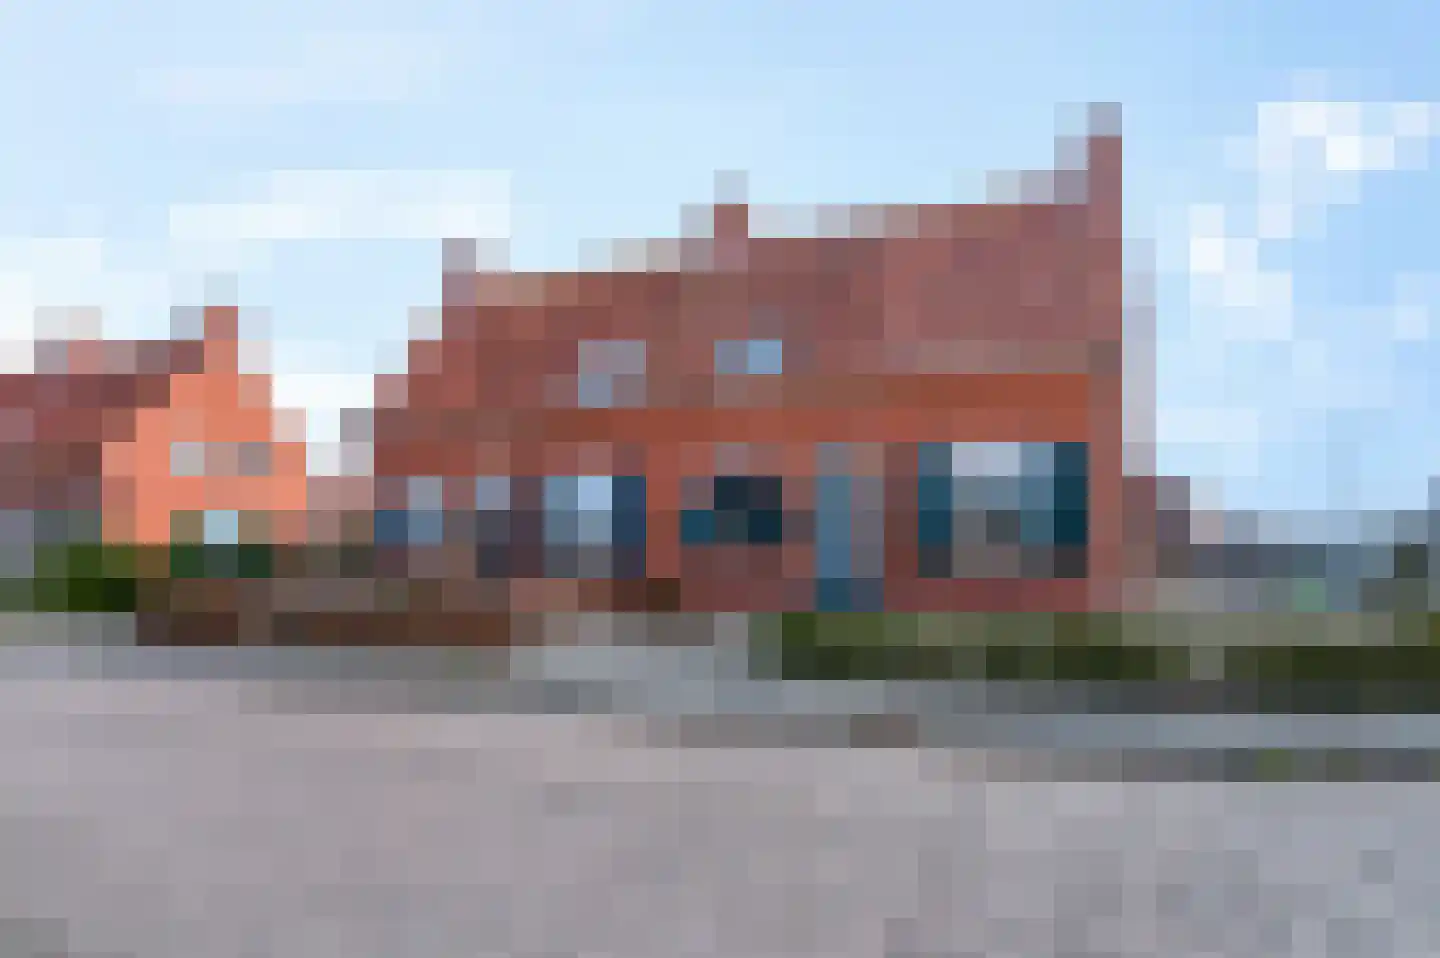
- Available
Merelhof 8
6669ED Dodewaard
€ 389.000 k.k.
€ 3.215/m²
- Living area
- 121 m²
- Land area
- 185 m²
- Bedrooms
- 4
Searching in 48 houses in Dodewaard
Type to search. Use arrow down and arrow up to navigate through results and press Enter to open.
Hidden search suggestions.
View current properties in Dodewaard or search targeted on street, postal code and property characteristics.
View the current housing stock in Dodewaard and quickly filter by price, living area, rooms and more. There are currently 48 houses in this place within our selection. View also 36 sold houses in Dodewaard for extra insight into the local housing market.
6669ED Dodewaard
€ 389.000 k.k.
€ 3.215/m²
6669DR Dodewaard
€ 685.000 k.k.
€ 5.569/m²
6669EE Dodewaard
€ 725.000 k.k.
€ 4.265/m²
6669CP Dodewaard
€ 550.000 k.k.
€ 4.741/m²
6669AB Dodewaard
€ 1.300.000 k.k.
€ 3.385/m²
6669MG Dodewaard
€ 1.000.000 k.k.
€ 4.167/m²
6669MH Dodewaard
€ 1.050.000 k.k.
€ 4.709/m²
6669GR Dodewaard
€ 569.000 k.k.
€ 4.311/m²
6669GS Dodewaard
€ 649.000 k.k.
€ 4.476/m²
6669DA Dodewaard
€ 1.250.000 k.k.
€ 1.994/m²
6669GD Dodewaard
€ 459.000 k.k.
€ 4.062/m²
6669DT Dodewaard
€ 110.000 k.k.
6669CS Dodewaard
€ 1.150.000 k.k.
6669CN Dodewaard
€ 698.500 k.k.
€ 5.062/m²
6669GL Dodewaard
€ 735.000 k.k.
€ 4.622/m²
6669BX Dodewaard
€ 500.000 k.k.
€ 5.495/m²
6669WJ Dodewaard
€ 389.000 k.k.
€ 4.743/m²
6669GR Dodewaard
€ 375.000 k.k.
€ 4.934/m²
6669EC Dodewaard
€ 418.000 k.k.
€ 3.870/m²
6669MB Dodewaard
€ 585.000 k.k.
€ 2.759/m²
6669BW Dodewaard
€ 415.000 k.k.
€ 4.068/m²
6669GC Dodewaard
€ 715.000 k.k.
€ 4.387/m²
6669EC Dodewaard
€ 450.000 k.k.
€ 4.245/m²
6669WH Dodewaard
€ 439.500 k.k.
€ 3.693/m²
6669AR Dodewaard
€ 425.000 k.k.
€ 4.670/m²
6669BR Dodewaard
€ 339.000 k.k.
€ 4.913/m²
6669BS Dodewaard
€ 385.000 k.k.
€ 4.476/m²
6669CZ Dodewaard
€ 465.000 k.k.
€ 4.603/m²
Get free quotes from real estate agents with local market knowledge. Compare more than 41 real estate agents in Dodewaard.
Selling a home in Dodewaard? Compare all real estate agents in Dodewaard or view the top 10 real estate agents in Dodewaard for extra context for your choice.
Real estate agents make sharper offers when they know you're comparing — ask for quotes for sale or purchase.
Practical answers about housing supply, sales and comparing real estate agents in Dodewaard.
The costs of a real estate agent in Dodewaard depend on commission, setup costs, property presentation and the chosen service. Compare the 41 real estate agents in Dodewaard via the real estate agent page and request multiple quotes to compare rates and approach well.
Within our selection, we are currently showing 48 houses in Dodewaard. View also the sold houses in Dodewaard to compare the current offering with recent transactions.
Take into account not only price and living area but also maintenance, energy label, location, outdoor space and sales status. This way you compare houses in Dodewaard on more than just the asking price.
A local real estate agent knows the neighborhoods, recent transactions and demand in Dodewaard. By comparing 41 real estate agents in the region you get a better insight into prices, sales strategy and expected yield; the top 10 in Dodewaard provides a useful starting point.
Yes, when making a sales plan, a valuation in Dodewaard is wise. You gain insight into a realistic asking price and can then compare offers from real estate agents specifically.
View current location data on residents, WOZ development, housing stock, energy consumption, business activity and safety in Dodewaard. In 2026 were there 4.683 residents. The average WOZ value in 2025 is EUR 388.000.
These figures help to better assess and compare the housing stock in Dodewaard with recent sold homes. Orient yourself then on suitable top real estate agents in Dodewaard for sales advice in this region.
Residents
4.683
Last year: 2026
Average WOZ
EUR 388.000
Last year: 2025
Average income per person.
EUR 31.800
Source: AllNumbers
Crimes (current year)
124
Total registered
| Year | Residents |
|---|---|
| 2021 | 4.460 |
| 2022 | 4.505 |
| 2023 | 4.590 |
| 2024 | 4.645 |
| 2025 | 4.690 |
| 2026 | 4.683 |
| Year | Average WOZ |
|---|---|
| 2021 | EUR 277.000 |
| 2022 | EUR 301.000 |
| 2023 | EUR 344.000 |
| 2024 | EUR 361.000 |
| 2025 | EUR 388.000 |
Hoger
650
Praktisch
1.180
Middelbaar
1.630
Europa
245
Nederland
4.170
Buiten Europa
270
Label C
431
Label A
291
Label B
279
Label G
193
Label F
148
Label D
126
Label A++
103
Label E
96
Label A+++
85
Label A+
40
Label A++++
5
Label A+++++
2
| Year | Gas (m3) | Electricity (kWh) |
|---|---|---|
| 2020 | 1.440 | 3.440 |
| 2021 | 1.640 | 3.460 |
| 2022 | 1.260 | 3.280 |
| 2023 | 1.030 | 3.130 |
| 2024 | 1.000 | 3.220 |
Hoekwoning
Gas: 880 • Electricity: 2.460
Huurwoning
Gas: 870 • Electricity: 2.220
Koopwoning
Gas: 1.120 • Electricity: 3.670
Appartement
Gas: 750 • Electricity: 2.440
Tussenwoning
Gas: 790 • Electricity: 2.390
Vrijstaande woning
Gas: 1.340 • Electricity: 4.340
Twee-onder-één-kap woning
Gas: 1.120 • Electricity: 3.150
Total number of company establishments: 730
| Period | Crimes |
|---|---|
| jan 2026 | 7 |
| jul 2025 | 17 |
| jun 2025 | 5 |
| mei 2025 | 10 |
| mrt 2025 | 15 |
| mrt 2026 | 15 |
| nov 2024 | 7 |
| nov 2025 | 4 |
| okt 2024 | 12 |
| okt 2025 | 10 |
| sep 2024 | 12 |
| sep 2025 | 14 |
These figures give an indicative picture of safety trends in the living environment of Dodewaard.
Short answers based on current local statistics, handy for a quick comparison of the living environment.
Dodewaard telt in 2026 ongeveer 4.683 inwoners.
De gemiddelde WOZ-waarde in Dodewaard is in 2025 circa € 388.000.
Het gemiddelde inkomen per inwoner in Dodewaard ligt rond € 31.800 per jaar.
Voor het huidige jaar gaat het om ongeveer 124 geregistreerde misdrijven. Gebruik deze cijfers als indicatie en vergelijk trends per periode.
In Dodewaard komt vooral "Vrijstaande woningen" veel voor, met ongeveer 582 woningen.