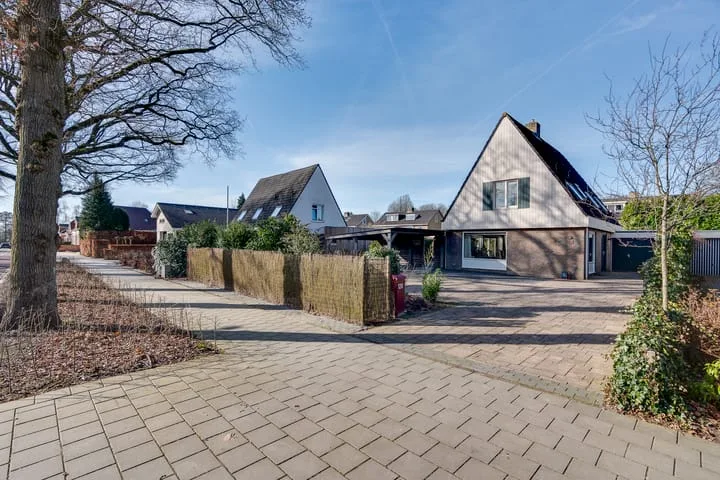
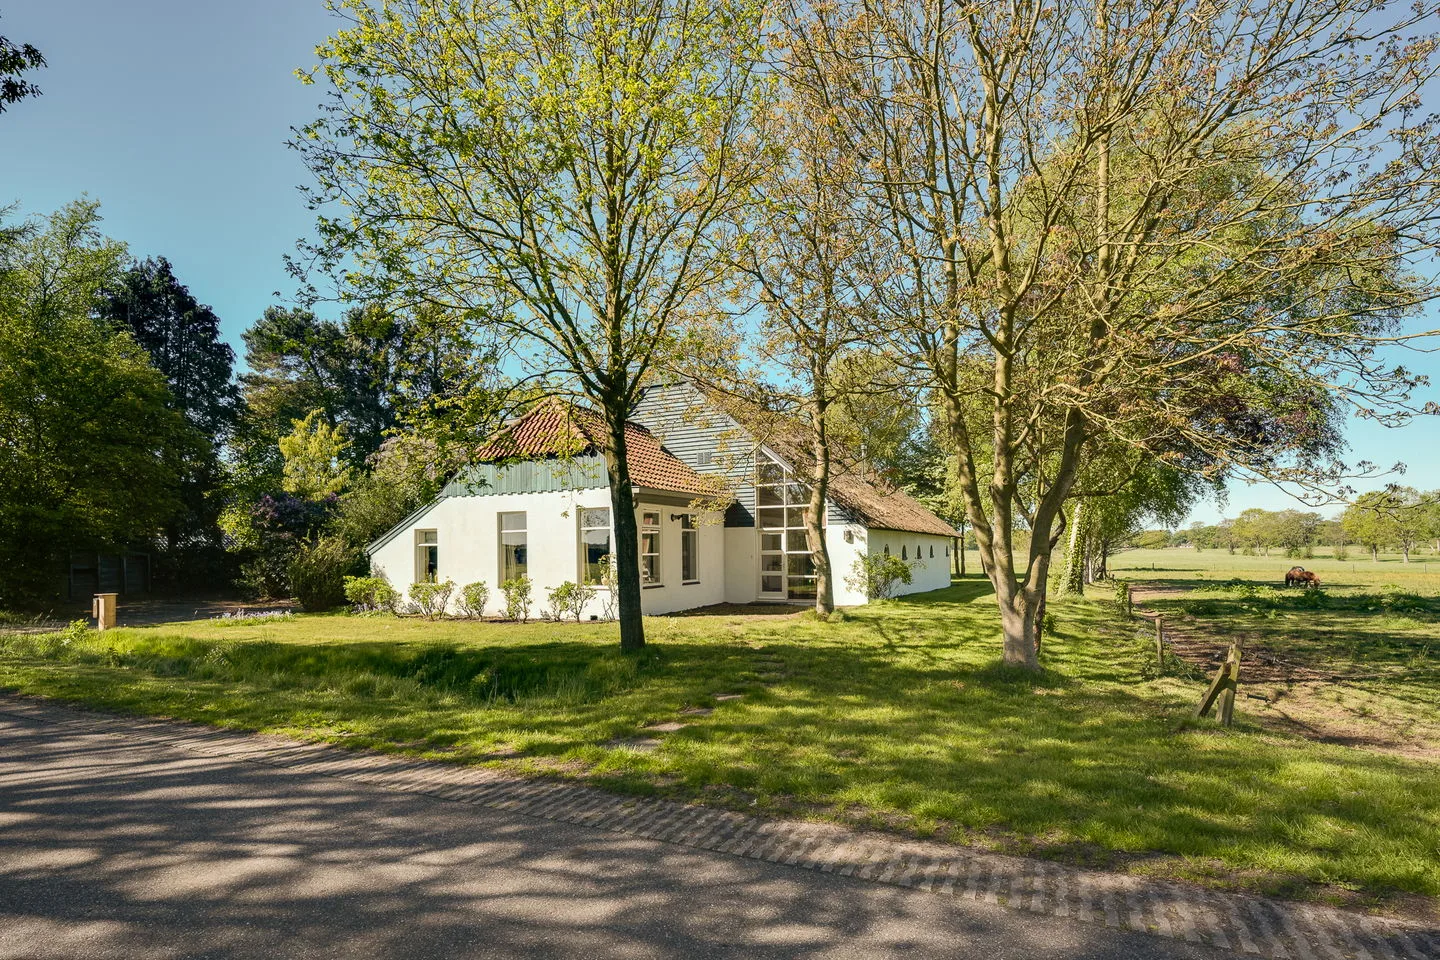
- Available
Lugtenbergerweg 7
9761VE Eelde
€ 1.195.000 k.k.
€ 3.931/m²
- Living area
- 304 m²
- Land area
- 33802 m²
- Bedrooms
- 6
Searching in 74 houses in Eelde
Type to search. Use arrow down and arrow up to navigate through results and press Enter to open.
Hidden search suggestions.
View current properties in Eelde or search targeted on street, postal code and property characteristics.
View the current housing stock in Eelde and quickly filter by price, living area, rooms and more. There are currently 74 houses in this place within our selection. View also 55 sold houses in Eelde for extra insight into the local housing market.
9761VE Eelde
€ 1.195.000 k.k.
€ 3.931/m²
9761DE Eelde
€ 895.000 k.k.
€ 5.028/m²
9761BW Eelde
€ 379.000 k.k.
€ 2.614/m²
9761KG Eelde
€ 335.000 k.k.
€ 3.102/m²
9761GP Eelde
€ 439.000 k.k.
€ 2.677/m²
9761LP Eelde
€ 495.000 k.k.
€ 3.536/m²
9761BA Eelde
€ 324.500 k.k.
€ 3.489/m²
9761EN Eelde
€ 875.000 k.k.
9761HV Eelde
€ 389.000 k.k.
9761HA Eelde
€ 745.000 k.k.
€ 4.656/m²
9761LH Eelde
€ 749.000 k.k.
€ 5.467/m²
9761LM Eelde
€ 359.500 k.k.
€ 4.384/m²
9761BP Eelde
€ 335.000 k.k.
€ 3.131/m²
9761LM Eelde
€ 249.000 k.k.
€ 3.891/m²
9761KD Eelde
€ 295.000 k.k.
€ 4.538/m²
9761JP Eelde
€ 375.000 k.k.
€ 3.713/m²
9761GM Eelde
€ 699.000 k.k.
€ 4.186/m²
9761HT Eelde
€ 395.000 k.k.
€ 2.883/m²
9761HK Eelde
€ 495.000 k.k.
€ 2.982/m²
9761EC Eelde
€ 425.000 k.k.
€ 3.972/m²
9761TG Eelde
€ 850.000 k.k.
€ 5.667/m²
9761EM Eelde
€ 725.000
€ 4.005/m²
9761JZ Eelde
€ 239.000 k.k.
€ 3.794/m²
9761TE Eelde
€ 899.000 k.k.
€ 4.517/m²
9761GP Eelde
€ 535.000 k.k.
€ 3.203/m²
9761HE Eelde
€ 545.000 k.k.
€ 3.323/m²
9761AM Eelde
€ 550.000 k.k.
€ 5.913/m²
9761CP Eelde
€ 525.000 k.k.
€ 4.303/m²
Get free quotes from real estate agents with local market knowledge. Compare more than 116 real estate agents in Eelde.
Selling a home in Eelde? Compare all real estate agents in Eelde or view the top 10 real estate agents in Eelde for extra context for your choice.
Real estate agents make sharper offers when they know you're comparing — ask for quotes for sale or purchase.
Practical answers about housing supply, sales and comparing real estate agents in Eelde.
The costs of a real estate agent in Eelde depend on commission, setup costs, property presentation and the chosen service. Compare the 116 real estate agents in Eelde via the real estate agent page and request multiple quotes to compare rates and approach well.
Within our selection, we are currently showing 74 houses in Eelde. View also the sold houses in Eelde to compare the current offering with recent transactions.
Take into account not only price and living area but also maintenance, energy label, location, outdoor space and sales status. This way you compare houses in Eelde on more than just the asking price.
A local real estate agent knows the neighborhoods, recent transactions and demand in Eelde. By comparing 116 real estate agents in the region you get a better insight into prices, sales strategy and expected yield; the top 10 in Eelde provides a useful starting point.
Yes, when making a sales plan, a valuation in Eelde is wise. You gain insight into a realistic asking price and can then compare offers from real estate agents specifically.
View current location data on residents, WOZ development, housing stock, energy consumption, business activity and safety in Eelde. In 2025 were there 7.085 residents. The average WOZ value in 2025 is EUR 387.000.
These figures help to better assess and compare the housing stock in Eelde with recent sold homes. Orient yourself then on suitable top real estate agents in Eelde for sales advice in this region.
Residents
7.085
Last year: 2025
Average WOZ
EUR 387.000
Last year: 2025
Average income per person.
EUR 35.500
Source: AllNumbers
Crimes (current year)
95
Total registered
| Year | Residents |
|---|---|
| 2021 | 7.020 |
| 2022 | 7.040 |
| 2023 | 7.090 |
| 2024 | 7.075 |
| 2025 | 7.085 |
| Year | Average WOZ |
|---|---|
| 2021 | EUR 279.000 |
| 2022 | EUR 311.000 |
| 2023 | EUR 357.000 |
| 2024 | EUR 368.000 |
| 2025 | EUR 387.000 |
Hoger
2.070
Praktisch
830
Middelbaar
1.920
Europa
315
Nederland
6.225
Buiten Europa
550
Label C
945
Label A
643
Label B
629
Label D
387
Label G
178
Label F
147
Label E
110
Label A++
57
Label A+
49
Label A+++
15
Label A+++++
4
Label A++++
3
| Year | Gas (m3) | Electricity (kWh) |
|---|---|---|
| 2020 | 1.410 | 2.660 |
| 2021 | 1.580 | 2.690 |
| 2022 | 1.220 | 2.480 |
| 2023 | 1.030 | 2.370 |
| 2024 | 990 | 2.480 |
Hoekwoning
Gas: 1.020 • Electricity: 2.130
Huurwoning
Gas: 830 • Electricity: 1.650
Koopwoning
Gas: 1.110 • Electricity: 2.670
Appartement
Gas: 680 • Electricity: 1.550
Tussenwoning
Gas: 940 • Electricity: 2.010
Vrijstaande woning
Gas: 1.410 • Electricity: 3.430
Twee-onder-één-kap woning
Gas: 1.030 • Electricity: 2.570
Total number of company establishments: 810
| Period | Crimes |
|---|---|
| jan 2025 | 5 |
| jan 2026 | 3 |
| jul 2025 | 6 |
| jun 2025 | 6 |
| mei 2025 | 12 |
| mrt 2025 | 7 |
| nov 2024 | 8 |
| nov 2025 | 11 |
| okt 2024 | 12 |
| okt 2025 | 10 |
| sep 2024 | 8 |
| sep 2025 | 11 |
These figures give an indicative picture of safety trends in the living environment of Eelde.
Short answers based on current local statistics, handy for a quick comparison of the living environment.
Eelde telt in 2025 ongeveer 7.085 inwoners.
De gemiddelde WOZ-waarde in Eelde is in 2025 circa € 387.000.
Het gemiddelde inkomen per inwoner in Eelde ligt rond € 35.500 per jaar.
Voor het huidige jaar gaat het om ongeveer 95 geregistreerde misdrijven. Gebruik deze cijfers als indicatie en vergelijk trends per periode.
In Eelde komt vooral "Tussenwoningen" veel voor, met ongeveer 763 woningen.