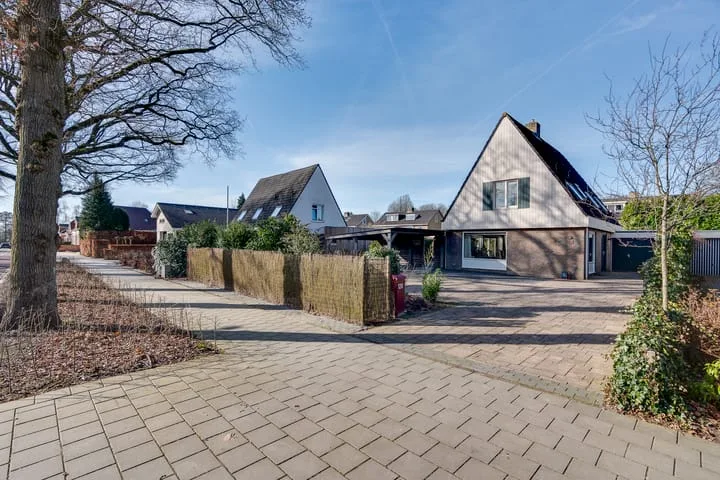
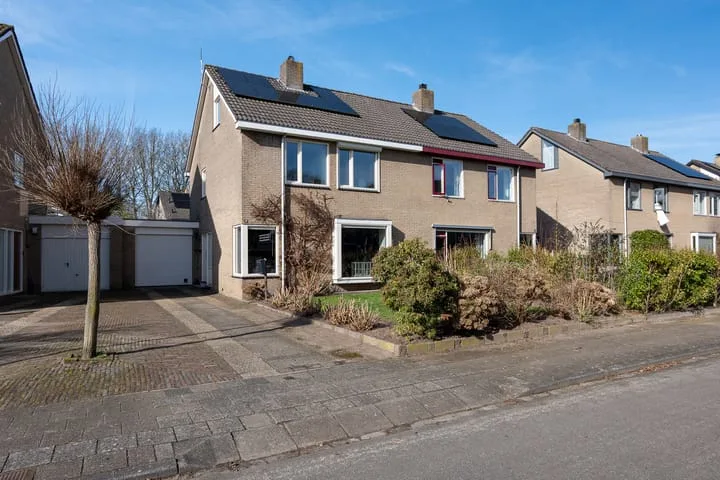
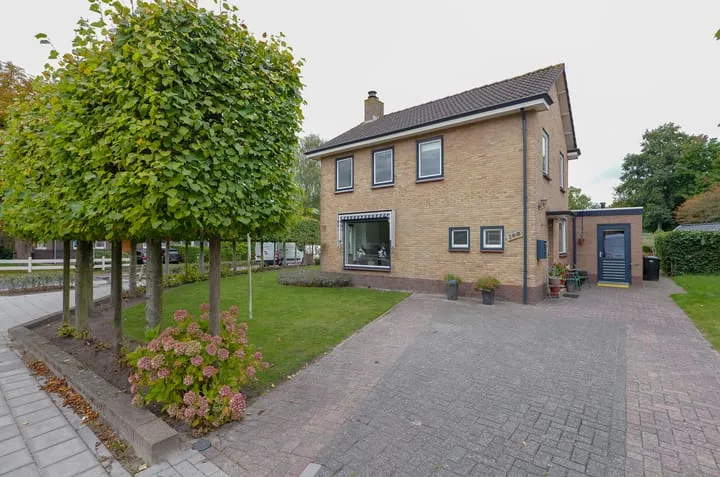
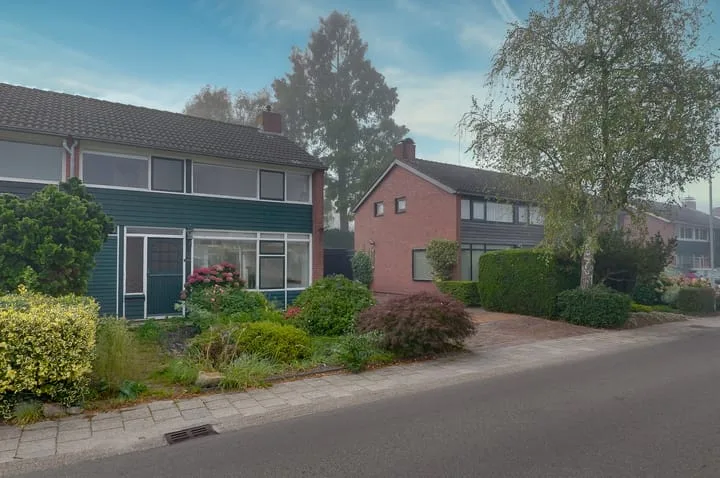
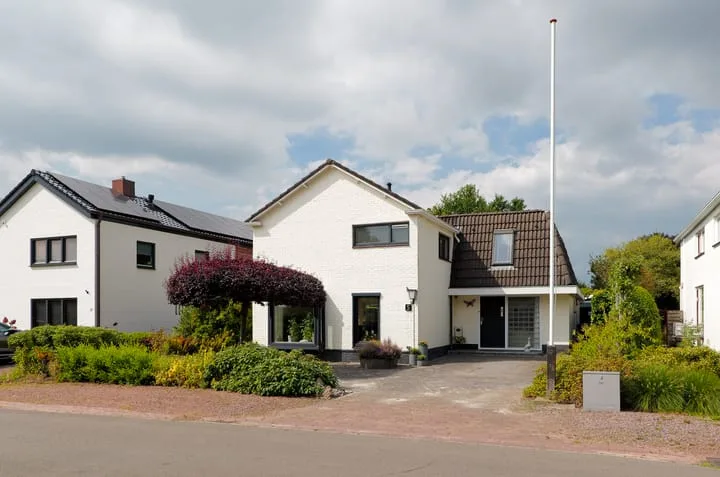
- Sold
Hoofdweg 97 a
9761EC Eelde
€ 425.000 k.k.
€ 3.972/m²
- Living area
- 107 m²
- Land area
- —
- Bedrooms
- 2
View 58 sold houses in Eelde
Type to search. Use arrow down and arrow up to navigate through results and press Enter to open.
Hidden search suggestions.
Compare sold homes in Eelde or view the current offering in this location directly.
On this page you will find recently sold homes in Eelde. Use this overview to better estimate selling prices, popular neighborhoods, and the local housing supply before you choose a real estate agent. Also view the current housing supply with 70 houses in Eelde.
9761EC Eelde
€ 425.000 k.k.
€ 3.972/m²
9761EM Eelde
€ 725.000
€ 4.005/m²
9761TE Eelde
€ 899.000 k.k.
€ 4.517/m²
9761GP Eelde
€ 535.000 k.k.
€ 3.203/m²
9761HE Eelde
€ 545.000 k.k.
€ 3.323/m²
9761AM Eelde
€ 550.000 k.k.
€ 5.913/m²
9761CP Eelde
€ 525.000 k.k.
€ 4.303/m²
9761EN Eelde
€ 495.000 k.k.
€ 4.380/m²
9761BE Eelde
€ 315.000 k.k.
€ 2.142/m²
9761LM Eelde
€ 299.500 k.k.
€ 3.652/m²
9761HW Eelde
€ 325.000 k.k.
€ 2.480/m²
9761CN Eelde
€ 475.000 k.k.
€ 3.084/m²
9761DC Eelde
€ 449.000 k.k.
€ 4.677/m²
9761DE Eelde
€ 475.000 k.k.
€ 3.861/m²
9761EN Eelde
€ 449.000 k.k.
€ 4.196/m²
9761KL Eelde
€ 409.000 k.k.
€ 4.305/m²
9761JH Eelde
€ 789.000 k.k.
€ 4.174/m²
9761EL Eelde
€ 525.000 k.k.
€ 4.038/m²
9761KD Eelde
€ 300.000 k.k.
€ 3.092/m²
9761EN Eelde
€ 300.000 k.k.
€ 3.260/m²
9761LC Eelde
€ 495.000 k.k.
€ 3.613/m²
9761BV Eelde
€ 300.000 k.k.
€ 2.608/m²
9761KD Eelde
€ 289.500 k.k.
€ 4.453/m²
9761KN Eelde
€ 450.000 k.k.
€ 4.591/m²
9761DH Eelde
€ 399.000 k.k.
€ 3.325/m²
9761LZ Eelde
€ 625.000 k.k.
€ 3.491/m²
9761CS Eelde
€ 665.000 k.k.
€ 3.982/m²
9761HN Eelde
€ 399.000 k.k.
€ 3.045/m²
Bekijk recente verkopen en ontvang gratis offertes van lokale verkoopmakelaars in Eelde.
Zelf je woning verkopen in Eelde? Vergelijk verkoopmakelaars in Eelde of bekijk de beste verkoopmakelaars in Eelde als referentie bij jouw keuze.
Makelaars maken scherpere voorstellen als ze weten dat je vergelijkt — vraag offertes aan voor verkoop of aankoop.
Short answers about housing prices, sold homes and comparing real estate agents in Eelde.
The costs of a real estate agent in Eelde vary per office, property type and sales approach. Therefore, compare multiple quotes and also look at the real estate agents in Eelde to better compare rates, presentation and local experience.
On this page we currently show 58 sold houses in Eelde from our selection. This helps you to better assess recent transactions and the local housing market.
Houses sold in Eelde give insight into asking prices, house types and neighborhoods where recent transactions have taken place. Compare this also with the current housing stock in Eelde to better understand the market.
You can use sold homes as a first market indication, but a local real estate agent can better take into account finishing, location, maintenance and current demand in Eelde.
Vergelijk makelaars in Eelde op lokale verkoopervaring, reviews, verwachte opbrengst, courtage en marketingaanpak. Bekijk verkoopmakelaars in Eelde of de top 10 makelaars in Eelde om snel sterke kantoren te ontdekken.
View current location data on residents, WOZ development, housing stock, energy consumption, business activity and safety in Eelde. In 2025 were there 7.085 residents. The average WOZ value in 2025 is EUR 387.000.
These figures help to better assess and compare the housing stock in Eelde with recent sold homes. Orient yourself then on suitable top real estate agents in Eelde for sales advice in this region.
Residents
7.085
Last year: 2025
Average WOZ
EUR 387.000
Last year: 2025
Average income per person.
EUR 35.500
Source: AllNumbers
Crimes (current year)
95
Total registered
| Year | Residents |
|---|---|
| 2021 | 7.020 |
| 2022 | 7.040 |
| 2023 | 7.090 |
| 2024 | 7.075 |
| 2025 | 7.085 |
| Year | Average WOZ |
|---|---|
| 2021 | EUR 279.000 |
| 2022 | EUR 311.000 |
| 2023 | EUR 357.000 |
| 2024 | EUR 368.000 |
| 2025 | EUR 387.000 |
Hoger
2.070
Praktisch
830
Middelbaar
1.920
Europa
315
Nederland
6.225
Buiten Europa
550
Label C
945
Label A
643
Label B
629
Label D
387
Label G
178
Label F
147
Label E
110
Label A++
57
Label A+
49
Label A+++
15
Label A+++++
4
Label A++++
3
| Year | Gas (m3) | Electricity (kWh) |
|---|---|---|
| 2020 | 1.410 | 2.660 |
| 2021 | 1.580 | 2.690 |
| 2022 | 1.220 | 2.480 |
| 2023 | 1.030 | 2.370 |
| 2024 | 990 | 2.480 |
Hoekwoning
Gas: 1.020 • Electricity: 2.130
Huurwoning
Gas: 830 • Electricity: 1.650
Koopwoning
Gas: 1.110 • Electricity: 2.670
Appartement
Gas: 680 • Electricity: 1.550
Tussenwoning
Gas: 940 • Electricity: 2.010
Vrijstaande woning
Gas: 1.410 • Electricity: 3.430
Twee-onder-één-kap woning
Gas: 1.030 • Electricity: 2.570
Total number of company establishments: 810
| Period | Crimes |
|---|---|
| jan 2025 | 5 |
| jan 2026 | 3 |
| jul 2025 | 6 |
| jun 2025 | 6 |
| mei 2025 | 12 |
| mrt 2025 | 7 |
| nov 2024 | 8 |
| nov 2025 | 11 |
| okt 2024 | 12 |
| okt 2025 | 10 |
| sep 2024 | 8 |
| sep 2025 | 11 |
These figures give an indicative picture of safety trends in the living environment of Eelde.
Short answers based on current local statistics, handy for a quick comparison of the living environment.
Eelde telt in 2025 ongeveer 7.085 inwoners.
De gemiddelde WOZ-waarde in Eelde is in 2025 circa € 387.000.
Het gemiddelde inkomen per inwoner in Eelde ligt rond € 35.500 per jaar.
Voor het huidige jaar gaat het om ongeveer 95 geregistreerde misdrijven. Gebruik deze cijfers als indicatie en vergelijk trends per periode.
In Eelde komt vooral "Tussenwoningen" veel voor, met ongeveer 763 woningen.