- Sold
Grebbeberglaan 58
5628GK Eindhoven
€ 598.000 k.k.
€ 0/m²
C
Save as favorite
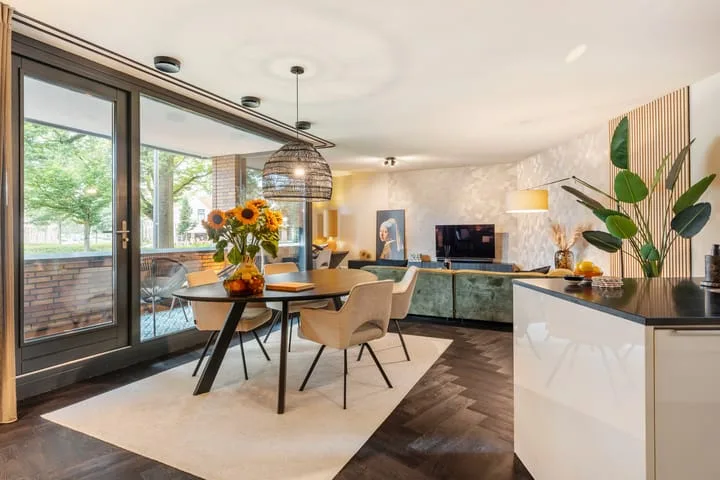
- Living area
- 152 m²
- Land area
- 230 m²
- Bedrooms
- 4