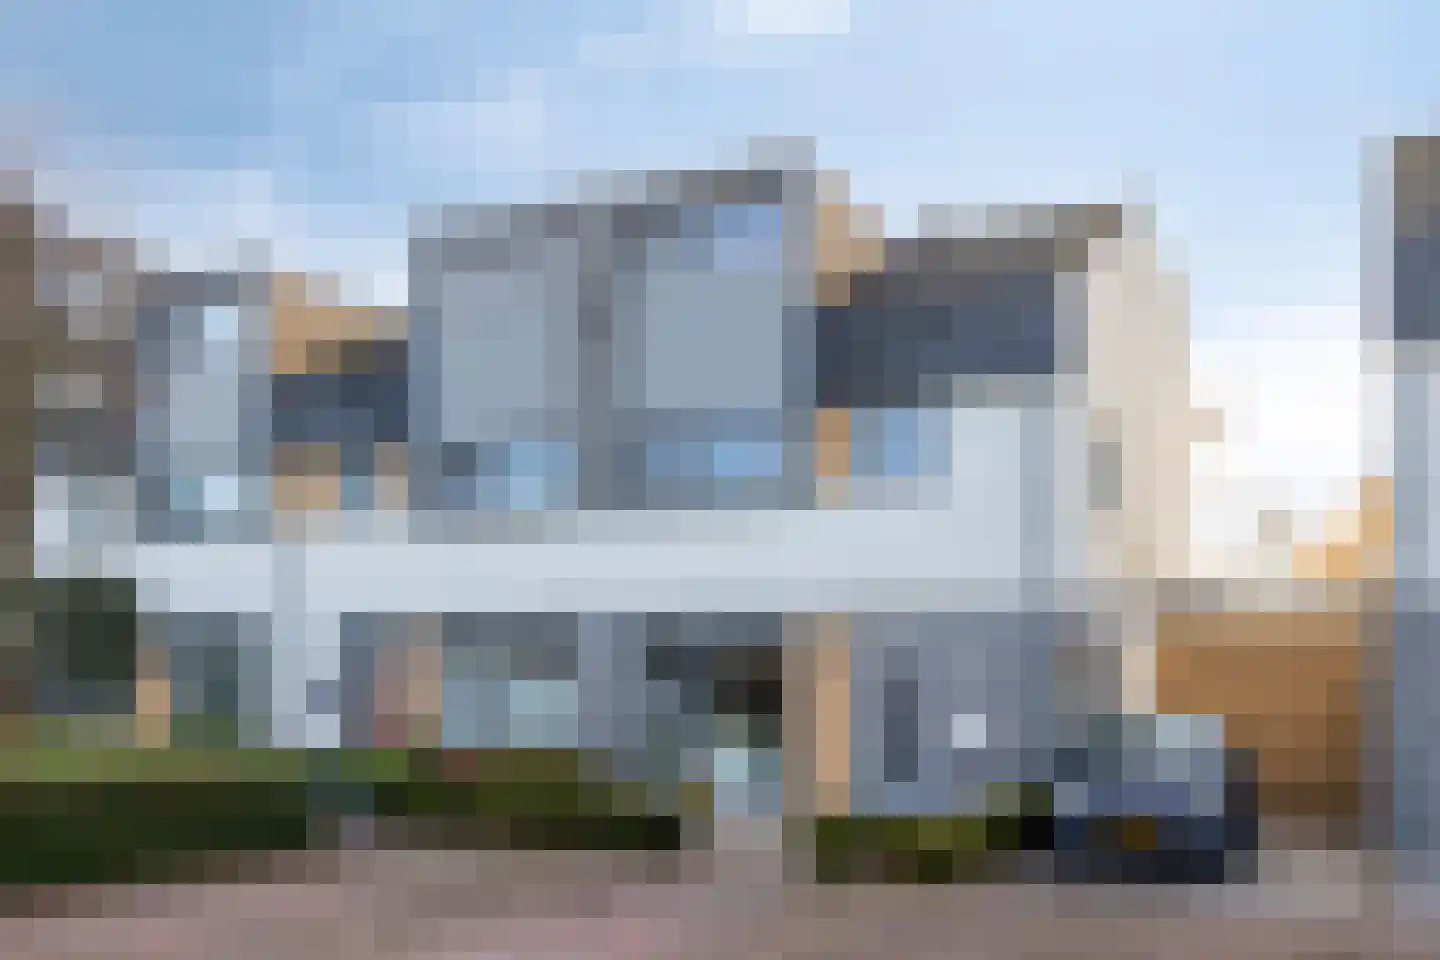
- Available
Ranonkelstraat 77 A
5644LB Eindhoven
€ 325.000 k.k.
€ 6.132/m²
- Living area
- 53 m²
- Land area
- —
- Bedrooms
- 1
Searching in 3.313 houses in Eindhoven
Type to search. Use arrow down and arrow up to navigate through results and press Enter to open.
Hidden search suggestions.
View current properties in Eindhoven or search targeted on street, postal code and property characteristics.
View the current housing stock in Eindhoven and quickly filter by price, living area, rooms and more. There are currently 3.313 houses in this place within our selection. View also 2.131 sold houses in Eindhoven for extra insight into the local housing market.
5644LB Eindhoven
€ 325.000 k.k.
€ 6.132/m²
5658AD Eindhoven
€ 550.000 k.k.
€ 4.583/m²
5628AH Eindhoven
€ 350.000 k.k.
€ 4.023/m²
5611GG Eindhoven
€ 1.720 p/m
€ 32/m²
5653JL Eindhoven
€ 525.000 k.k.
€ 3.646/m²
5612BH Eindhoven
€ 550.000 k.k.
€ 3.438/m²
5655ER Eindhoven
€ 450.000 k.k.
€ 3.629/m²
5631NL Eindhoven
€ 600.000 k.k.
€ 4.878/m²
5628KD Eindhoven
€ 425.000 k.k.
€ 3.728/m²
5615JT Eindhoven
€ 2.000.000 k.k.
€ 5.525/m²
5644NB Eindhoven
€ 565.000 k.k.
€ 4.669/m²
5658HZ Eindhoven
€ 679.000 k.k.
€ 4.885/m²
5612BA Eindhoven
€ 695.000 k.k.
€ 5.792/m²
5644CA Eindhoven
€ 525.000 k.k.
€ 5.147/m²
5625VS Eindhoven
€ 550.000 k.k.
€ 3.416/m²
5654AN Eindhoven
€ 926 p/m
€ 44/m²
5615PM Eindhoven
€ 550.000 k.k.
€ 4.911/m²
5646BX Eindhoven
€ 425.000 k.k.
€ 4.570/m²
5643AK Eindhoven
€ 239.000 k.k.
€ 6.128/m²
5654LS Eindhoven
€ 2.050 p/m
€ 18/m²
5616LH Eindhoven
€ 1.850 p/m
€ 12/m²
5611BN Eindhoven
€ 1.750 p/m
€ 21/m²
5642NE Eindhoven
€ 500.000 k.k.
€ 3.448/m²
5652JP Eindhoven
€ 399.000 k.k.
€ 3.990/m²
5641KV Eindhoven
€ 375.000 k.k.
€ 3.606/m²
5611EZ Eindhoven
€ 1.615 p/m
€ 34/m²
5611SJ Eindhoven
€ 899 p/m
€ 16/m²
5625BW Eindhoven
€ 399.000 k.k.
€ 4.750/m²
Get free quotes from real estate agents with local market knowledge. Compare more than 163 real estate agents in Eindhoven.
Selling a home in Eindhoven? View the sales-oriented guide sell a house in Eindhoven, compare all real estate agents in Eindhoven or view the top 10 real estate agents in Eindhoven for extra context to your choice.
Real estate agents make sharper offers when they know you're comparing — ask for quotes for sale or purchase.
Practical answers about housing supply, sales and comparing real estate agents in Eindhoven.
The costs of a real estate agent in Eindhoven depend on commission, setup costs, property presentation and the chosen service. Compare the 163 real estate agents in Eindhoven via the real estate agent page and request multiple quotes to compare rates and approach well.
Within our selection, we are currently showing 3.313 houses in Eindhoven. View also the sold houses in Eindhoven to compare the current offering with recent transactions.
Take into account not only price and living area but also maintenance, energy label, location, outdoor space and sales status. This way you compare houses in Eindhoven on more than just the asking price.
A local real estate agent knows the neighborhoods, recent transactions and demand in Eindhoven. By comparing 163 real estate agents in the region you get a better insight into prices, sales strategy and expected yield; the top 10 in Eindhoven provides a useful starting point.
Yes, when making a sales plan, a valuation in Eindhoven is wise. You gain insight into a realistic asking price and can then compare offers from real estate agents specifically.
View current location data on residents, WOZ development, housing stock, energy consumption, business activity and safety in Eindhoven. In 2026 were there 249.873 residents. The average WOZ value in 2025 is EUR 391.000.
These figures help to better assess and compare the housing stock in Eindhoven with recent sold homes. Orient yourself then on suitable top real estate agents in Eindhoven for sales advice in this region.
Residents
249.873
Last year: 2026
Average WOZ
EUR 391.000
Last year: 2025
Average income per person.
EUR 36.400
Source: AllNumbers
Crimes (current year)
18.880
Total registered
| Year | Residents |
|---|---|
| 2022 | 238.326 |
| 2023 | 243.730 |
| 2024 | 246.417 |
| 2025 | 249.035 |
| 2026 | 249.873 |
| Year | Average WOZ |
|---|---|
| 2021 | EUR 287.000 |
| 2022 | EUR 314.000 |
| 2023 | EUR 360.000 |
| 2024 | EUR 363.000 |
| 2025 | EUR 391.000 |
Hoger
43
Praktisch
24
Middelbaar
34
Europa
36.936
Nederland
134.959
Buiten Europa
77.140
Label A
34.103
Label C
29.742
Label B
19.304
Label D
11.177
Label E
9.327
Label F
6.306
Label A+
5.788
Label G
4.088
Label A++
3.731
Label A+++
2.635
Label A++++
578
Label A+++++
42
| Year | Gas (m3) | Electricity (kWh) |
|---|---|---|
| 2020 | 1.040 | 2.540 |
| 2021 | 1.140 | 2.570 |
| 2022 | 900 | 2.400 |
| 2023 | 770 | 2.270 |
| 2024 | 750 | 2.310 |
Hoekwoning
Gas: 970 • Electricity: 2.650
Huurwoning
Gas: 670 • Electricity: 1.900
Koopwoning
Gas: 890 • Electricity: 2.740
Appartement
Gas: 550 • Electricity: 1.710
Tussenwoning
Gas: 830 • Electricity: 2.450
Vrijstaande woning
Gas: 1.400 • Electricity: 4.320
Twee-onder-één-kap woning
Gas: 1.210 • Electricity: 3.250
Total number of company establishments: 33.545
| Period | Crimes |
|---|---|
| jan 2025 | 1.526 |
| jan 2026 | 1.357 |
| jul 2025 | 1.556 |
| jun 2025 | 1.564 |
| mei 2025 | 1.610 |
| mrt 2025 | 1.666 |
| nov 2024 | 1.768 |
| nov 2025 | 1.541 |
| okt 2024 | 1.807 |
| okt 2025 | 1.706 |
| sep 2024 | 1.612 |
| sep 2025 | 1.579 |
These figures give an indicative picture of safety trends in the living environment of Eindhoven.
Short answers based on current local statistics, handy for a quick comparison of the living environment.
Eindhoven telt in 2026 ongeveer 249.873 inwoners.
De gemiddelde WOZ-waarde in Eindhoven is in 2025 circa € 391.000.
Het gemiddelde inkomen per inwoner in Eindhoven ligt rond € 36.400 per jaar.
Voor het huidige jaar gaat het om ongeveer 18.880 geregistreerde misdrijven. Gebruik deze cijfers als indicatie en vergelijk trends per periode.
In Eindhoven komt vooral "Appartementen" veel voor, met ongeveer 58.911 woningen.