- Sold
Heesterpoort 9
9713KX Groningen
€ 300.000 k.k.
€ 4.838/m²
D
Save as favorite
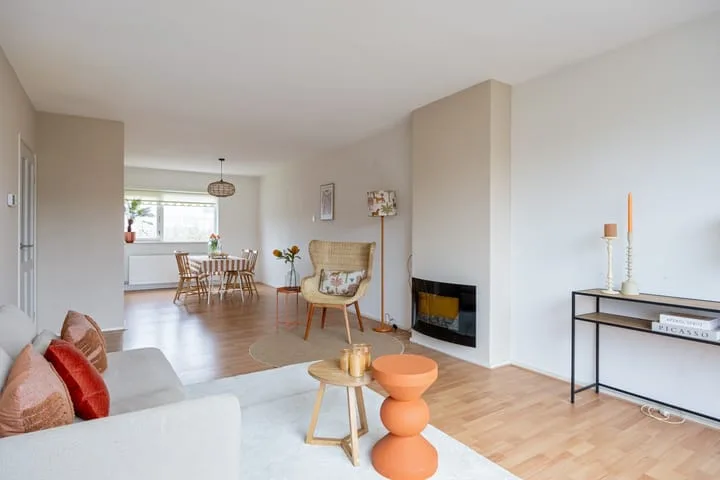
- Living area
- 62 m²
- Land area
- 88 m²
- Bedrooms
- 1