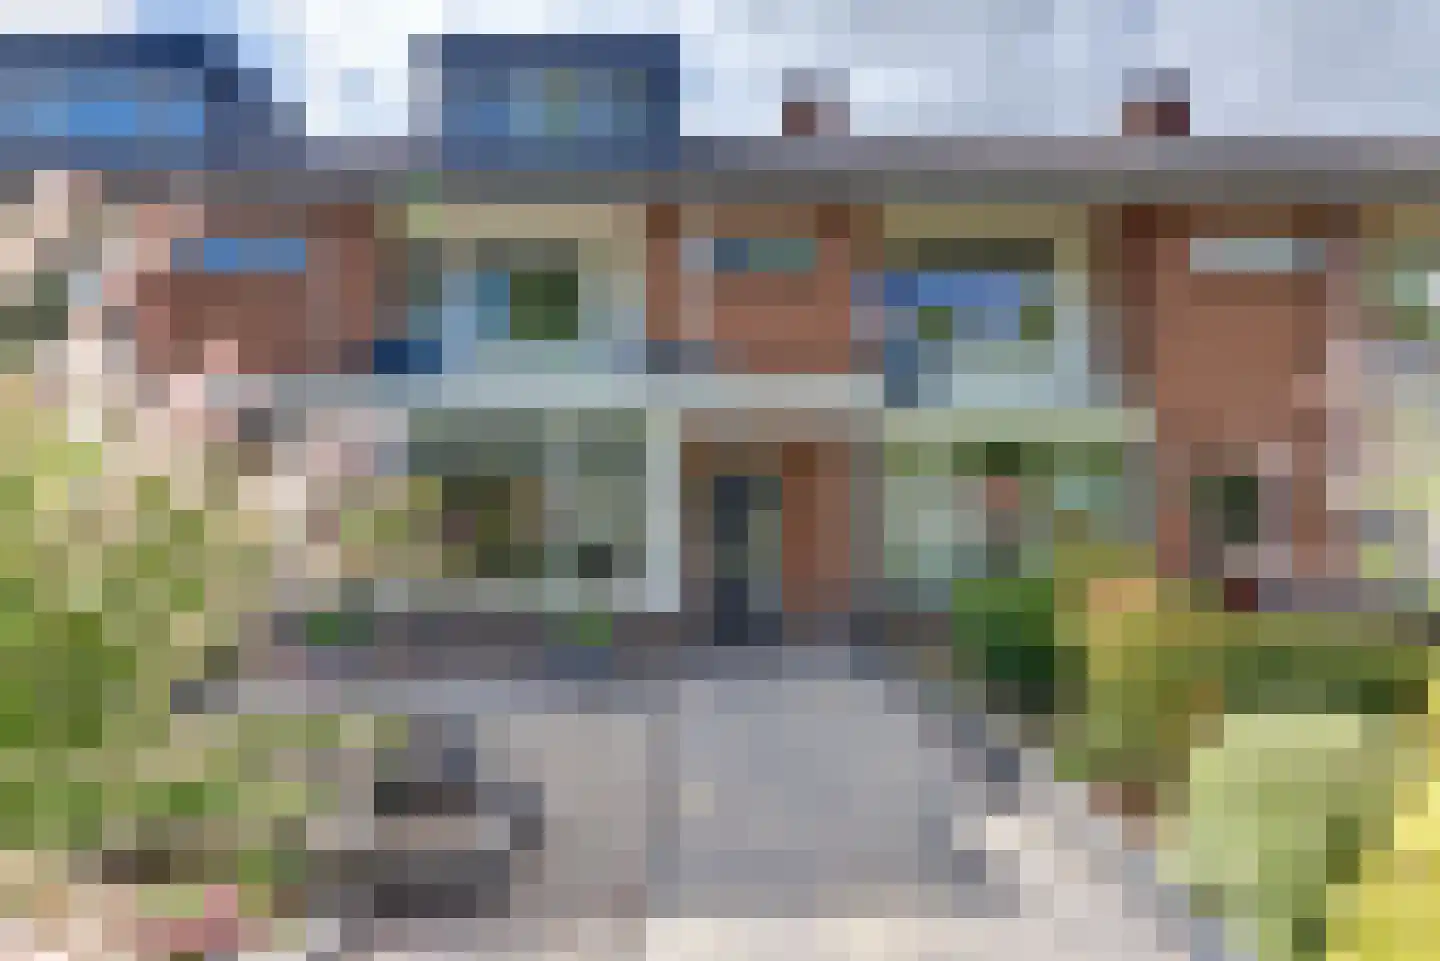
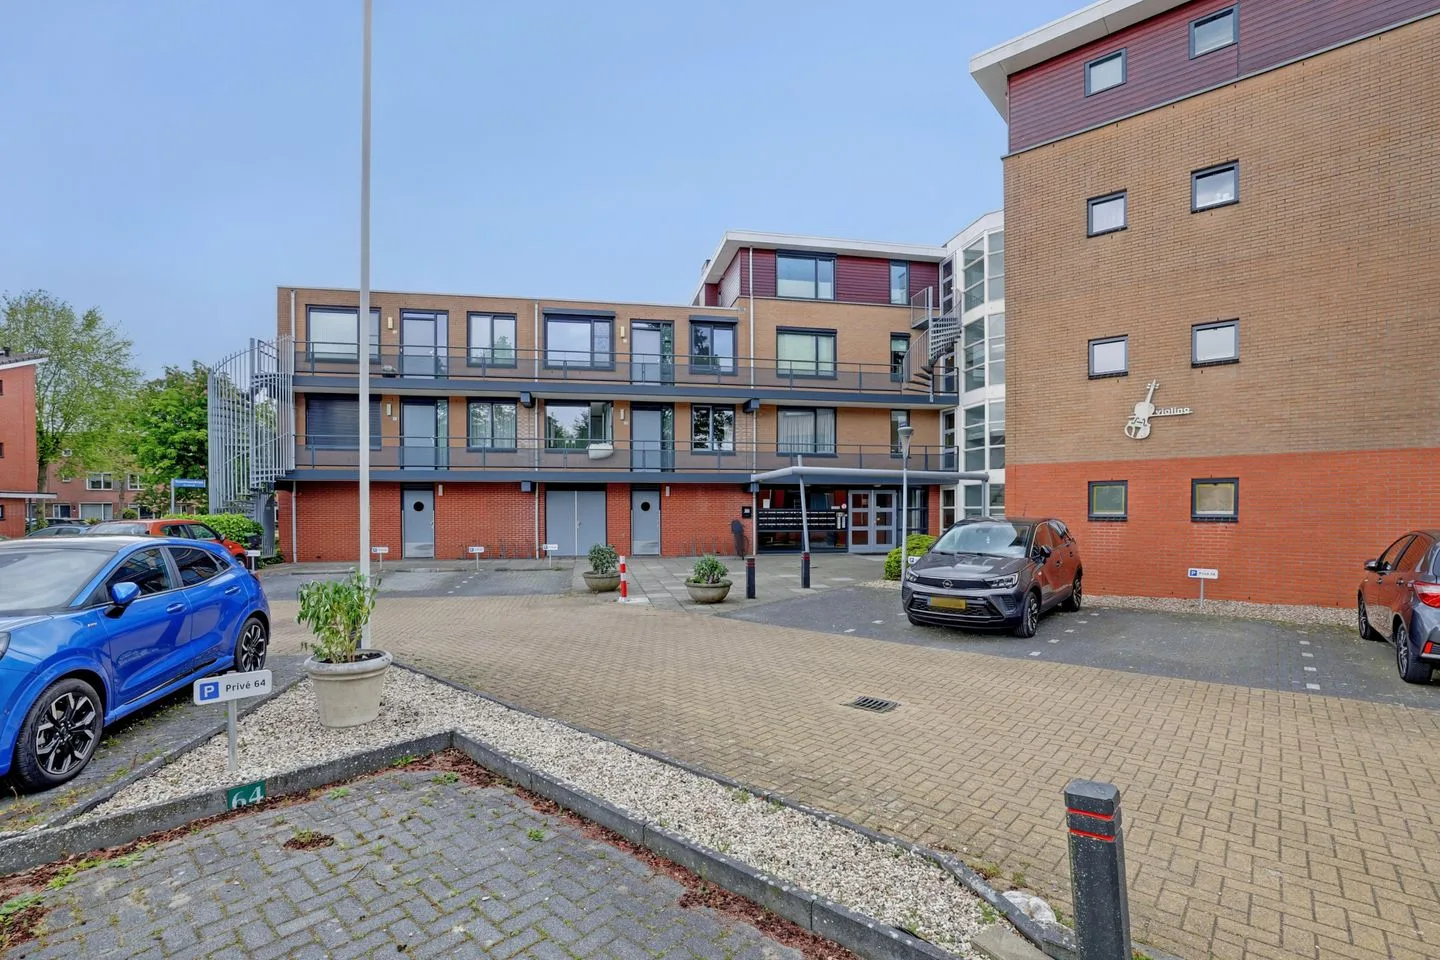
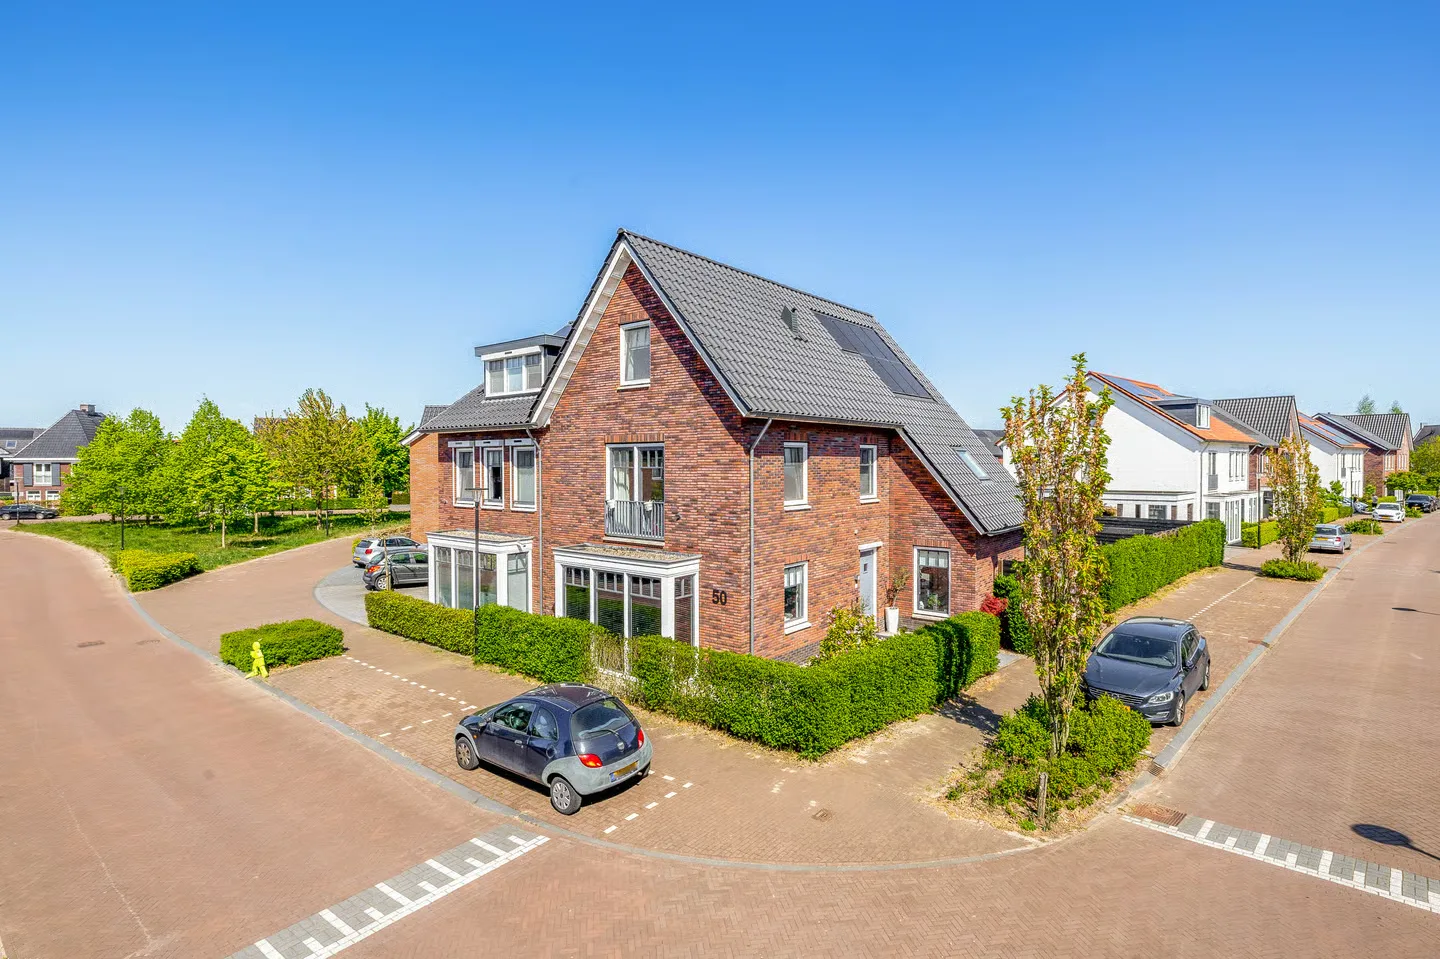
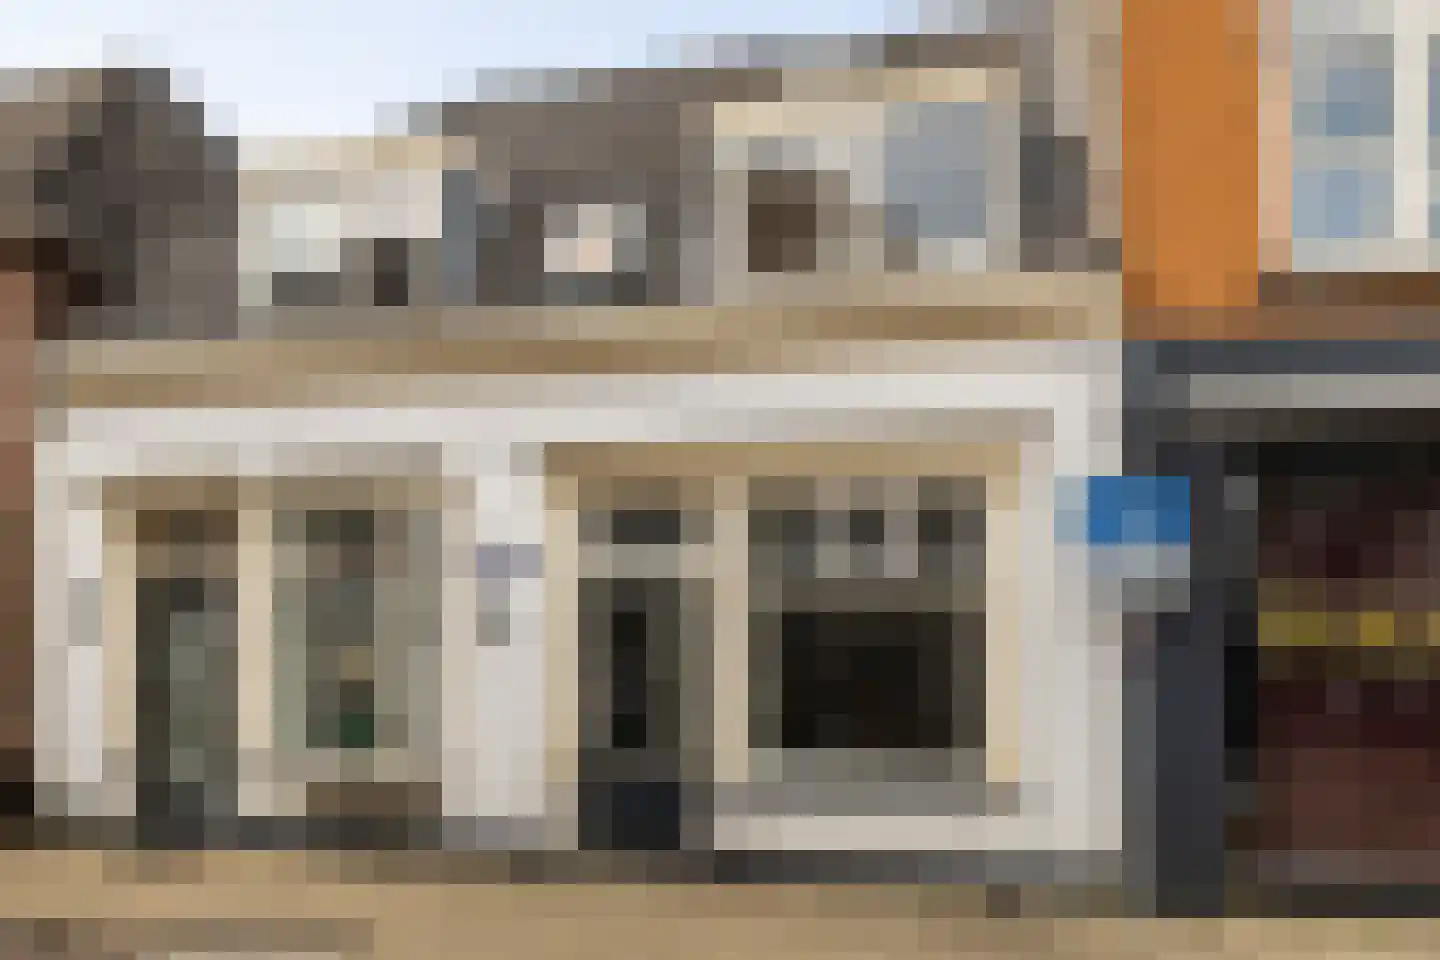
- Available
Hoogstraat 31 A
3841BR Harderwijk
€ 359.000 k.k.
€ 5.523/m²
- Living area
- 65 m²
- Land area
- 40 m²
- Bedrooms
- 3
Searching in 652 houses in Harderwijk
Type to search. Use arrow down and arrow up to navigate through results and press Enter to open.
Hidden search suggestions.
View current properties in Harderwijk or search targeted on street, postal code and property characteristics.
View the current housing stock in Harderwijk and quickly filter by price, living area, rooms and more. There are currently 652 houses in this place within our selection. View also 443 sold houses in Harderwijk for extra insight into the local housing market.
3841BR Harderwijk
€ 359.000 k.k.
€ 5.523/m²
3841EL Harderwijk
€ 1.200.000 k.k.
€ 6.383/m²
3845HJ Harderwijk
€ 1.195.000 k.k.
€ 4.705/m²
3841AX Harderwijk
€ 699.000 k.k.
€ 4.424/m²
3841EW Harderwijk
€ 1.675.000 k.k.
€ 5.154/m²
3842XM Harderwijk
€ 539.500 k.k.
€ 4.316/m²
3845LR Harderwijk
€ 450.000 k.k.
€ 5.114/m²
3841DP Harderwijk
€ 1.185.000 k.k.
€ 5.985/m²
3841KH Harderwijk
€ 449.000 k.k.
€ 3.563/m²
3845CW Harderwijk
€ 398.000 k.k.
€ 5.038/m²
3843BJ Harderwijk
€ 345.000 k.k.
€ 5.149/m²
3842JT Harderwijk
€ 325.000 k.k.
€ 4.167/m²
3843GV Harderwijk
€ 419.000 k.k.
€ 4.029/m²
3846JV Harderwijk
€ 885.000 k.k.
€ 7.375/m²
3843BN Harderwijk
€ 469.500 k.k.
€ 4.995/m²
3842GR Harderwijk
€ 415.000 k.k.
€ 4.940/m²
3844LG Harderwijk
€ 330.000 k.k.
€ 3.113/m²
3845DK Harderwijk
€ 495.000 k.k.
€ 3.561/m²
3848DC Harderwijk
€ 685.000 k.k.
€ 5.957/m²
3842XX Harderwijk
€ 439.000 k.k.
€ 3.920/m²
3844BH Harderwijk
€ 499.500 k.k.
€ 3.933/m²
3842EC Harderwijk
€ 425.000 k.k.
€ 3.542/m²
3848CJ Harderwijk
€ 425.000 k.k.
€ 4.830/m²
3841BN Harderwijk
€ 695.000 k.k.
€ 5.226/m²
3845HD Harderwijk
€ 497.500 k.k.
€ 4.146/m²
3842AB Harderwijk
€ 423.500 k.k.
€ 5.801/m²
3845KL Harderwijk
€ 938.000 k.k.
3847LE Harderwijk
€ 450.000 k.k.
Get free quotes from real estate agents with local market knowledge. Compare more than 39 real estate agents in Harderwijk.
Selling a home in Harderwijk? View the sales-oriented guide sell a house in Harderwijk, compare all real estate agents in Harderwijk or view the top 10 real estate agents in Harderwijk for extra context to your choice.
Real estate agents make sharper offers when they know you're comparing — ask for quotes for sale or purchase.
Practical answers about housing supply, sales and comparing real estate agents in Harderwijk.
The costs of a real estate agent in Harderwijk depend on commission, setup costs, property presentation and the chosen service. Compare the 39 real estate agents in Harderwijk via the real estate agent page and request multiple quotes to compare rates and approach well.
Within our selection, we are currently showing 652 houses in Harderwijk. View also the sold houses in Harderwijk to compare the current offering with recent transactions.
Take into account not only price and living area but also maintenance, energy label, location, outdoor space and sales status. This way you compare houses in Harderwijk on more than just the asking price.
A local real estate agent knows the neighborhoods, recent transactions and demand in Harderwijk. By comparing 39 real estate agents in the region you get a better insight into prices, sales strategy and expected yield; the top 10 in Harderwijk provides a useful starting point.
Yes, when making a sales plan, a valuation in Harderwijk is wise. You gain insight into a realistic asking price and can then compare offers from real estate agents specifically.
View current location data on residents, WOZ development, housing stock, energy consumption, business activity and safety in Harderwijk. In 2025 were there 46.495 residents. The average WOZ value in 2025 is EUR 393.126.
These figures help to better assess and compare the housing stock in Harderwijk with recent sold homes. Orient yourself then on suitable top real estate agents in Harderwijk for sales advice in this region.
Residents
46.495
Last year: 2025
Average WOZ
EUR 393.126
Last year: 2025
Average income per person.
EUR 24.263
Source: AllNumbers
Crimes (current year)
1.923
Total registered
| Year | Residents |
|---|---|
| 2021 | 45.480 |
| 2022 | 45.510 |
| 2023 | 45.475 |
| 2024 | 45.945 |
| 2025 | 46.495 |
| Year | Average WOZ |
|---|---|
| 2021 | EUR 280.664 |
| 2022 | EUR 309.114 |
| 2023 | EUR 370.493 |
| 2024 | EUR 380.488 |
| 2025 | EUR 393.126 |
Hoger
10.320
Praktisch
9.490
Middelbaar
14.510
Europa
2.465
Nederland
36.280
Buiten Europa
7.765
Label A
6.906
Label C
4.968
Label B
3.569
Label D
1.386
Label E
1.239
Label F
910
Label A+
725
Label G
585
Label A+++
511
Label A++
437
Label A++++
420
Label A+++++
9
| Year | Gas (m3) | Electricity (kWh) |
|---|---|---|
| 2020 | 1.080 | 2.693 |
| 2021 | 1.224 | 2.720 |
| 2022 | 959 | 2.553 |
| 2023 | 819 | 2.433 |
| 2024 | 785 | 2.472 |
Hoekwoning
Gas: 985 • Electricity: 2.736
Huurwoning
Gas: 679 • Electricity: 1.969
Koopwoning
Gas: 932 • Electricity: 2.760
Appartement
Gas: 580 • Electricity: 1.845
Tussenwoning
Gas: 851 • Electricity: 2.475
Vrijstaande woning
Gas: 1.386 • Electricity: 4.020
Twee-onder-één-kap woning
Gas: 1.076 • Electricity: 3.210
Total number of company establishments: 6.060
| Period | Crimes |
|---|---|
| jan 2025 | 124 |
| jan 2026 | 144 |
| jul 2025 | 138 |
| jun 2025 | 149 |
| mei 2025 | 165 |
| mrt 2025 | 259 |
| nov 2024 | 146 |
| nov 2025 | 186 |
| okt 2024 | 142 |
| okt 2025 | 185 |
| sep 2024 | 169 |
| sep 2025 | 148 |
These figures give an indicative picture of safety trends in the living environment of Harderwijk.
Short answers based on current local statistics, handy for a quick comparison of the living environment.
Harderwijk telt in 2025 ongeveer 46.495 inwoners.
De gemiddelde WOZ-waarde in Harderwijk is in 2025 circa € 393.126.
Het gemiddelde inkomen per inwoner in Harderwijk ligt rond € 24.263 per jaar.
Voor het huidige jaar gaat het om ongeveer 1.923 geregistreerde misdrijven. Gebruik deze cijfers als indicatie en vergelijk trends per periode.
In Harderwijk komt vooral "Tussenwoningen" veel voor, met ongeveer 8.068 woningen.