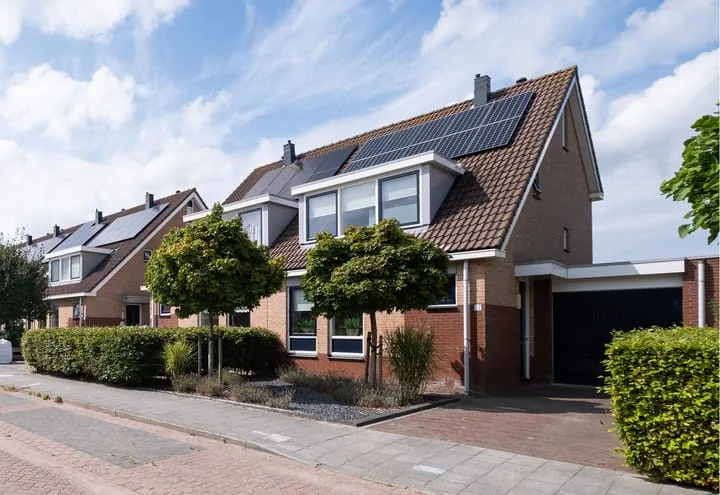
- Available
Dorpsweg 172
1711RN Hensbroek
€ 495.000 k.k.
€ 6.188/m²
- Living area
- 80 m²
- Land area
- 940 m²
- Bedrooms
- 2
Searching in 14 houses in Hensbroek
Type to search. Use arrow down and arrow up to navigate through results and press Enter to open.
Hidden search suggestions.
View current properties in Hensbroek or search targeted on street, postal code and property characteristics.
View the current housing stock in Hensbroek and quickly filter by price, living area, rooms and more. There are currently 14 houses in this place within our selection. View also 13 sold houses in Hensbroek for extra insight into the local housing market.
1711RN Hensbroek
€ 495.000 k.k.
€ 6.188/m²
1711RR Hensbroek
€ 175.000 k.k.
€ 1.842/m²
1711RR Hensbroek
€ 99.000 k.k.
€ 2.152/m²
1711RM Hensbroek
€ 425.000 k.k.
€ 4.942/m²
1711KM Hensbroek
€ 375.000 k.k.
€ 3.472/m²
1711RX Hensbroek
€ 495.000 k.k.
€ 3.928/m²
1711KM Hensbroek
€ 319.500 k.k.
€ 3.758/m²
1711KM Hensbroek
€ 525.000 k.k.
€ 4.906/m²
1711RJ Hensbroek
€ 800.000 k.k.
€ 3.720/m²
1711RV Hensbroek
€ 425.000 k.k.
€ 4.207/m²
1711SP Hensbroek
€ 650.000 k.k.
€ 4.452/m²
1711KC Hensbroek
€ 340.000 k.k.
€ 2.982/m²
1711RP Hensbroek
€ 595.000 k.k.
€ 5.409/m²
1711KD Hensbroek
€ 325.000 k.k.
€ 3.155/m²
Get free quotes from real estate agents with local market knowledge. Compare more than 66 real estate agents in Hensbroek.
Selling a home in Hensbroek? Compare all real estate agents in Hensbroek or view the top 10 real estate agents in Hensbroek for extra context for your choice.
Real estate agents make sharper offers when they know you're comparing — ask for quotes for sale or purchase.
Practical answers about housing supply, sales and comparing real estate agents in Hensbroek.
The costs of a real estate agent in Hensbroek depend on commission, setup costs, property presentation and the chosen service. Compare the 66 real estate agents in Hensbroek via the real estate agent page and request multiple quotes to compare rates and approach well.
Within our selection, we are currently showing 14 houses in Hensbroek. View also the sold houses in Hensbroek to compare the current offering with recent transactions.
Take into account not only price and living area but also maintenance, energy label, location, outdoor space and sales status. This way you compare houses in Hensbroek on more than just the asking price.
A local real estate agent knows the neighborhoods, recent transactions and demand in Hensbroek. By comparing 66 real estate agents in the region you get a better insight into prices, sales strategy and expected yield; the top 10 in Hensbroek provides a useful starting point.
Yes, when making a sales plan, a valuation in Hensbroek is wise. You gain insight into a realistic asking price and can then compare offers from real estate agents specifically.
View current location data on residents, WOZ development, housing stock, energy consumption, business activity and safety in Hensbroek. In 2025 were there 1.640 residents. The average WOZ value in 2025 is EUR 457.000.
These figures help to better assess and compare the housing stock in Hensbroek with recent sold homes. Orient yourself then on suitable top real estate agents in Hensbroek for sales advice in this region.
Residents
1.640
Last year: 2025
Average WOZ
EUR 457.000
Last year: 2025
Average income per person.
EUR 34.600
Source: AllNumbers
Crimes (current year)
33
Total registered
| Year | Residents |
|---|---|
| 2021 | 1.585 |
| 2022 | 1.565 |
| 2023 | 1.610 |
| 2024 | 1.590 |
| 2025 | 1.640 |
| Year | Average WOZ |
|---|---|
| 2021 | EUR 331.000 |
| 2022 | EUR 370.000 |
| 2023 | EUR 418.000 |
| 2024 | EUR 445.000 |
| 2025 | EUR 457.000 |
Hoger
280
Praktisch
370
Middelbaar
550
Europa
95
Nederland
1.450
Buiten Europa
90
Label C
161
Label A
108
Label G
106
Label D
96
Label B
74
Label F
34
Label A+++
25
Label A++++
22
Label E
17
Label A+
7
Label A++
4
Label A+++++
0
| Year | Gas (m3) | Electricity (kWh) |
|---|---|---|
| 2020 | 1.450 | 3.260 |
| 2021 | 1.640 | 3.370 |
| 2022 | 1.250 | 3.100 |
| 2023 | 1.060 | 3.030 |
| 2024 | 1.020 | 3.060 |
Hoekwoning
Gas: 950 • Electricity: 2.500
Huurwoning
Gas: 870 • Electricity: 1.960
Koopwoning
Gas: 1.100 • Electricity: 3.280
Appartement
Gas: 860 • Electricity: 2.330
Tussenwoning
Gas: 830 • Electricity: 2.000
Vrijstaande woning
Gas: 1.230 • Electricity: 3.650
Twee-onder-één-kap woning
Gas: 930 • Electricity: 2.860
Total number of company establishments: 280
| Period | Crimes |
|---|---|
| jan 2025 | 4 |
| jan 2026 | 1 |
| jul 2025 | 1 |
| jun 2025 | 2 |
| mei 2025 | 1 |
| mrt 2025 | 1 |
| nov 2024 | 1 |
| nov 2025 | 3 |
| okt 2024 | 1 |
| okt 2025 | 5 |
| sep 2024 | 5 |
| sep 2025 | 3 |
These figures give an indicative picture of safety trends in the living environment of Hensbroek.
Short answers based on current local statistics, handy for a quick comparison of the living environment.
Hensbroek telt in 2025 ongeveer 1.640 inwoners.
De gemiddelde WOZ-waarde in Hensbroek is in 2025 circa € 457.000.
Het gemiddelde inkomen per inwoner in Hensbroek ligt rond € 34.600 per jaar.
Voor het huidige jaar gaat het om ongeveer 33 geregistreerde misdrijven. Gebruik deze cijfers als indicatie en vergelijk trends per periode.
In Hensbroek komt vooral "Vrijstaande woningen" veel voor, met ongeveer 318 woningen.