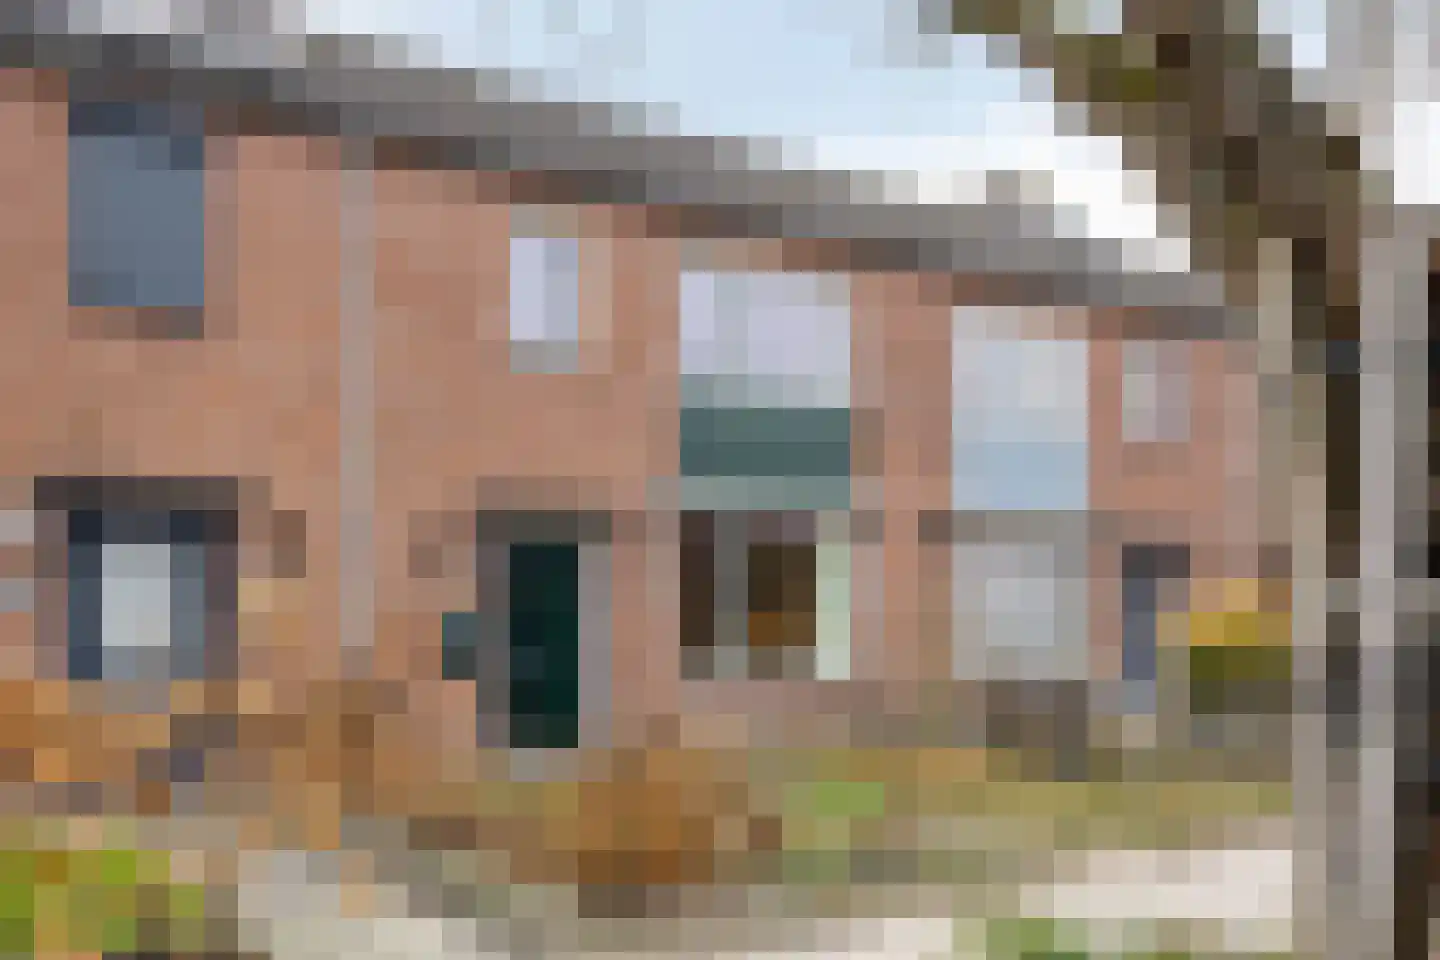
- Sold
De Kleefse Kamp 62
6674DT Herveld
€ 385.000 k.k.
€ 4.375/m²
- Living area
- 88 m²
- Land area
- 109 m²
- Bedrooms
- 4
View 27 sold houses in Herveld
Type to search. Use arrow down and arrow up to navigate through results and press Enter to open.
Hidden search suggestions.
Compare sold homes in Herveld or view the current offering in this location directly.
On this page you will find recently sold homes in Herveld. Use this overview to better estimate selling prices, popular neighborhoods, and the local housing supply before you choose a real estate agent. Also view the current housing supply with 46 houses in Herveld.
6674DT Herveld
€ 385.000 k.k.
€ 4.375/m²
6674LB Herveld
€ 339.000 k.k.
€ 3.897/m²
6674HA Herveld
Price upon request
6674BP Herveld
€ 395.000 k.k.
€ 3.435/m²
6674DH Herveld
€ 575.000 k.k.
€ 3.885/m²
6674HB Herveld
€ 415.000 k.k.
€ 3.772/m²
6674EB Herveld
€ 885.000 k.k.
€ 4.538/m²
6674DP Herveld
€ 719.500 k.k.
€ 5.214/m²
6674AM Herveld
€ 385.000 k.k.
€ 4.873/m²
6674AW Herveld
€ 529.000 k.k.
€ 3.806/m²
6674DT Herveld
€ 385.000 k.k.
€ 4.230/m²
6674HL Herveld
€ 575.000 k.k.
€ 4.259/m²
6674DM Herveld
€ 375.000 k.k.
€ 4.360/m²
6674AH Herveld
€ 539.000 k.k.
€ 4.052/m²
6674AM Herveld
€ 398.000 k.k.
€ 3.864/m²
6674AT Herveld
€ 645.000 k.k.
€ 4.923/m²
6674GA Herveld
€ 375.000 k.k.
€ 3.947/m²
6674BL Herveld
€ 449.000 k.k.
€ 3.773/m²
6674DP Herveld
€ 594.500 k.k.
€ 4.573/m²
6674BE Herveld
€ 1.150.000 k.k.
€ 0/m²
6674DT Herveld
€ 389.000 k.k.
€ 4.228/m²
6674EM Herveld
€ 599.000 k.k.
€ 3.966/m²
6674HB Herveld
€ 399.500 k.k.
€ 3.301/m²
6674GB Herveld
€ 525.000 k.k.
€ 4.861/m²
6674AW Herveld
€ 675.000 k.k.
€ 4.218/m²
6674DP Herveld
€ 795.000 k.k.
€ 5.845/m²
6674BH Herveld
€ 400.000 k.k.
€ 4.597/m²
View recent sales and receive free quotes from local real estate agents. Compare more than 60 real estate agents in Herveld.
Selling your own home in Herveld? Compare real estate agents in Herveld or view the best real estate agents in Herveld as a reference for your choice.
Real estate agents make sharper offers when they know you're comparing — ask for quotes for sale or purchase.
Short answers about housing prices, sold homes and comparing real estate agents in Herveld.
The costs of a real estate agent in Herveld vary per office, property type and sales approach. In Herveld you can compare 60 real estate agents; therefore also look at the real estate agents in Herveld to better compare fees, presentation and local experience.
On this page we currently show 27 sold houses in Herveld from our selection. This helps you to better assess recent transactions and the local housing market.
Houses sold in Herveld give insight into asking prices, house types and neighborhoods where recent transactions have taken place. Compare this also with the current housing stock in Herveld to better understand the market.
You can use sold homes as a first market indication, but a local real estate agent can better take into account finishing, location, maintenance and current demand in Herveld.
Compare the 60 real estate agents in Herveld on local sales experience, reviews, expected yield, commission and marketing approach. View real estate agents in Herveld or the top 10 agents in Herveld to quickly discover strong offices.
View current location data on residents, WOZ development, housing stock, energy consumption, business activity and safety in Herveld. In 2026 were there 3.192 residents. The average WOZ value in 2025 is EUR 448.000.
These figures help to better assess and compare the housing stock in Herveld with recent sold homes. Orient yourself then on suitable top real estate agents in Herveld for sales advice in this region.
Residents
3.192
Last year: 2026
Average WOZ
EUR 448.000
Last year: 2025
Average income per person.
EUR 35.000
Source: AllNumbers
Crimes (current year)
71
Total registered
| Year | Residents |
|---|---|
| 2021 | 3.075 |
| 2022 | 3.070 |
| 2023 | 3.185 |
| 2024 | 3.165 |
| 2025 | 3.190 |
| 2026 | 3.192 |
| Year | Average WOZ |
|---|---|
| 2021 | EUR 303.000 |
| 2022 | EUR 341.000 |
| 2023 | EUR 403.000 |
| 2024 | EUR 429.000 |
| 2025 | EUR 448.000 |
Hoger
610
Praktisch
680
Middelbaar
1.070
Europa
145
Nederland
2.895
Buiten Europa
145
Label A
371
Label B
266
Label C
243
Label G
136
Label A++++
100
Label D
79
Label F
71
Label E
39
Label A+
12
Label A+++
10
Label A++
9
Label A+++++
1
| Year | Gas (m3) | Electricity (kWh) |
|---|---|---|
| 2020 | 1.370 | 3.560 |
| 2021 | 1.500 | 3.570 |
| 2022 | 1.100 | 3.350 |
| 2023 | 900 | 3.210 |
| 2024 | 880 | 3.350 |
Hoekwoning
Gas: 780 • Electricity: 3.040
Huurwoning
Gas: 670 • Electricity: 2.310
Koopwoning
Gas: 980 • Electricity: 3.500
Appartement
Gas: 570 • Electricity: 1.800
Tussenwoning
Gas: 660 • Electricity: 2.830
Vrijstaande woning
Gas: 1.300 • Electricity: 4.300
Twee-onder-één-kap woning
Gas: 980 • Electricity: 3.270
Total number of company establishments: 480
| Period | Crimes |
|---|---|
| jan 2026 | 7 |
| jul 2025 | 7 |
| jun 2025 | 7 |
| mei 2025 | 11 |
| mrt 2025 | 7 |
| mrt 2026 | 3 |
| nov 2024 | 7 |
| nov 2025 | 3 |
| okt 2024 | 12 |
| okt 2025 | 4 |
| sep 2024 | 4 |
| sep 2025 | 4 |
These figures give an indicative picture of safety trends in the living environment of Herveld.
Short answers based on current local statistics, handy for a quick comparison of the living environment.
Herveld telt in 2026 ongeveer 3.192 inwoners.
De gemiddelde WOZ-waarde in Herveld is in 2025 circa € 448.000.
Het gemiddelde inkomen per inwoner in Herveld ligt rond € 35.000 per jaar.
Voor het huidige jaar gaat het om ongeveer 71 geregistreerde misdrijven. Gebruik deze cijfers als indicatie en vergelijk trends per periode.
In Herveld komt vooral "Vrijstaande woningen" veel voor, met ongeveer 430 woningen.