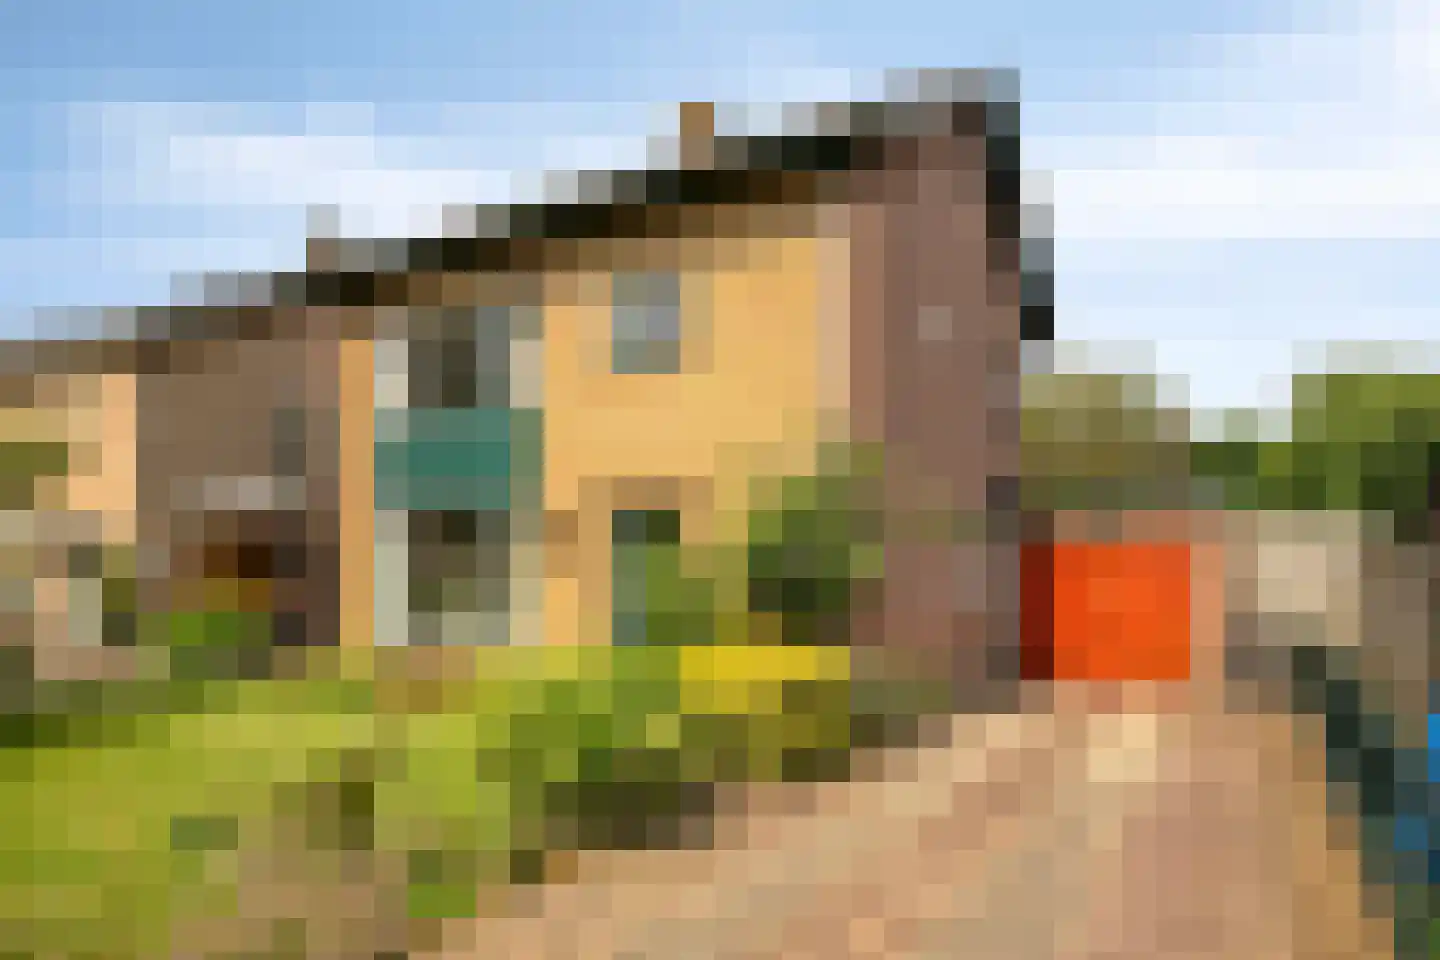
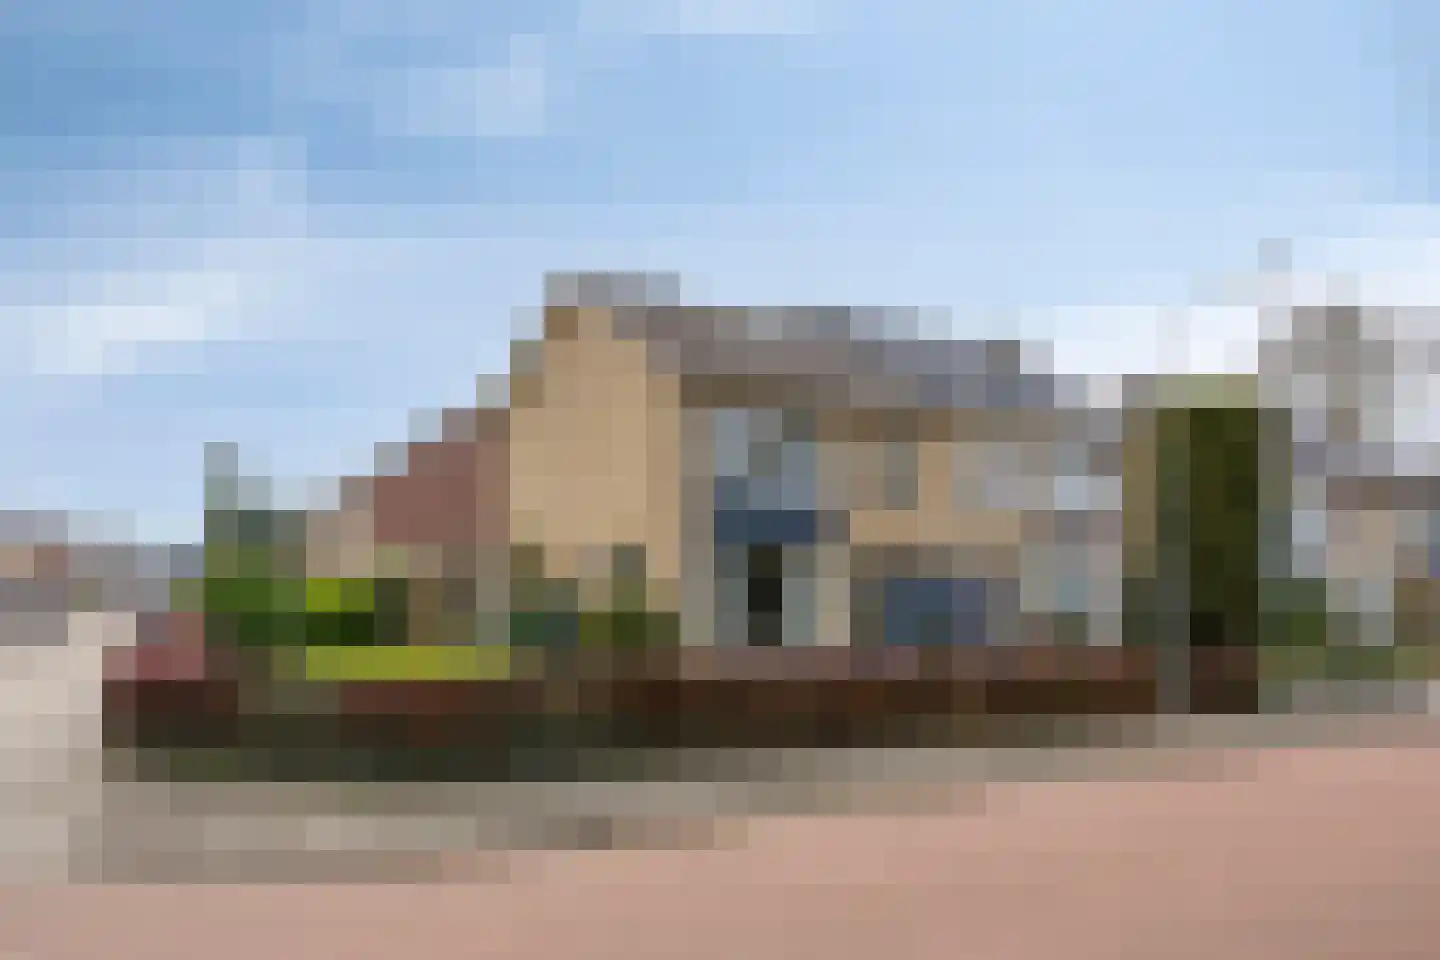
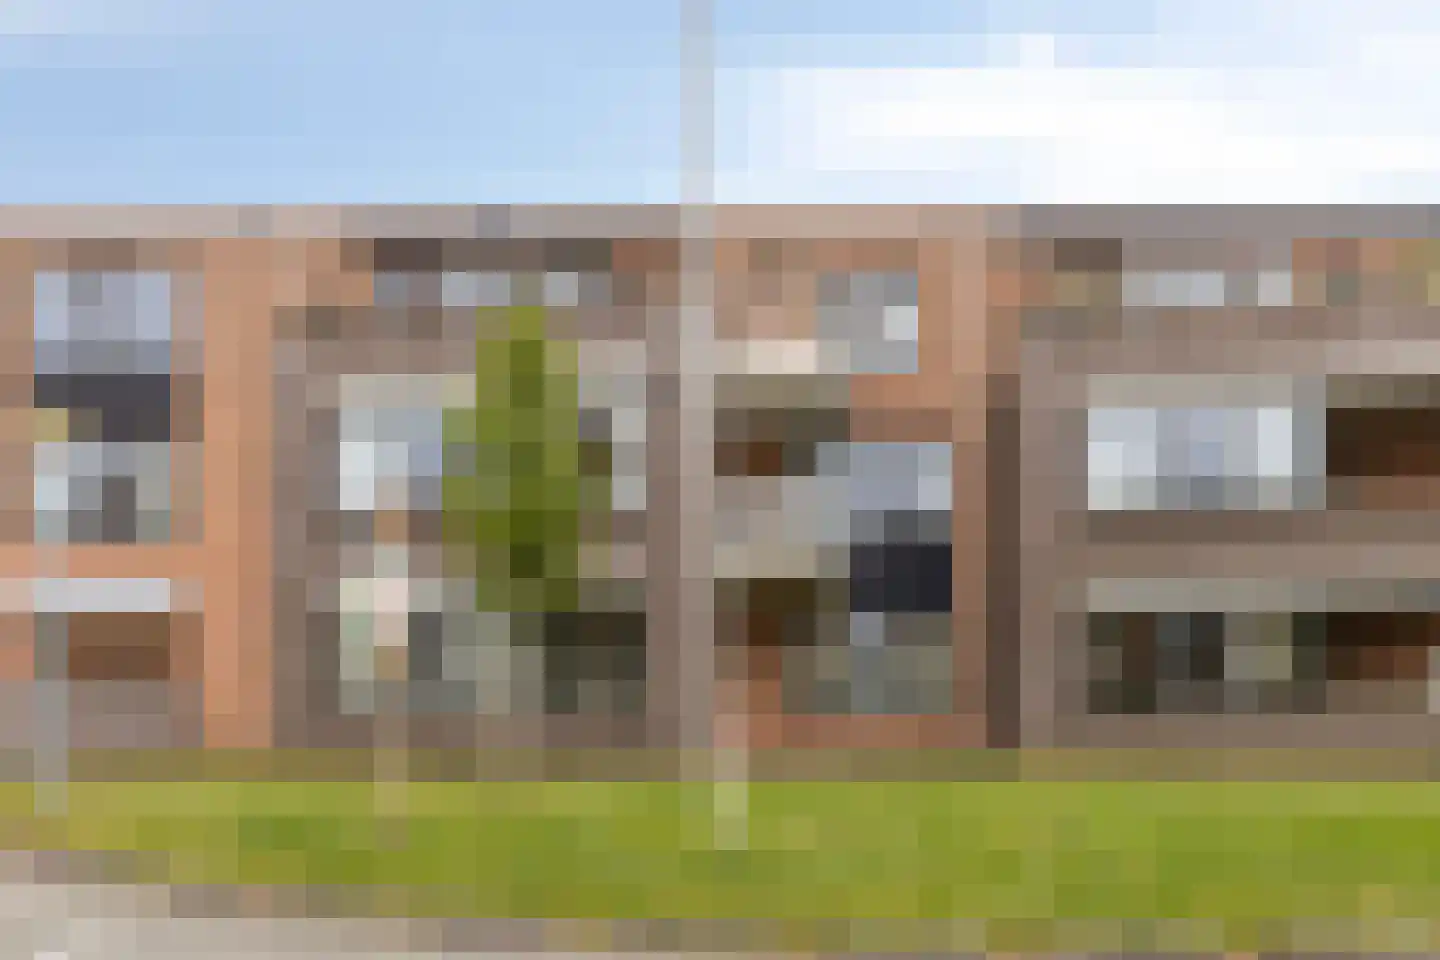
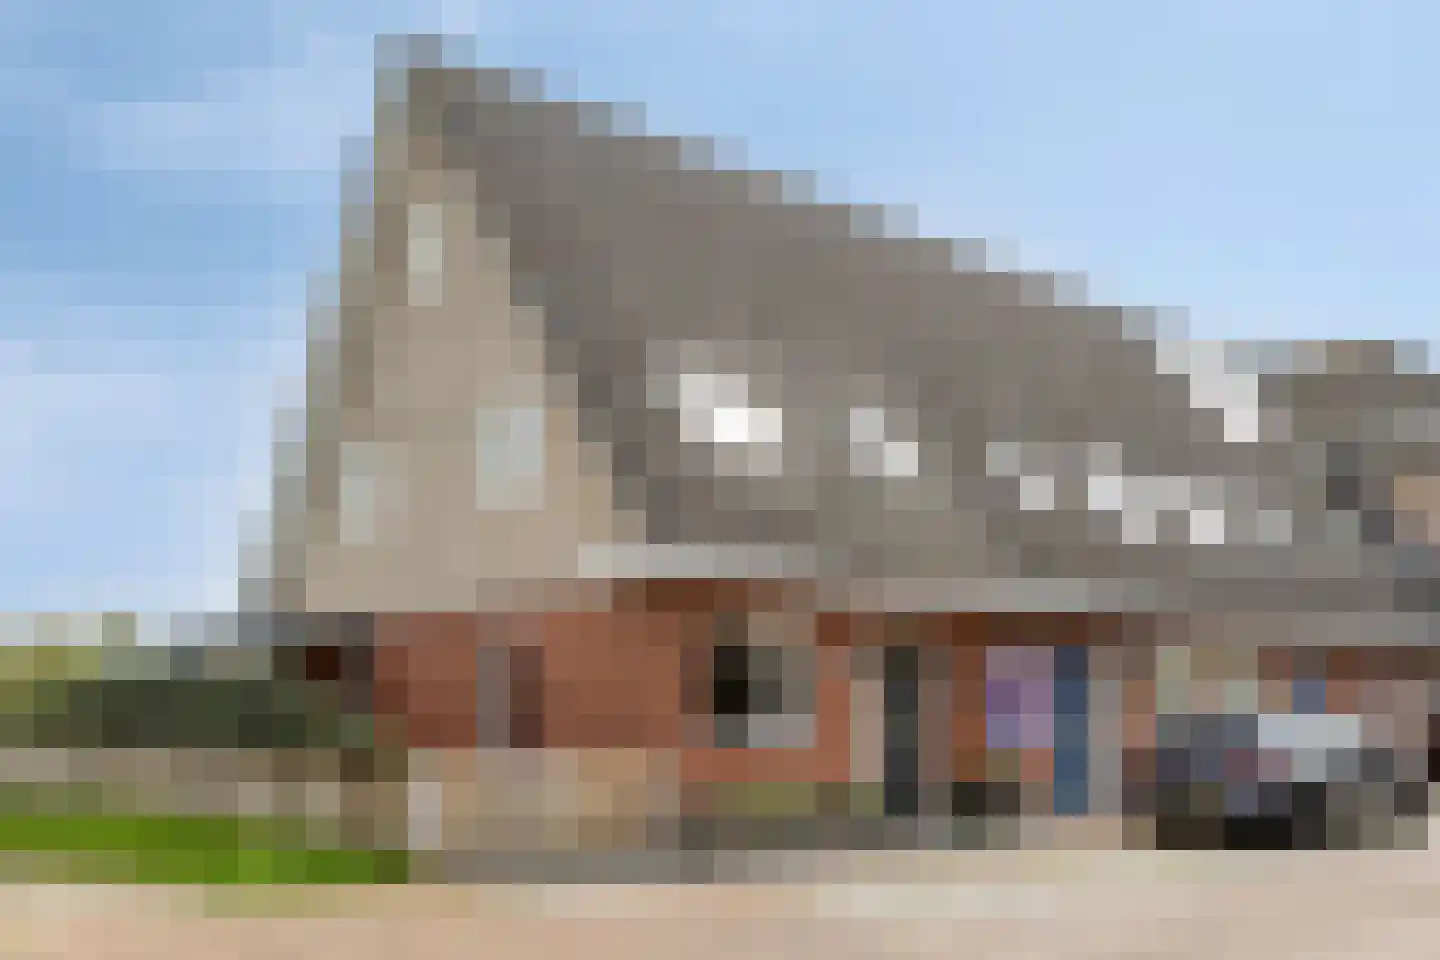
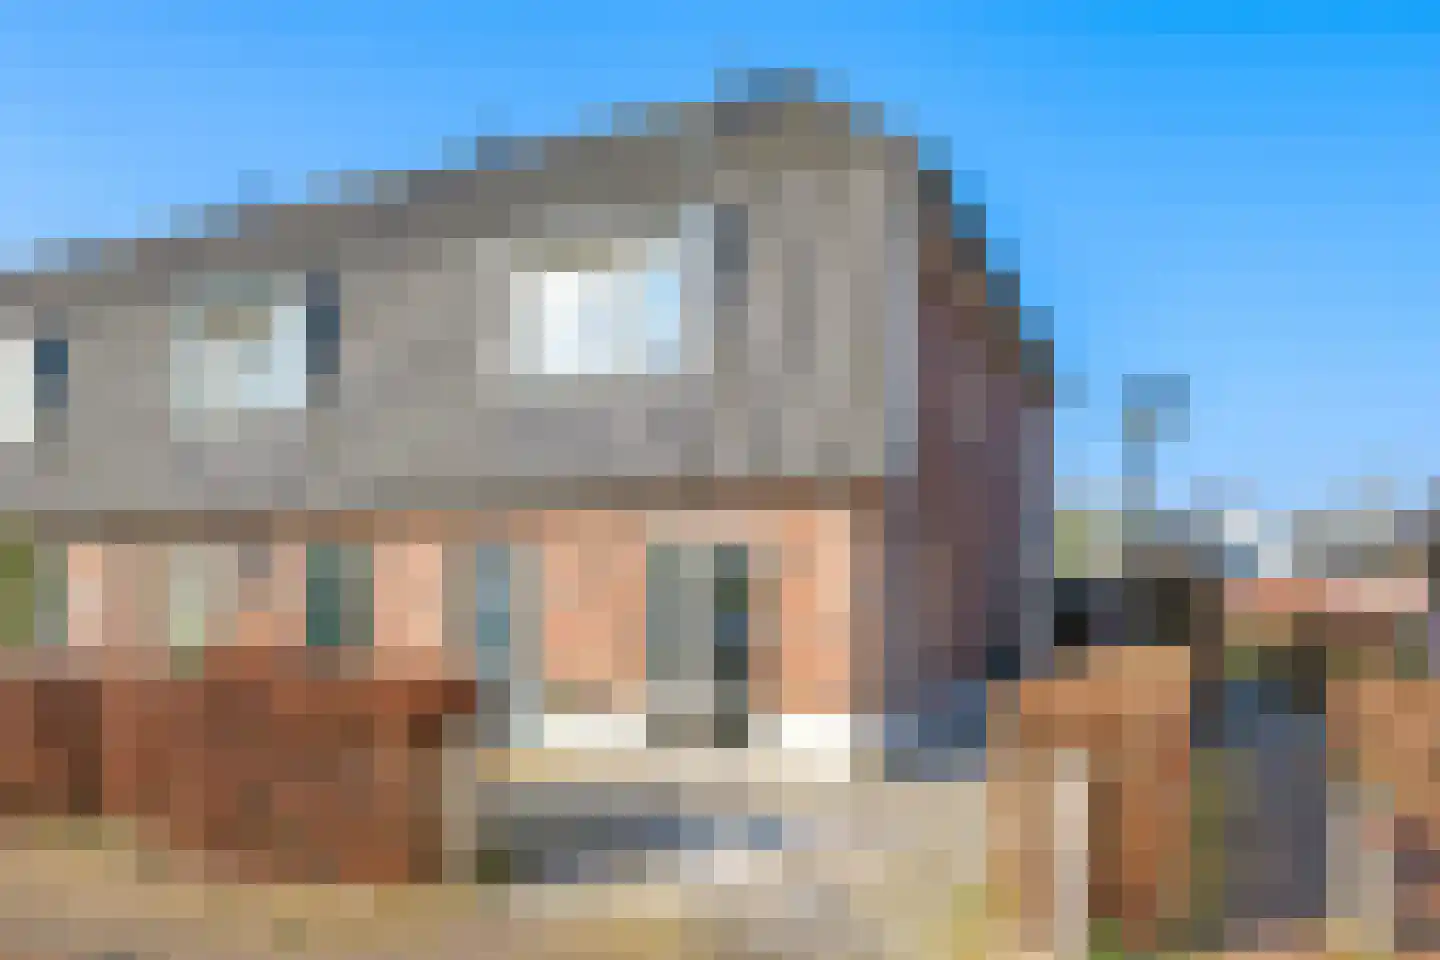
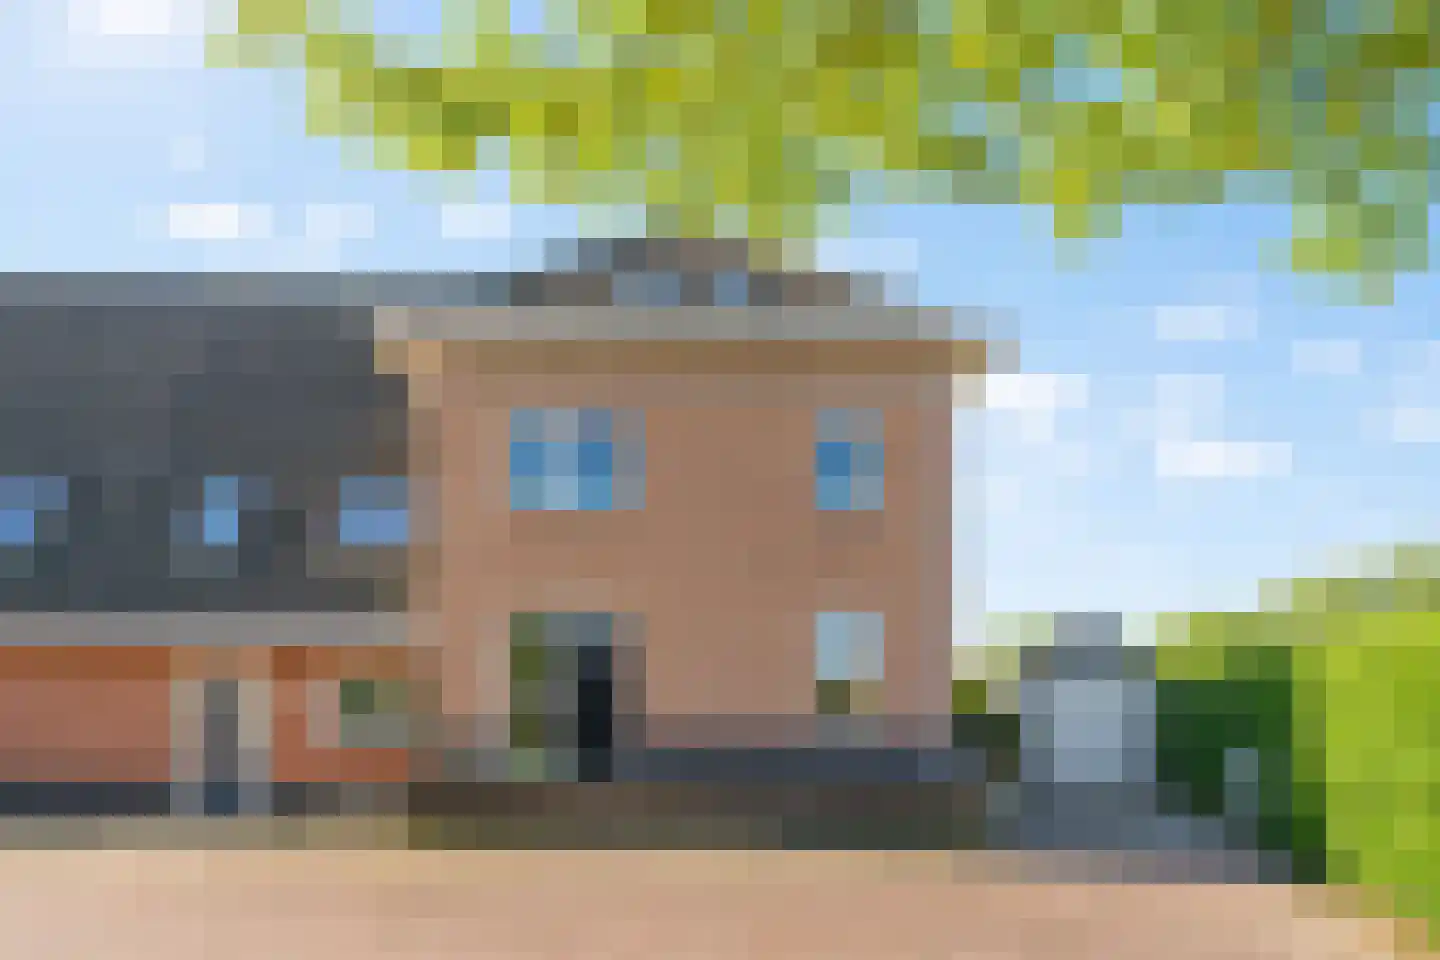
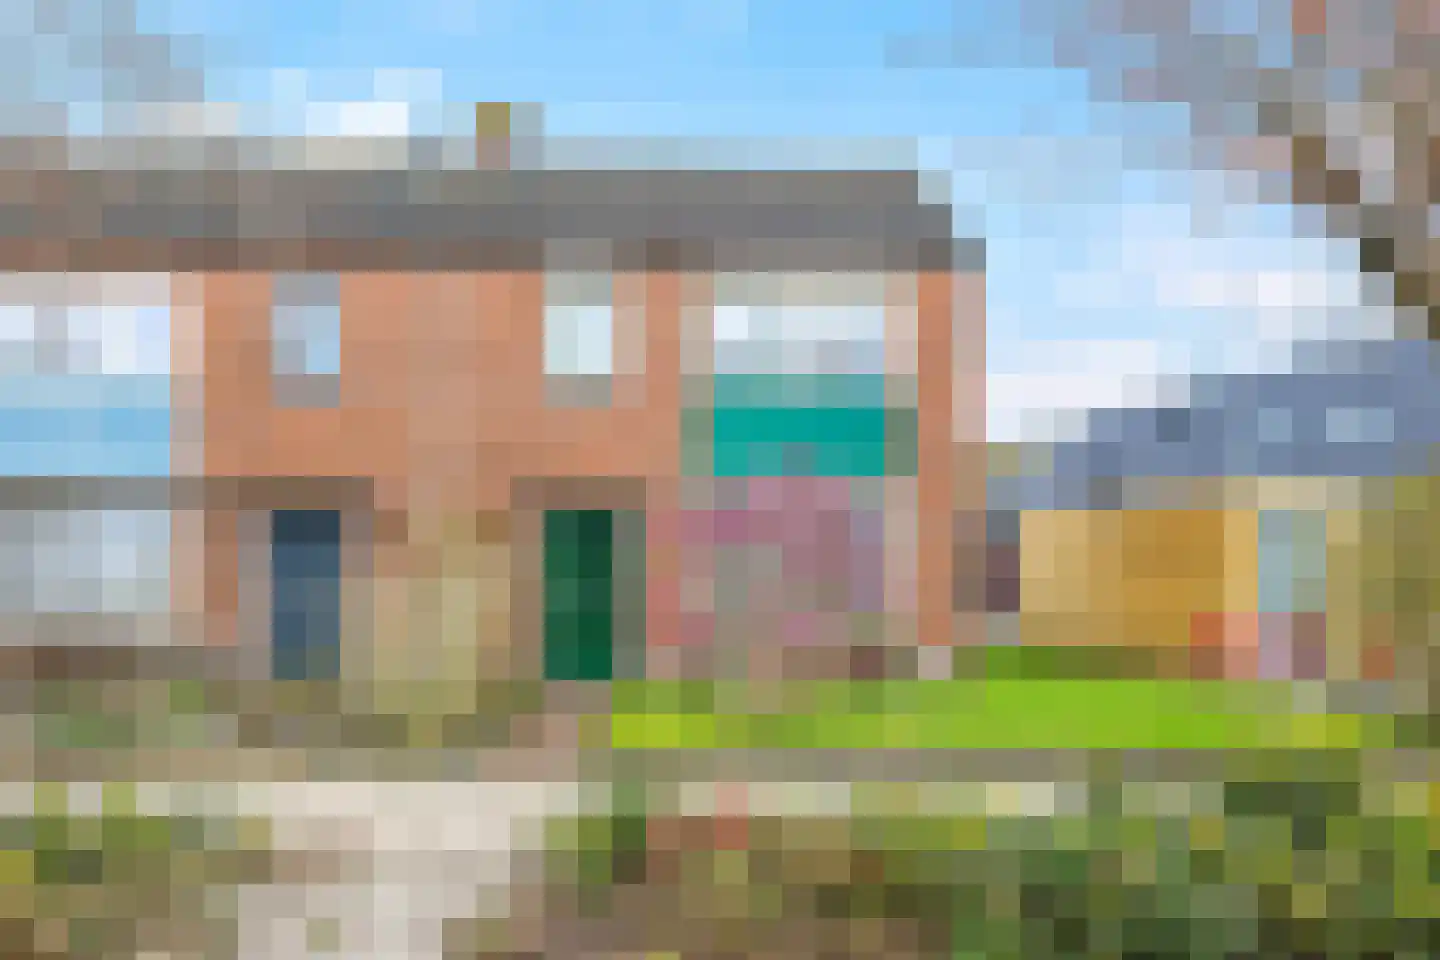
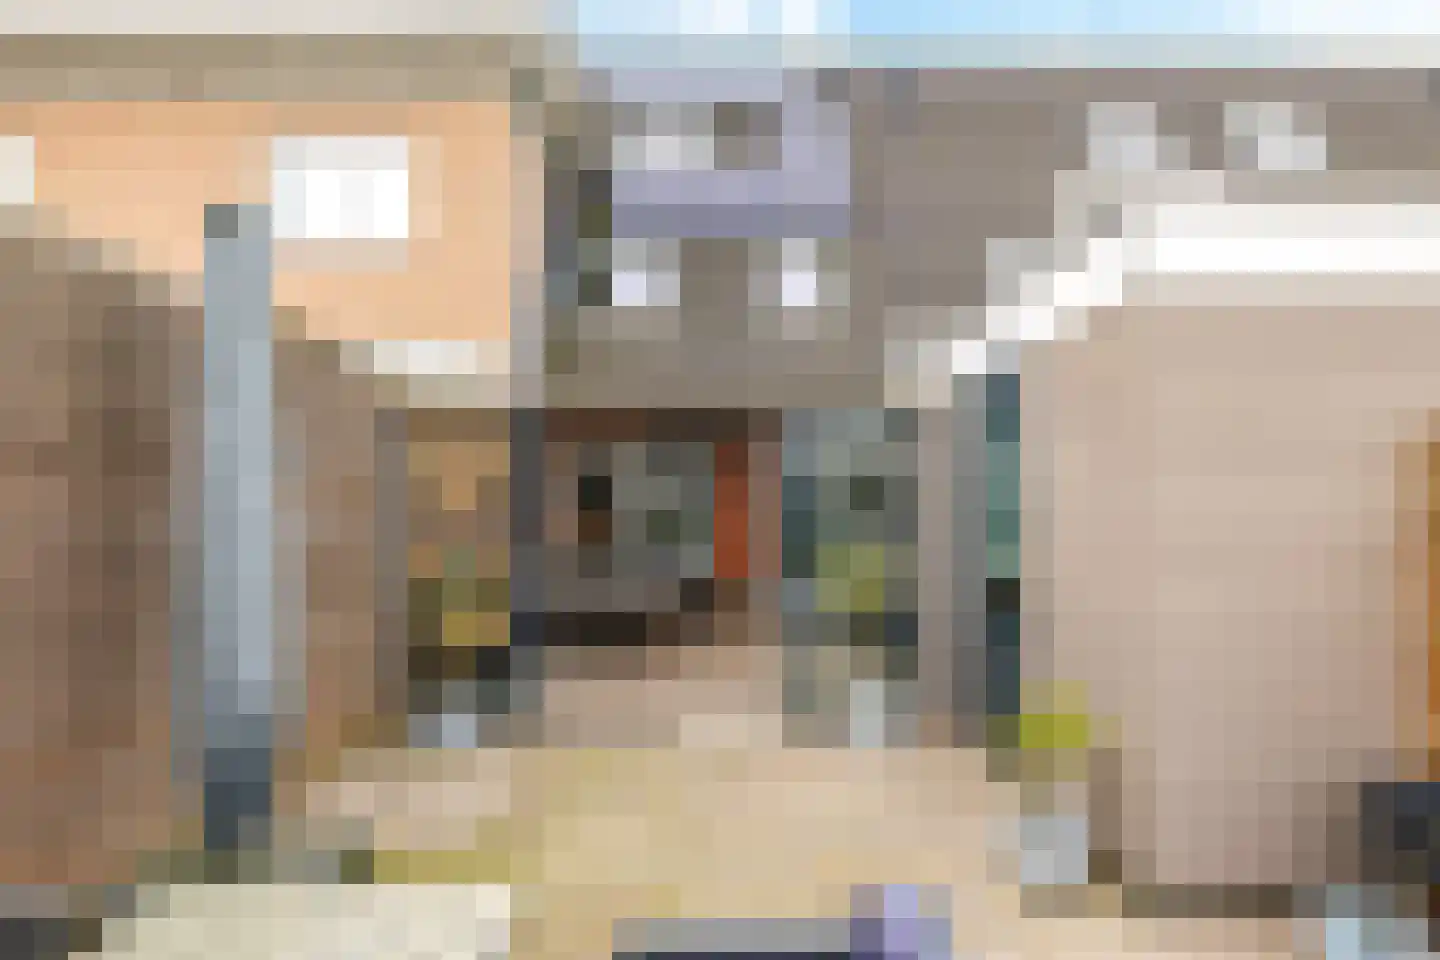
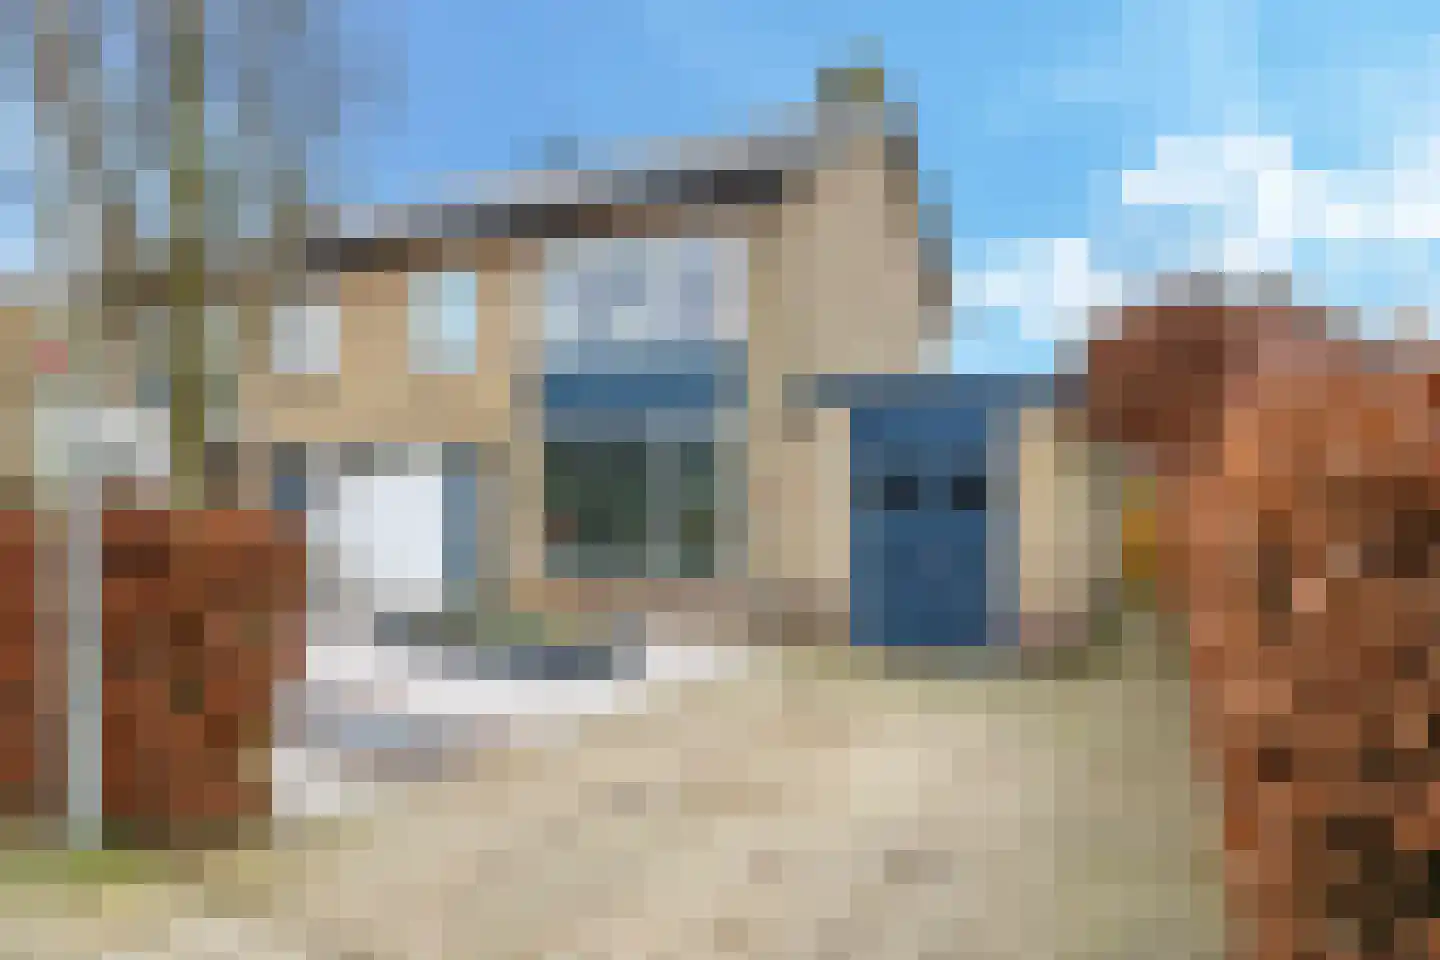
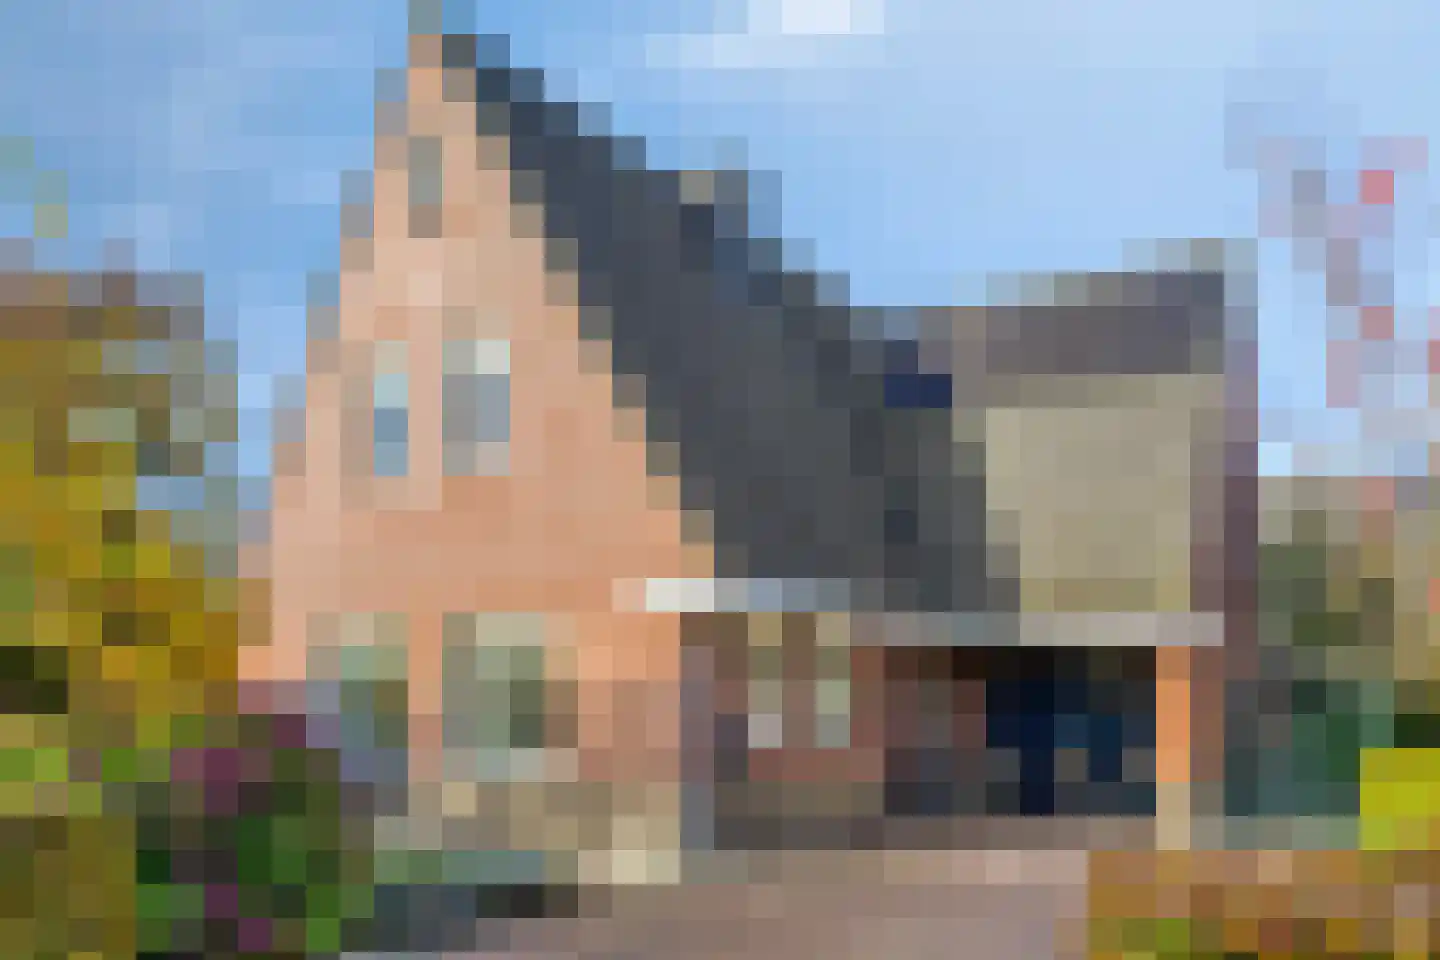
- Available
Grasklokje 8
6674HK Herveld
€ 450.000 k.k.
€ 3.782/m²
- Living area
- 119 m²
- Land area
- 133 m²
- Bedrooms
- 4
Searching in 46 houses in Herveld
Type to search. Use arrow down and arrow up to navigate through results and press Enter to open.
Hidden search suggestions.
View current properties in Herveld or search targeted on street, postal code and property characteristics.
View the current housing stock in Herveld and quickly filter by price, living area, rooms and more. There are currently 46 houses in this place within our selection. View also 27 sold houses in Herveld for extra insight into the local housing market.
6674HK Herveld
€ 450.000 k.k.
€ 3.782/m²
6674BB Herveld
€ 499.000 k.k.
€ 4.941/m²
6674DN Herveld
€ 1.099.000 k.k.
€ 4.396/m²
6674DM Herveld
€ 549.000 k.k.
€ 4.774/m²
6674GC Herveld
€ 548.000 k.k.
€ 5.028/m²
6674BG Herveld
€ 399.000 k.k.
€ 4.483/m²
6674DH Herveld
€ 625.000 k.k.
€ 6.313/m²
6674BH Herveld
€ 425.000 k.k.
€ 3.972/m²
6674DM Herveld
€ 575.000 k.k.
€ 5.000/m²
6674GA Herveld
€ 389.000 k.k.
€ 4.052/m²
6674DT Herveld
€ 399.000 k.k.
€ 4.534/m²
6674HC Herveld
€ 449.000 k.k.
€ 4.119/m²
6674DT Herveld
€ 675.000 k.k.
€ 3.516/m²
6674LB Herveld
€ 350.000 k.k.
€ 4.023/m²
6674GC Herveld
€ 469.000 k.k.
€ 4.343/m²
6674DM Herveld
€ 385.000 k.k.
€ 4.753/m²
6674BP Herveld
€ 289.000 k.k.
€ 3.284/m²
6674DT Herveld
€ 385.000 k.k.
€ 4.375/m²
6674BG Herveld
€ 535.000 k.k.
€ 4.115/m²
6674LB Herveld
€ 339.000 k.k.
€ 3.897/m²
6674HA Herveld
Price upon request
6674BP Herveld
€ 395.000 k.k.
€ 3.435/m²
6674DH Herveld
€ 575.000 k.k.
€ 3.885/m²
6674HB Herveld
€ 415.000 k.k.
€ 3.772/m²
6674EB Herveld
€ 885.000 k.k.
€ 4.538/m²
6674DP Herveld
€ 719.500 k.k.
€ 5.214/m²
6674AM Herveld
€ 385.000 k.k.
€ 4.873/m²
6674AW Herveld
€ 529.000 k.k.
€ 3.806/m²
Get free quotes from real estate agents with local market knowledge. Compare more than 60 real estate agents in Herveld.
Selling a home in Herveld? Compare all real estate agents in Herveld or view the top 10 real estate agents in Herveld for extra context for your choice.
Real estate agents make sharper offers when they know you're comparing — ask for quotes for sale or purchase.
Practical answers about housing supply, sales and comparing real estate agents in Herveld.
The costs of a real estate agent in Herveld depend on commission, setup costs, property presentation and the chosen service. Compare the 60 real estate agents in Herveld via the real estate agent page and request multiple quotes to compare rates and approach well.
Within our selection, we are currently showing 46 houses in Herveld. View also the sold houses in Herveld to compare the current offering with recent transactions.
Take into account not only price and living area but also maintenance, energy label, location, outdoor space and sales status. This way you compare houses in Herveld on more than just the asking price.
A local real estate agent knows the neighborhoods, recent transactions and demand in Herveld. By comparing 60 real estate agents in the region you get a better insight into prices, sales strategy and expected yield; the top 10 in Herveld provides a useful starting point.
Yes, when making a sales plan, a valuation in Herveld is wise. You gain insight into a realistic asking price and can then compare offers from real estate agents specifically.
View current location data on residents, WOZ development, housing stock, energy consumption, business activity and safety in Herveld. In 2026 were there 3.192 residents. The average WOZ value in 2025 is EUR 448.000.
These figures help to better assess and compare the housing stock in Herveld with recent sold homes. Orient yourself then on suitable top real estate agents in Herveld for sales advice in this region.
Residents
3.192
Last year: 2026
Average WOZ
EUR 448.000
Last year: 2025
Average income per person.
EUR 35.000
Source: AllNumbers
Crimes (current year)
71
Total registered
| Year | Residents |
|---|---|
| 2021 | 3.075 |
| 2022 | 3.070 |
| 2023 | 3.185 |
| 2024 | 3.165 |
| 2025 | 3.190 |
| 2026 | 3.192 |
| Year | Average WOZ |
|---|---|
| 2021 | EUR 303.000 |
| 2022 | EUR 341.000 |
| 2023 | EUR 403.000 |
| 2024 | EUR 429.000 |
| 2025 | EUR 448.000 |
Hoger
610
Praktisch
680
Middelbaar
1.070
Europa
145
Nederland
2.895
Buiten Europa
145
Label A
371
Label B
266
Label C
243
Label G
136
Label A++++
100
Label D
79
Label F
71
Label E
39
Label A+
12
Label A+++
10
Label A++
9
Label A+++++
1
| Year | Gas (m3) | Electricity (kWh) |
|---|---|---|
| 2020 | 1.370 | 3.560 |
| 2021 | 1.500 | 3.570 |
| 2022 | 1.100 | 3.350 |
| 2023 | 900 | 3.210 |
| 2024 | 880 | 3.350 |
Hoekwoning
Gas: 780 • Electricity: 3.040
Huurwoning
Gas: 670 • Electricity: 2.310
Koopwoning
Gas: 980 • Electricity: 3.500
Appartement
Gas: 570 • Electricity: 1.800
Tussenwoning
Gas: 660 • Electricity: 2.830
Vrijstaande woning
Gas: 1.300 • Electricity: 4.300
Twee-onder-één-kap woning
Gas: 980 • Electricity: 3.270
Total number of company establishments: 480
| Period | Crimes |
|---|---|
| jan 2026 | 7 |
| jul 2025 | 7 |
| jun 2025 | 7 |
| mei 2025 | 11 |
| mrt 2025 | 7 |
| mrt 2026 | 3 |
| nov 2024 | 7 |
| nov 2025 | 3 |
| okt 2024 | 12 |
| okt 2025 | 4 |
| sep 2024 | 4 |
| sep 2025 | 4 |
These figures give an indicative picture of safety trends in the living environment of Herveld.
Short answers based on current local statistics, handy for a quick comparison of the living environment.
Herveld telt in 2026 ongeveer 3.192 inwoners.
De gemiddelde WOZ-waarde in Herveld is in 2025 circa € 448.000.
Het gemiddelde inkomen per inwoner in Herveld ligt rond € 35.000 per jaar.
Voor het huidige jaar gaat het om ongeveer 71 geregistreerde misdrijven. Gebruik deze cijfers als indicatie en vergelijk trends per periode.
In Herveld komt vooral "Vrijstaande woningen" veel voor, met ongeveer 430 woningen.